Prime Mixed-Use Development
For Sale
Contact for pricing
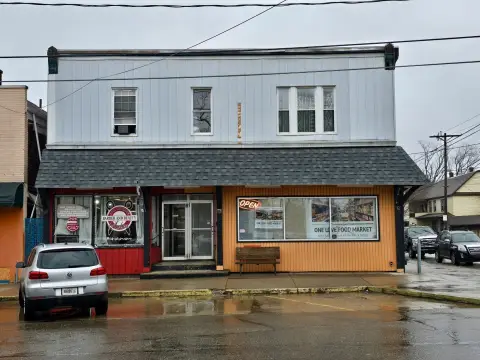
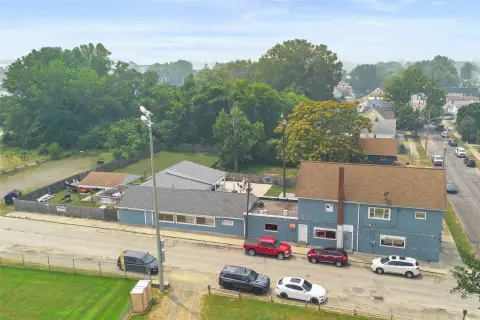
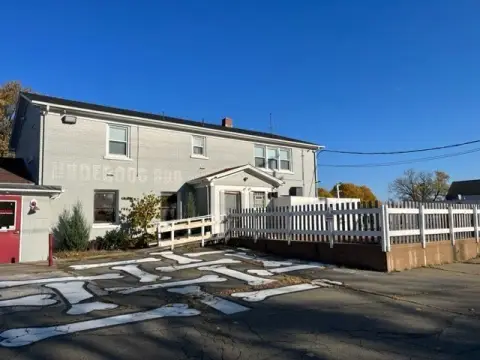
4912 & 4916 W Ridge Road, Erie, PA 16506
4.25-acre site with high visibility and redevelopment potential.
Property Size9,131 SF
Lot Size4.25 Acres
Price / SF$131.42
Days on Market198
Property Features for 4912 & 4916 W Ridge Road
General Information
Standard status
Active
Size
9,131 SF
Total Parking Spaces
10
Lot size
4.25 Acres
Property subtype
Retail, Mixed Use
Zoning
M-2
Building Details
Year Built
1950
Listing Agency:
Agresti Real Estate
Listed By:
Jake Scheloske · License #PA RS.318016
(814) 449-7973
Source:
Crexi
Added: Mar 27
Changed: Oct 9
Last Checked: Oct 9 at 7:56PM
Displayed information is deemed reliable but is not guaranteed and should be independently verified. All listing content including descriptions, pricing, images are the copyrighted material of Agresti Real Estate
Investment Insights
Based on property information with market context.
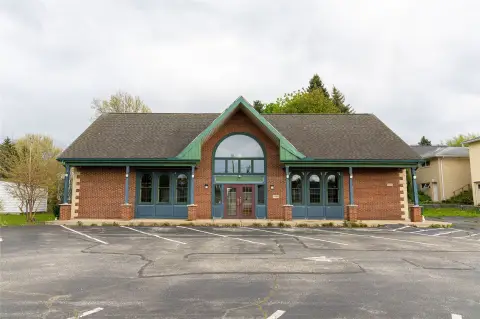
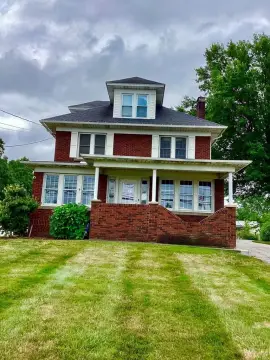
This premier 4.25-acre mixed-use development site is located at 4912 & 4916 W Ridge Rd in Millcreek. Positioned along a heavily traveled commercial corridor, the property offers visibility, accessibility, and long-term redevelopment potential. The MU-2 zoning allows for a spectrum of development possibilities including multi-family residential, retail, office, service, medical, or integrated mixed-use concepts. All utilities are already run across the lot. The size and configuration of the parcel allow for phased development or a single comprehensive project. The property is surrounded by established anchors like Wegmans, Chipotle, Starbucks, PNC, and Erie Insurance, as well as other ongoing development. Currently on the property is a 9,000 sq. ft. tool and dye shop built in 1980, a two-unit residential rental, and a mobile home. The property size is 9,131 square feet.
Key Highlights
- 4.25‑acre mixed‑use development site in a high‑traffic commercial corridor.
- MU‑2 zoning allows for diverse development options (multi‑family, retail, office, medical, etc.).
- All utilities are already run across the lot.
Financial Insights
Estimated NOI and Cap Rate
NOI / Yr
$92,451
Cap Rate
7.70%
Suggested Prices Based on Cap Rates
Cap Rate 5%
$1,849,020
$1.8M
Cap Rate 7%
$1,320,729
$1.3M
Cap Rate 9%
$1,027,233
$1.0M
Market Conditions
NOI Build-Up for 9,131 SF
Gross rent
$164.4K $18.00/SF
− Vacancy
−$16.4K −$1.80/SF
EGI
$147.9K $16.20/SF
− OpEx
−$55.5K −$6.07/SF
NOI
$92.5K $10.13/SF
Area
Erie County, PA
Vacancy
10.00%
Lease Rate
$18.00 /SF/Yr
Expense Ratio
37.50%
Simulate Cap Rate and NOI
Suggested Prices Based on Cap Rates
Cap Rate 5%
$1,849,020
Cap Rate 7%
$1,320,729
Cap Rate 9%
$1,027,233
Alternative Uses
Best Use
Mixed Use
$1.32M
$1.16M – $1.54M
NOI $92,451 @ 7.0% cap · market cap 7.70%
Second Best
—
—
no second resolved use
Theoretical Best
Office A
$2.27M
$1.98M – $2.64M
NOI $158,573 @ 7.0% cap · market cap 13.21%
Zoning and permitted uses should be independently verified with authorities.
Property Analytics
Unlock full access to Insights
Subscribe to Realmo Intelligence
Open Analytics
Current Use
Location Intelligence
Trade Area within ½ mile
269
Businesses Nearby
Explore this area
Business Placement
Demographics for 16506, PA
23,918
Population
10,309
Households
2.3
Avg Household Size
44
Median Age
39%
College-Educated
96%
High-School Grad
13.6 sq mi
ZIP Area
1,759
Density / Sq Mi
$84,021
Median Household Income
$47,823
Median Earnings
$1,176
Median Rent
$224,200
Median Home Value
Check the figures for this property
Cap Rate, Value Estimation, Potential NOI and more
View Realmo Analytics

Questions? Ask Rey
Realmo’s AI knows this listing — price, zoning, demand, history. Ask anything.




Frequently Asked Questions
What type of property is this?
Commercial land - 4.25-acre site with high visibility and redevelopment potential.
Where is this commercial land located?
The property is located at 4912 & 4916 W Ridge Road Erie, PA.
What is the asking price?
The asking price for this property is $1,200,000.
What are key features of this property?
This property features: 4.25‑acre mixed‑use development site in a high‑traffic commercial corridor.; MU‑2 zoning allows for diverse development options (multi‑family, retail, office, medical, etc.).; All utilities are already run across the lot.


