Land with Workshops and
For Sale
$569,000
49 Cutting Edge Ln, Dunlap, TN 37327
Commercial Sale, Dunlap, TN
Property Size2,400 SF
Lot Size0.00 Acres
Price / SF$237.08
Days on Market104
Property Features for 49 Cutting Edge Ln
General Information
Property type
Commercial Sale
Property subtype
Other
Directions
Head southeast on Rankin Ave toward Hwy 111, turn right onto TN-111 S, continue for approximately 3 miles, turn left onto Cutting Edge Ln, continue to 49 Cutting Edge Ln, which will be on your left. Estimated drive time is about 7-10 minutes depending on traffic.
Subdivision
Sequatchie Co., TN
Standard status
Active
APN
046.00
Size
2,400 SF
Lot size
0.00 Acres
Taxes and HOA fees
Tax Annual Amount
796
Utilities
Utilities
Electricity Available
Heating system
Electric (Heating)
Cooling system
Central Air
Water source
Public
Building Details
Year built
1997
Floors in Building
1
Building materials
Block, Vinyl Siding
Roof type
Metal
Listing Agency:
Century 21 Professional Group
(423) 949-7653
Listed By:
Pam Brown
(423) 605-8026
Added: Jul 7
Changed: Oct 16
Last Checked: Oct 18 at 5:06PM
MLS# 244457
Copyright © 2026 Upper Cumberland Association of Realtors. All rights reserved. All information provided by the listing agent/broker is deemed reliable but is not guaranteed and should be independently verified.

Ask AI about this property
Review the available facts, identify missing information and prepare questions for the agent.
Investment Insights
Based on property information with market context.
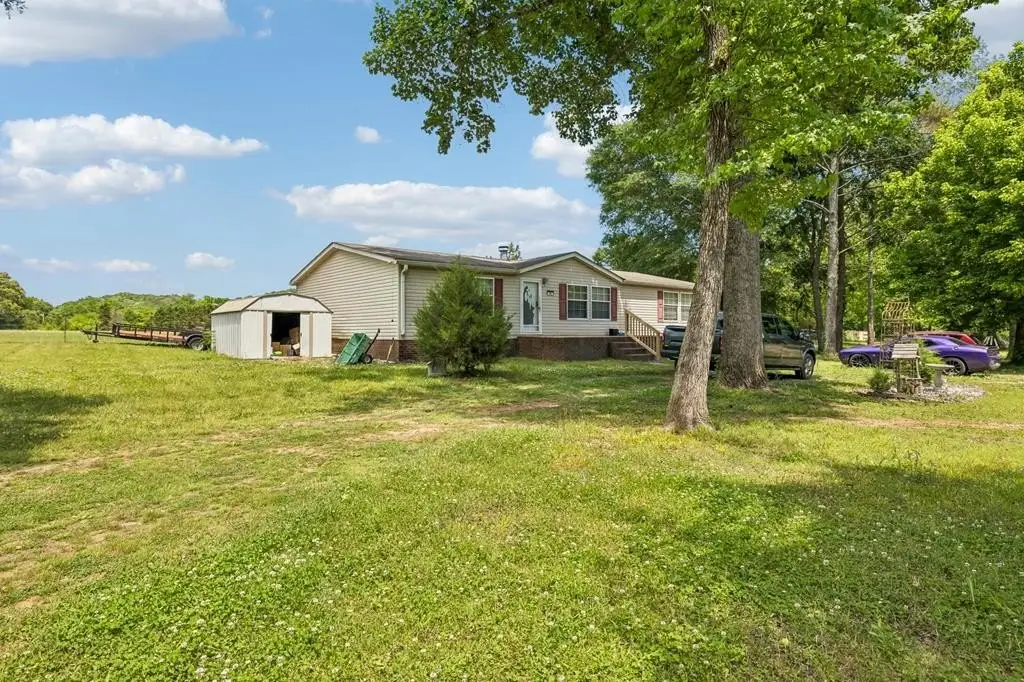
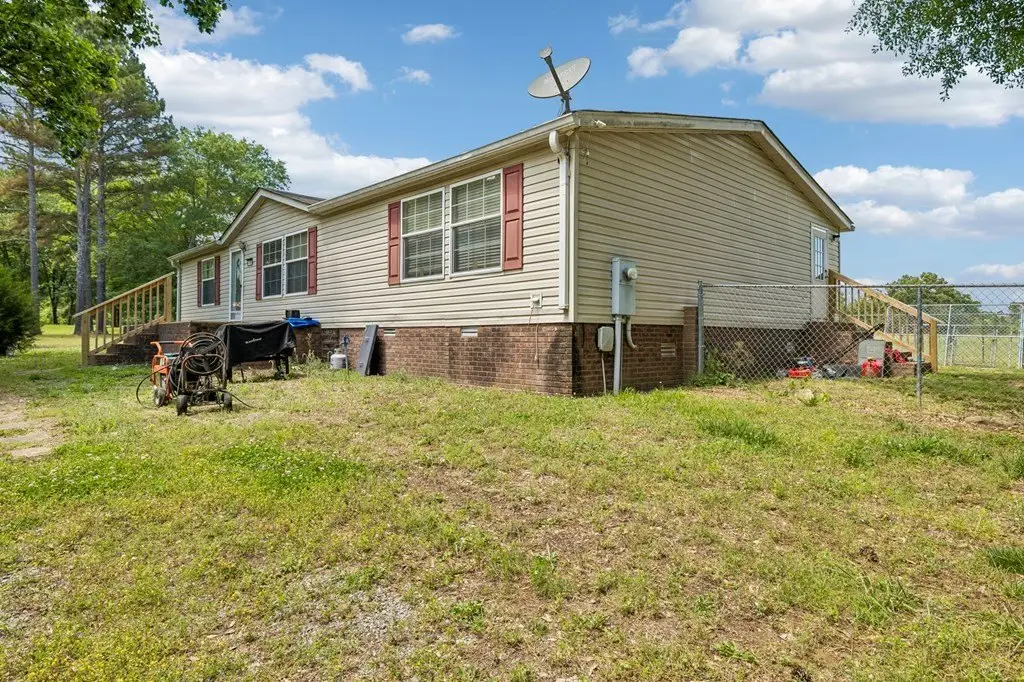
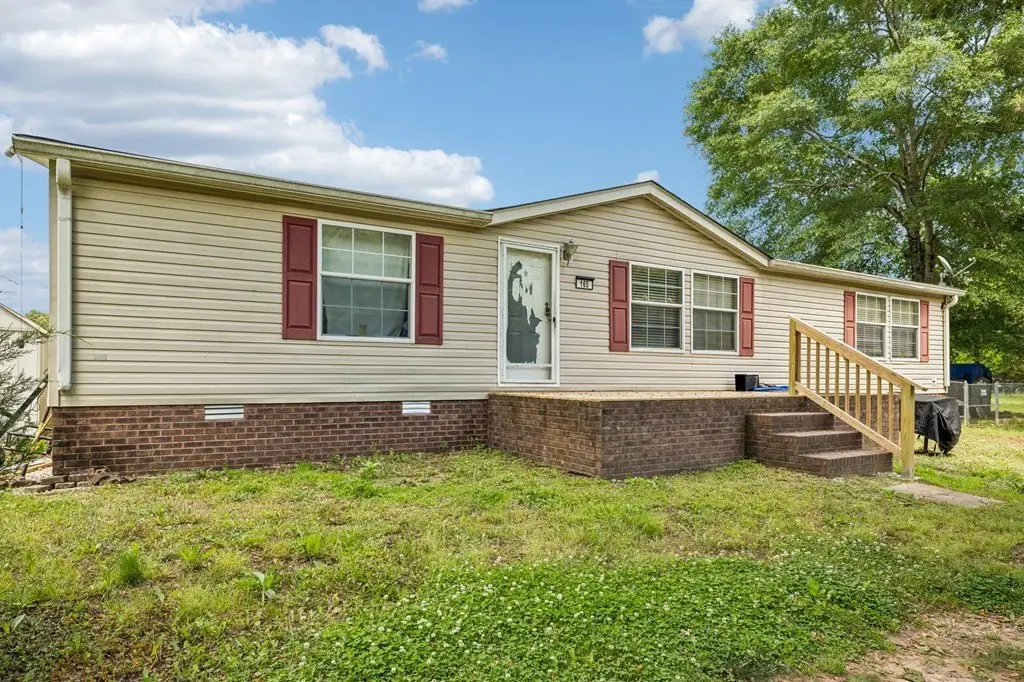
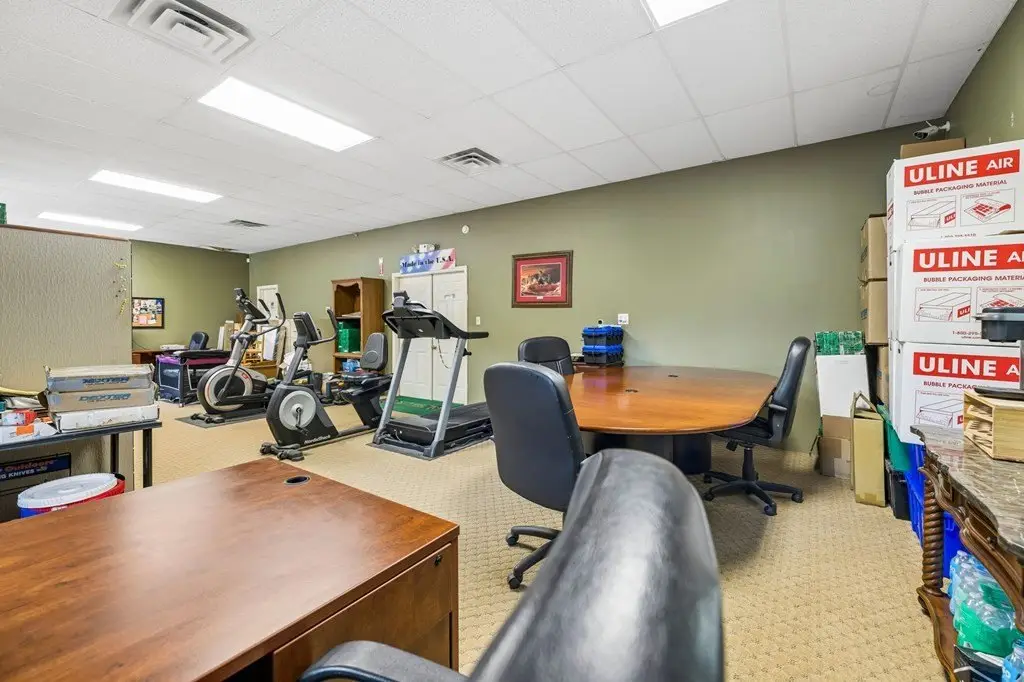
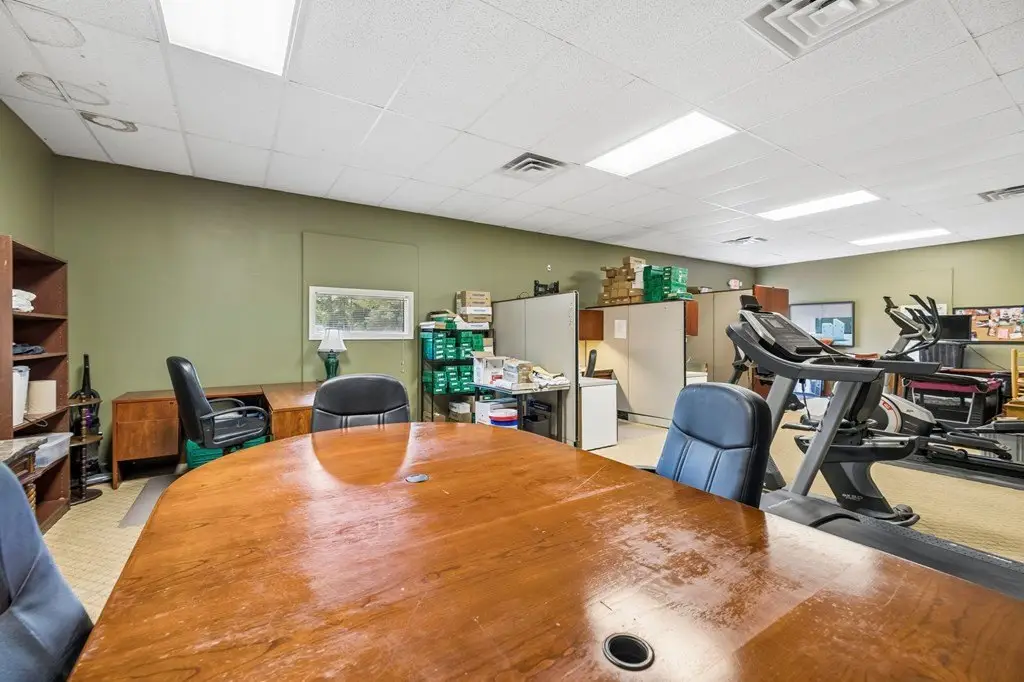
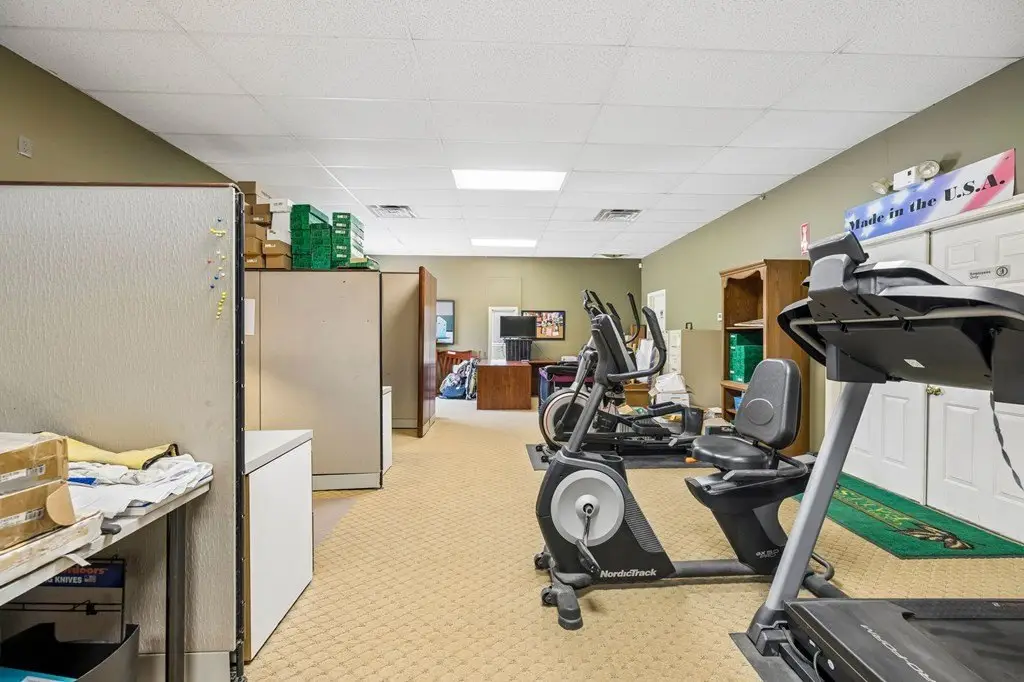
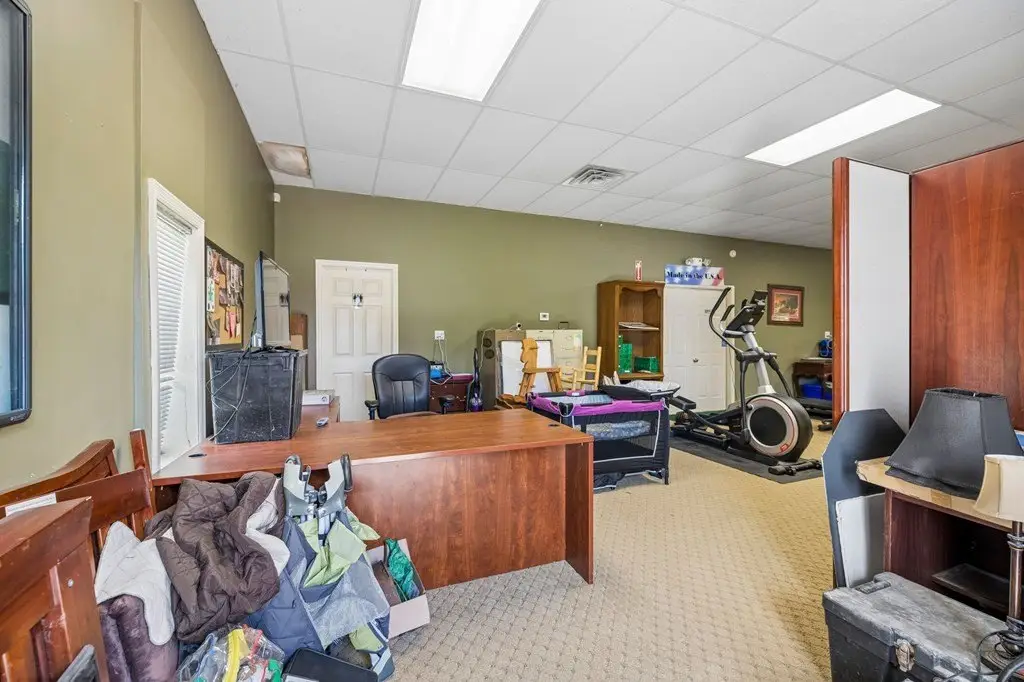
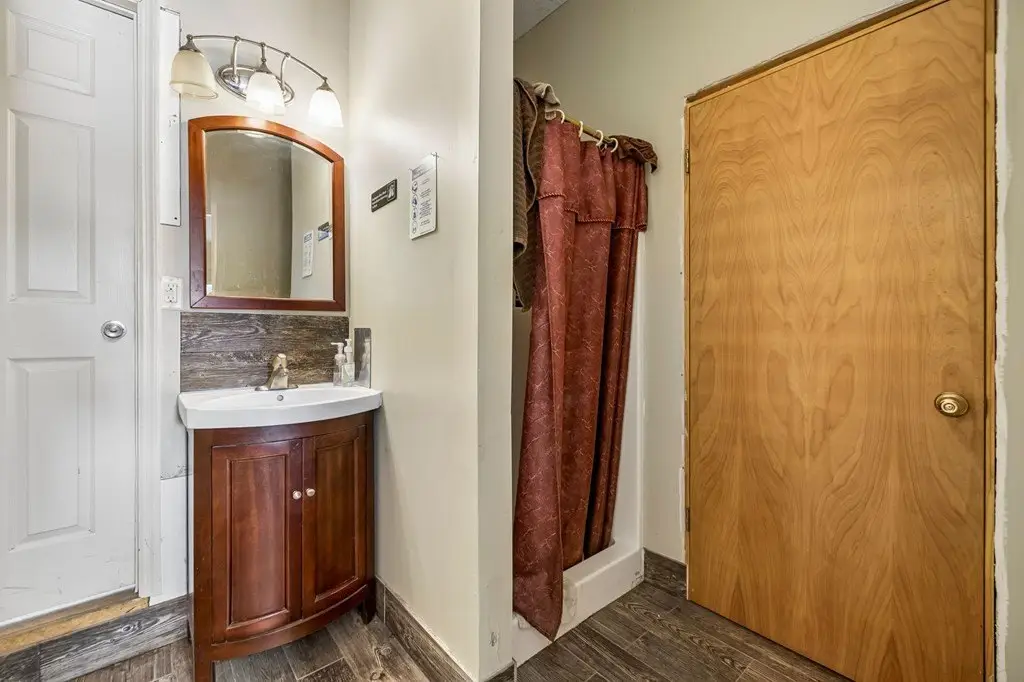
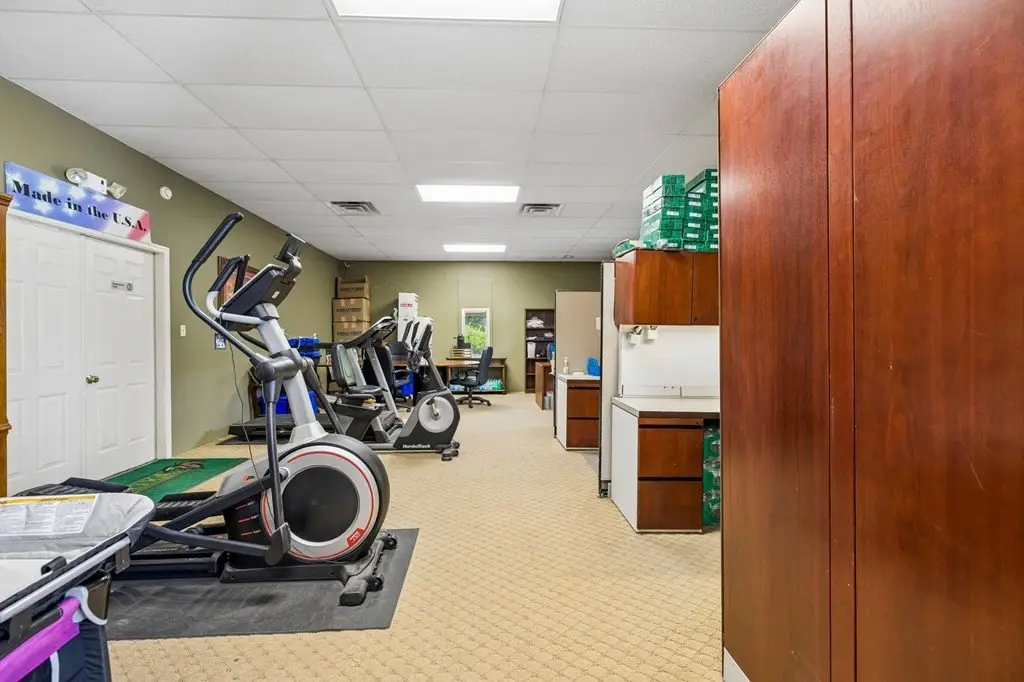
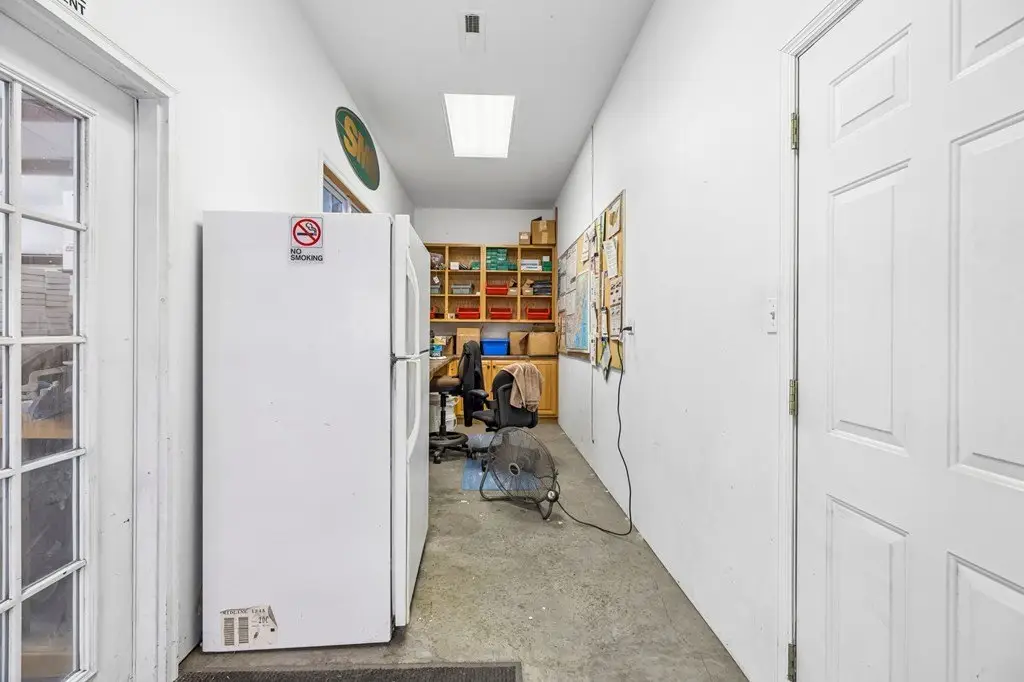
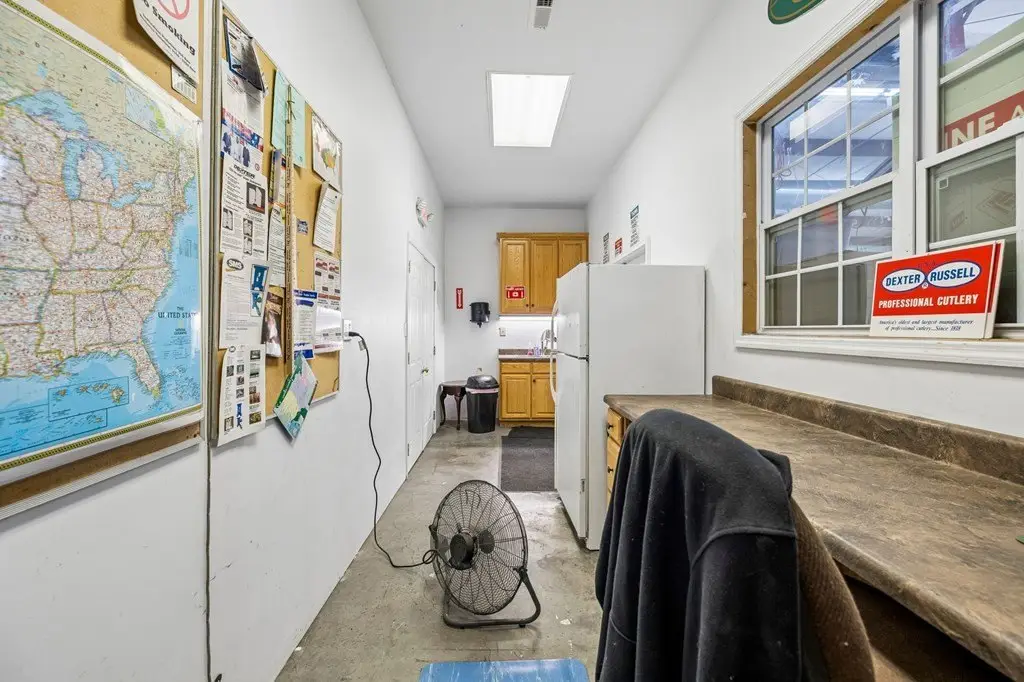
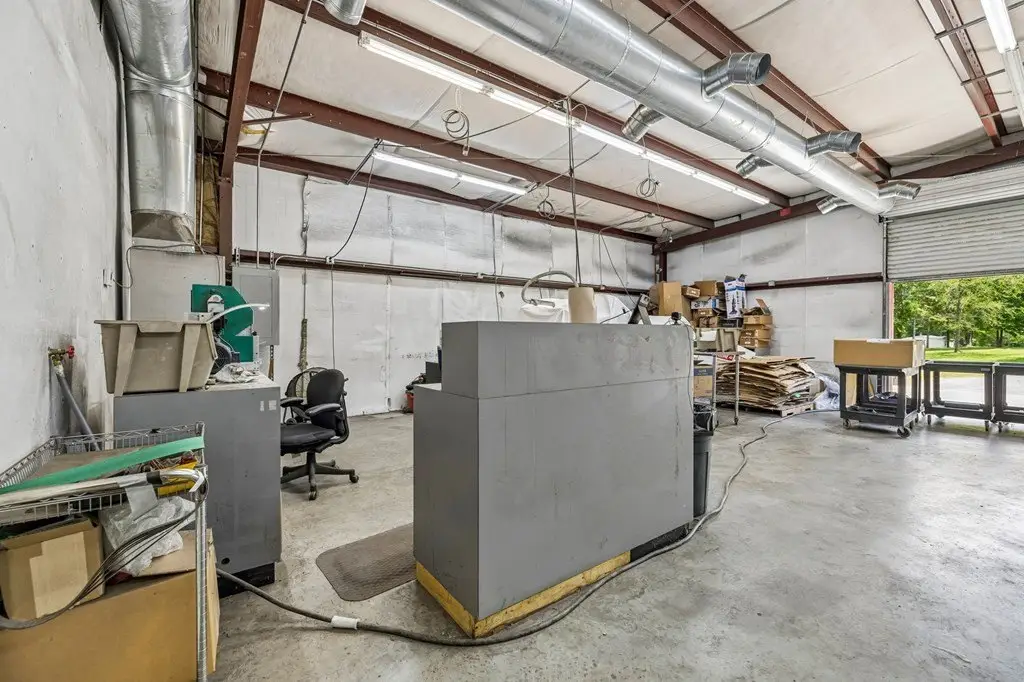
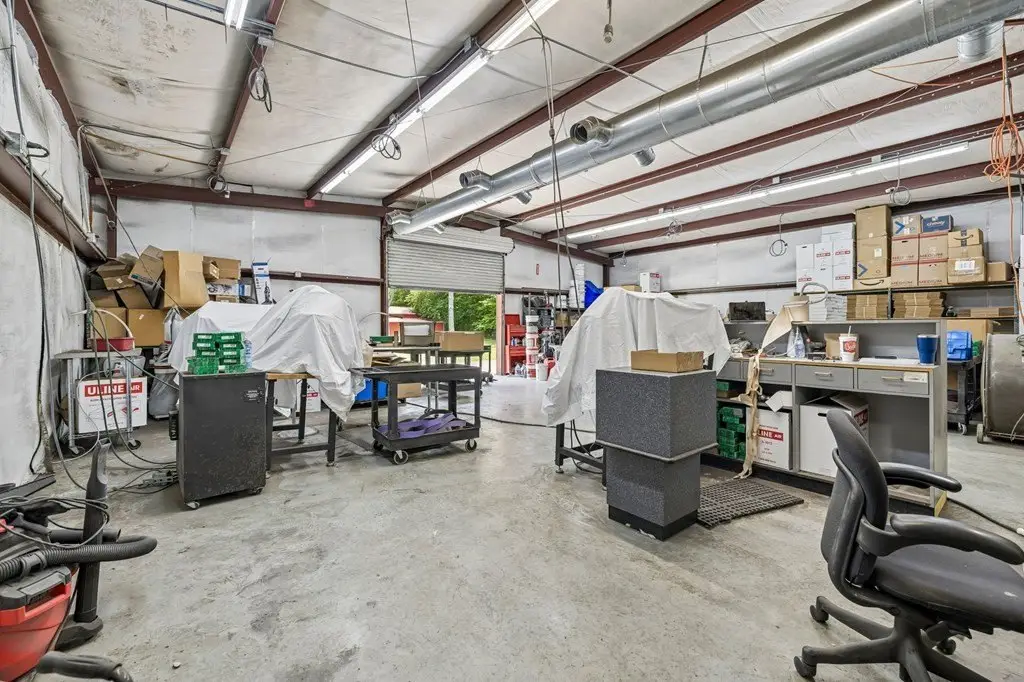
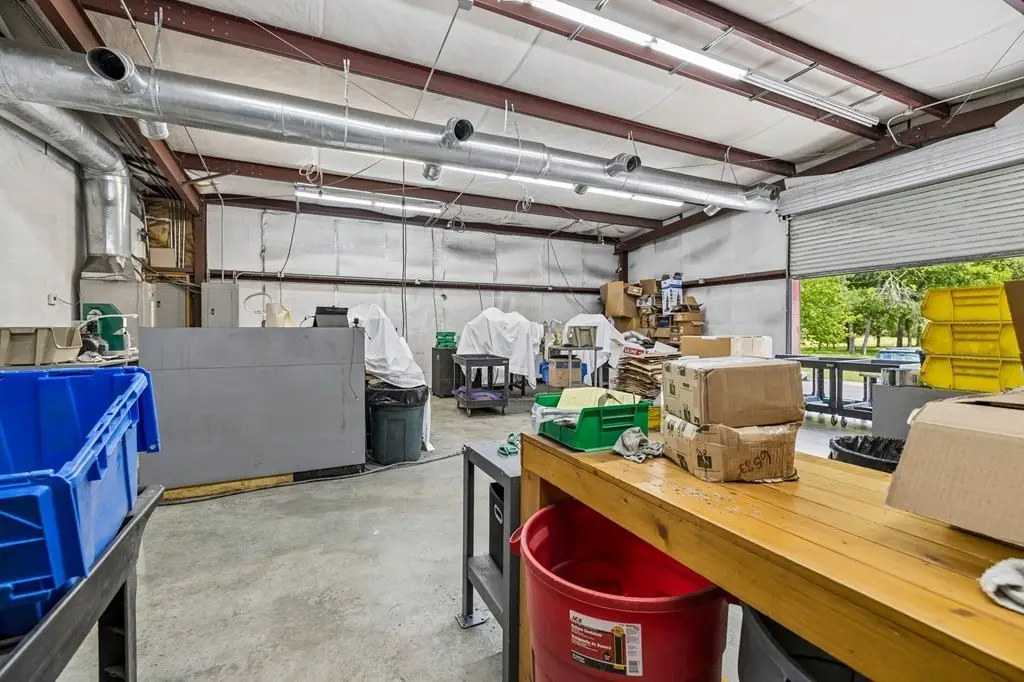
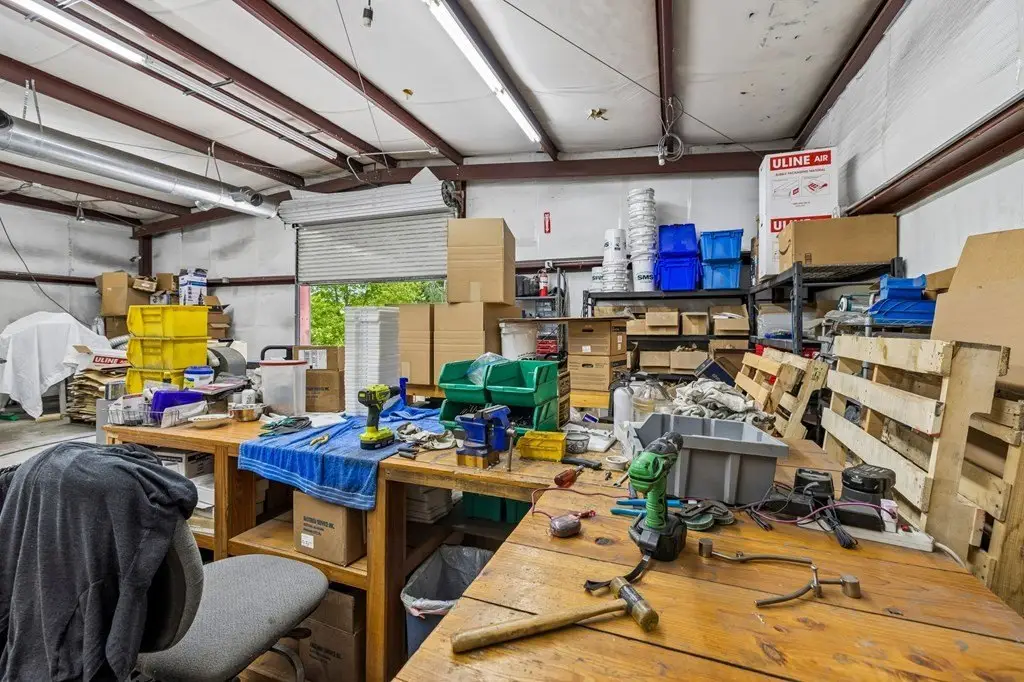
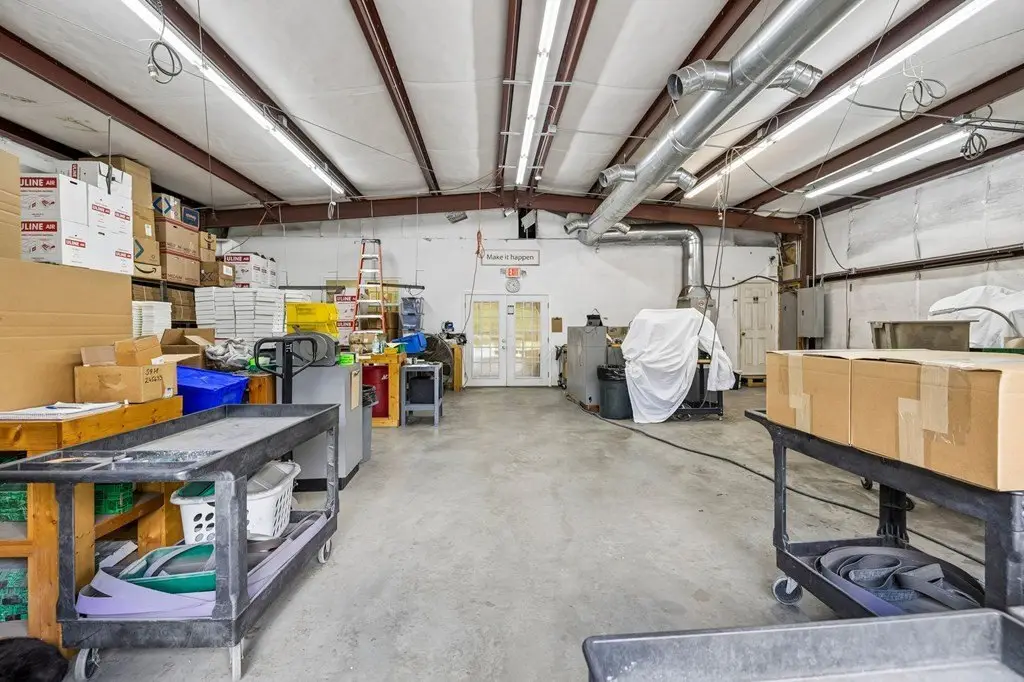
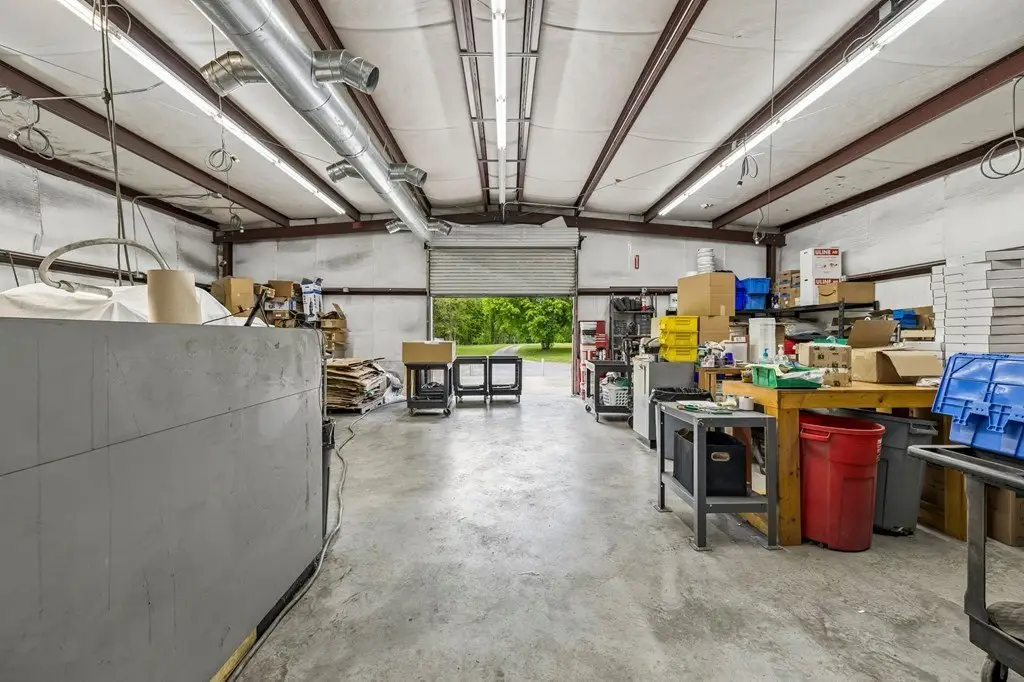
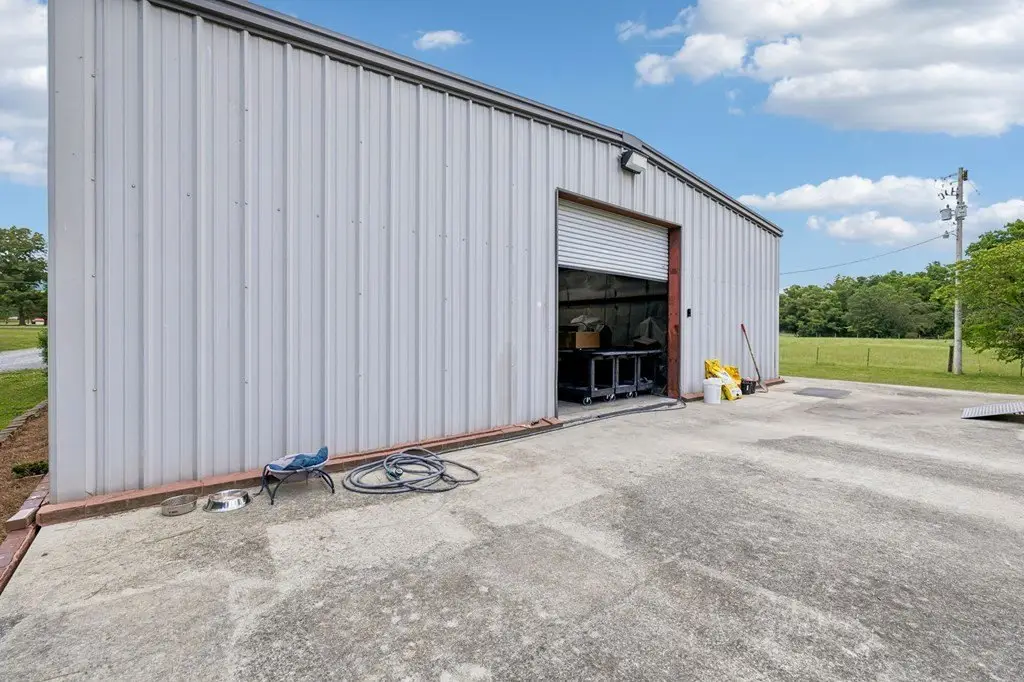
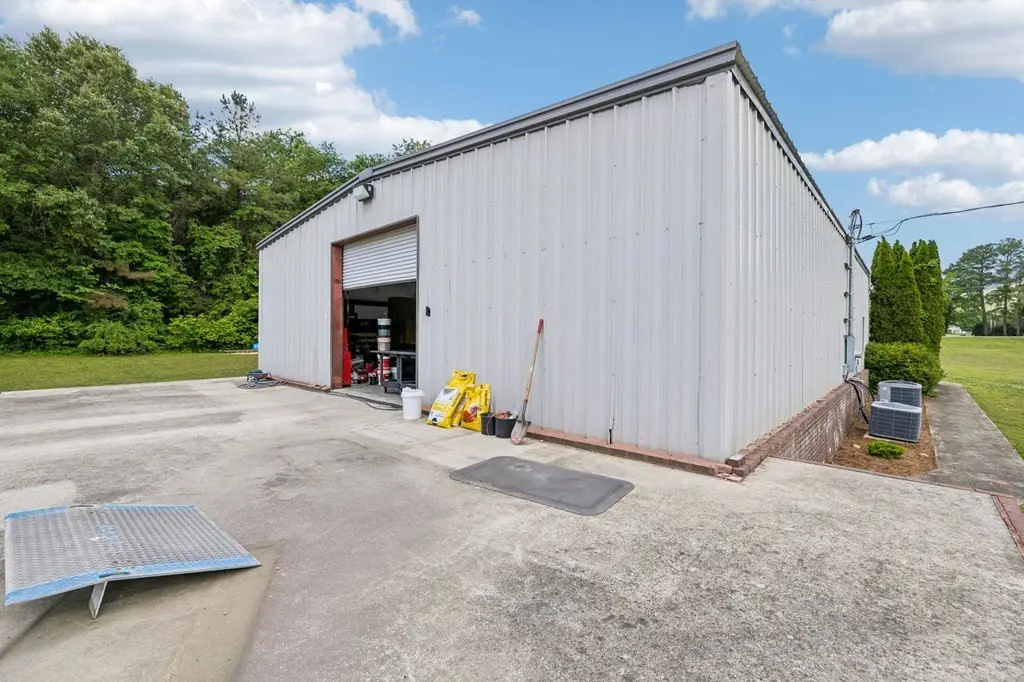
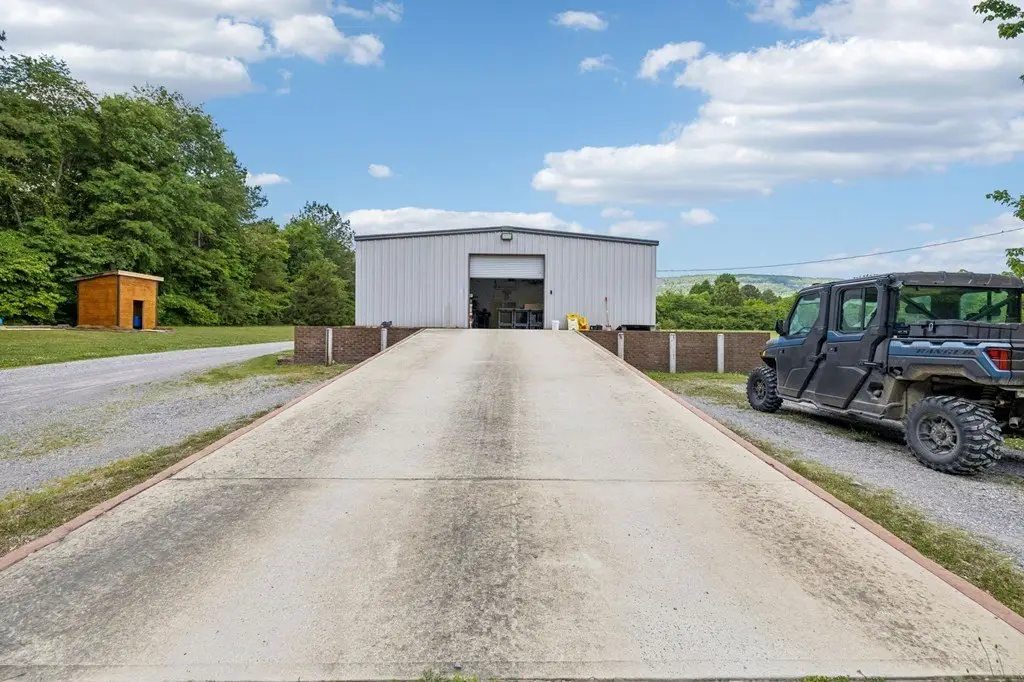
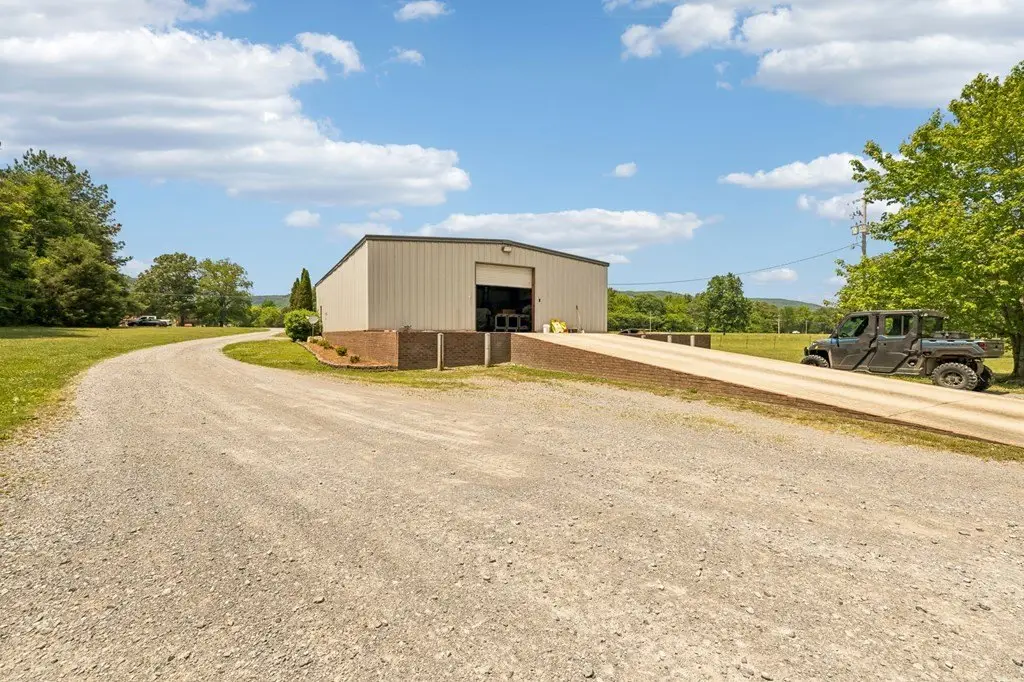
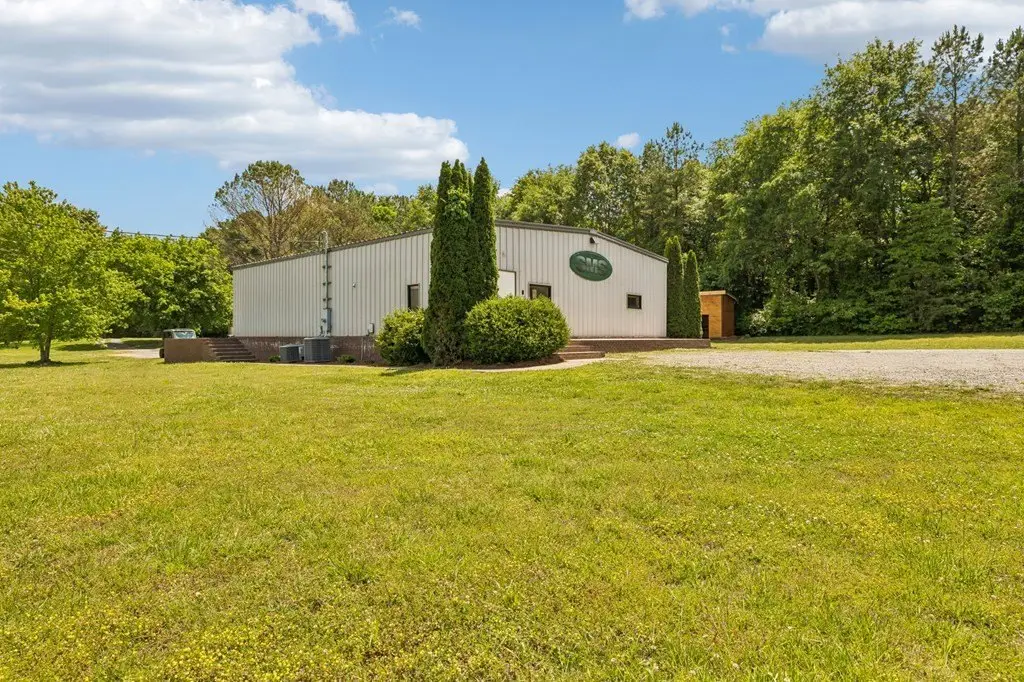
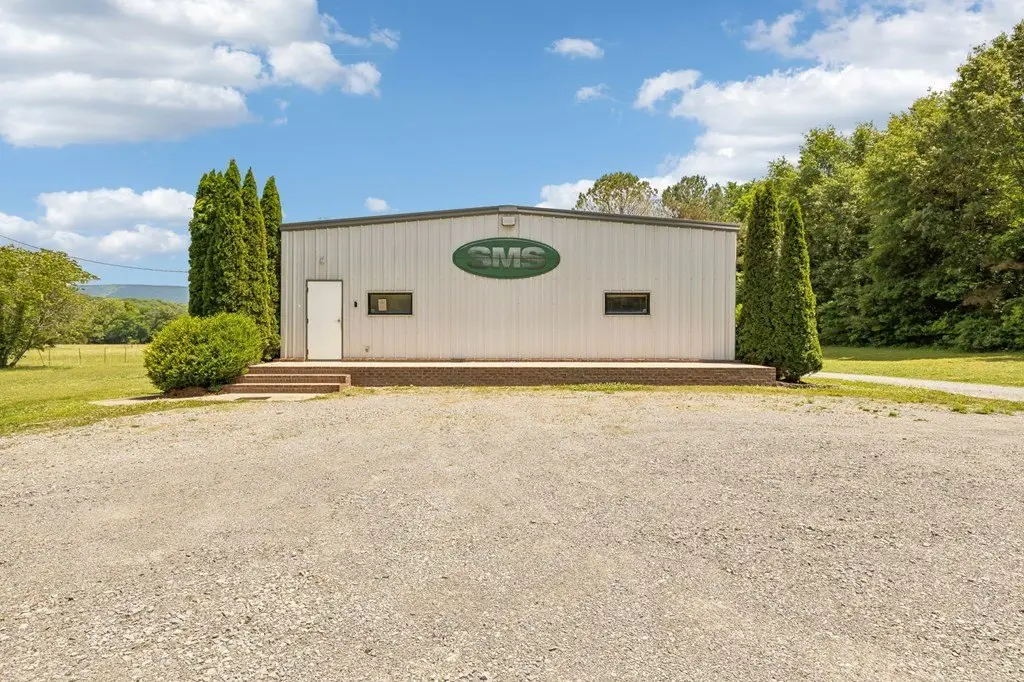
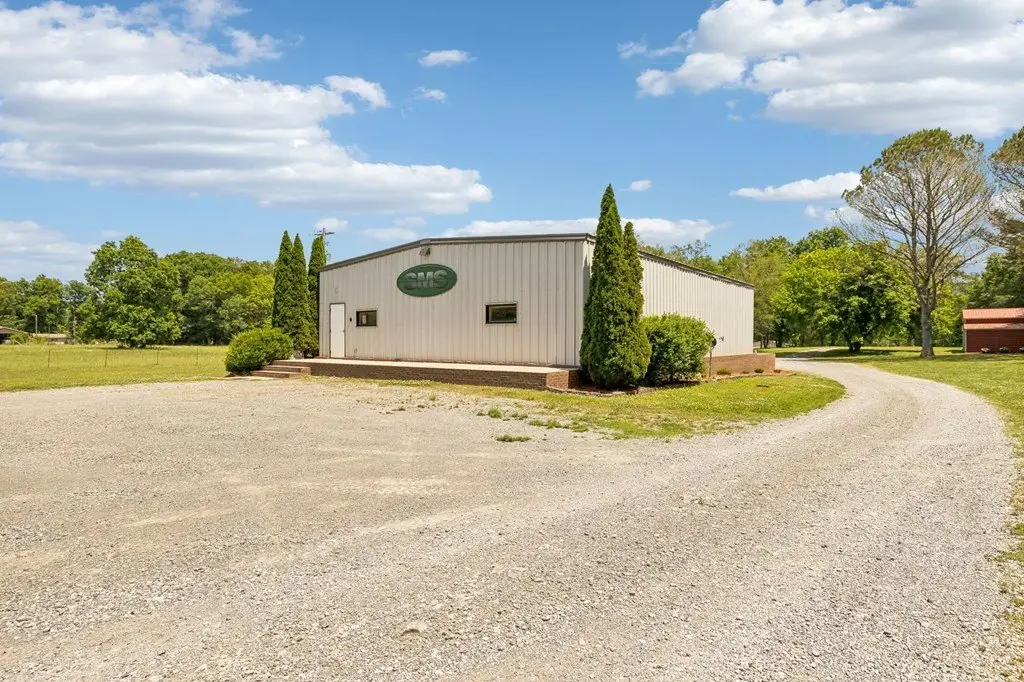
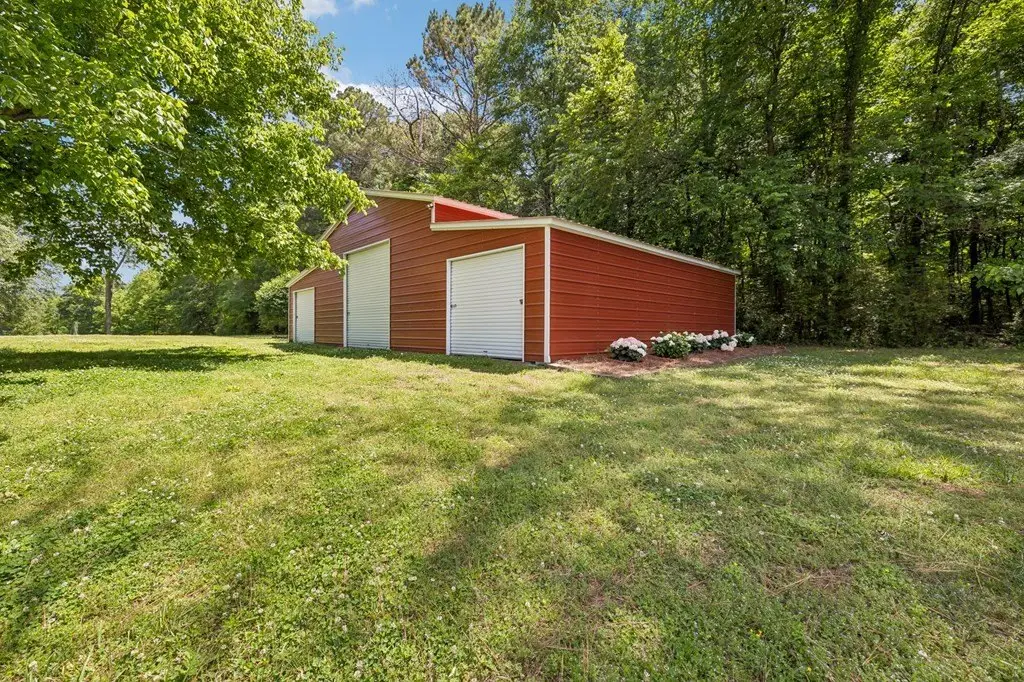
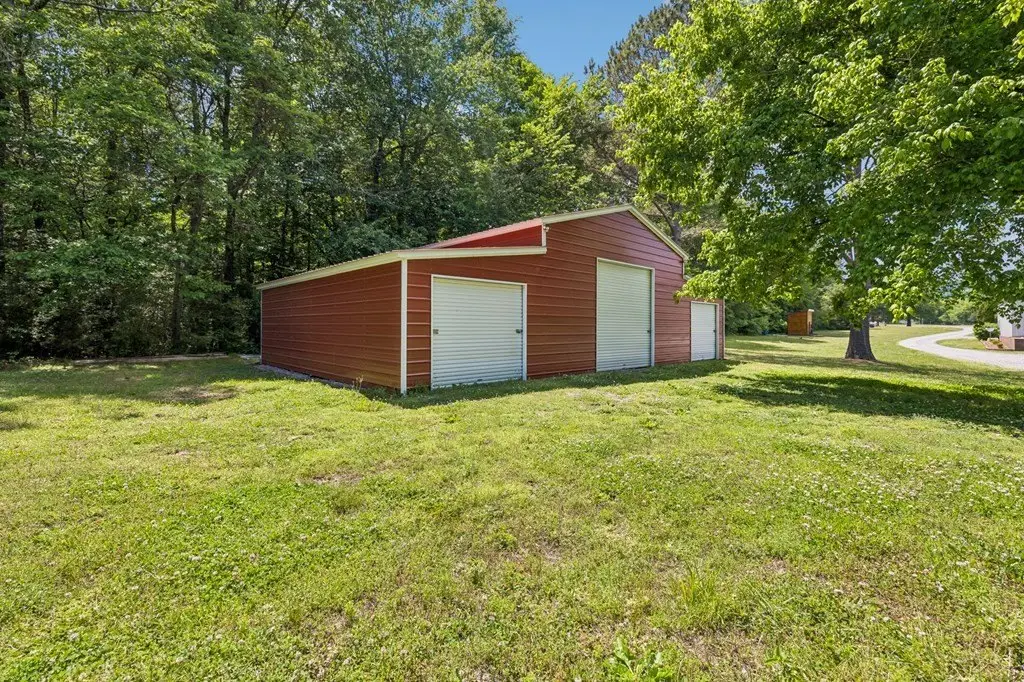
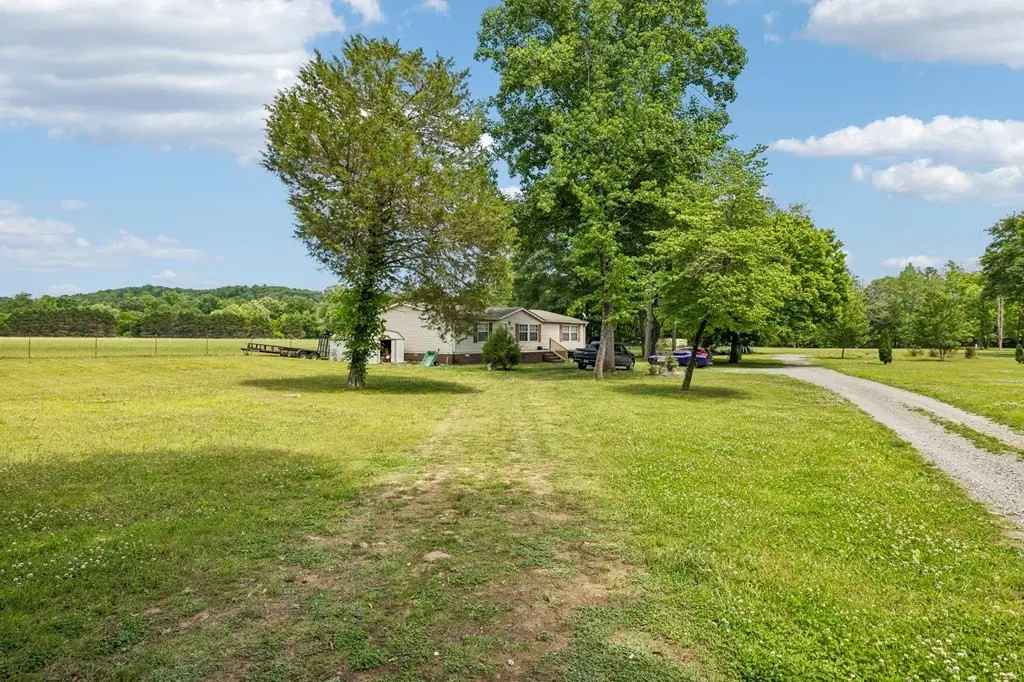
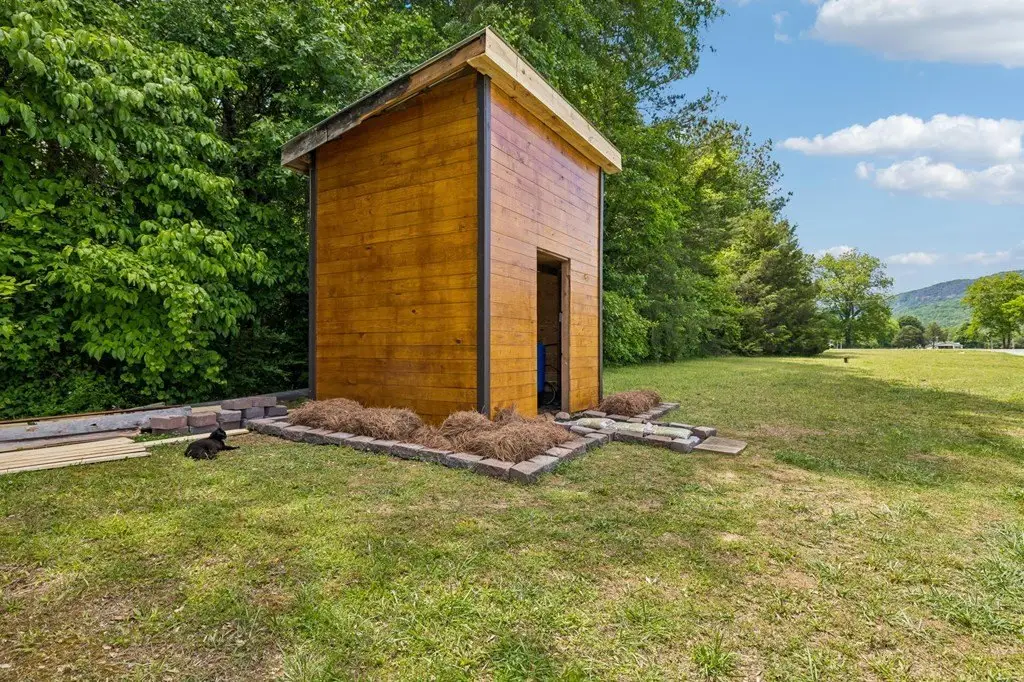
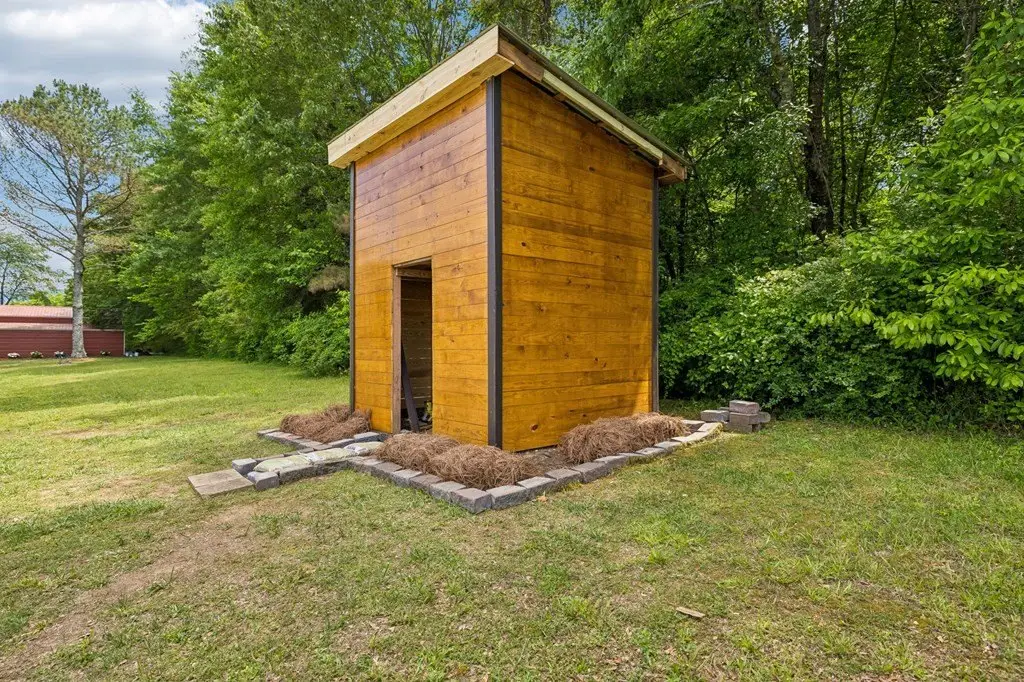
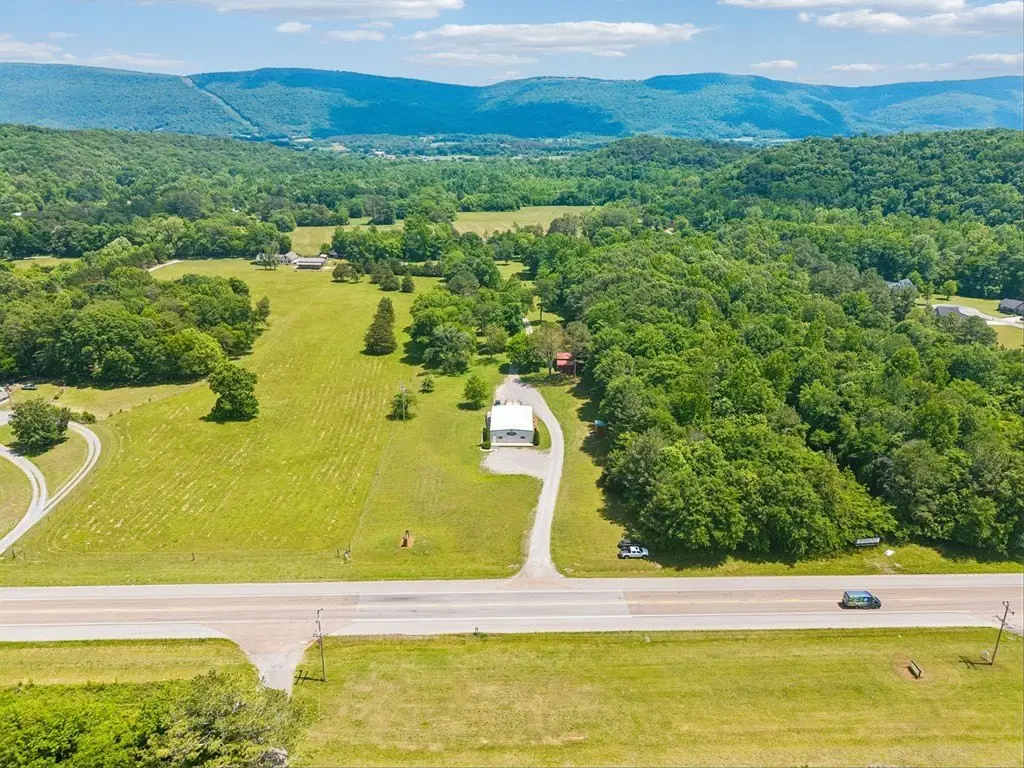
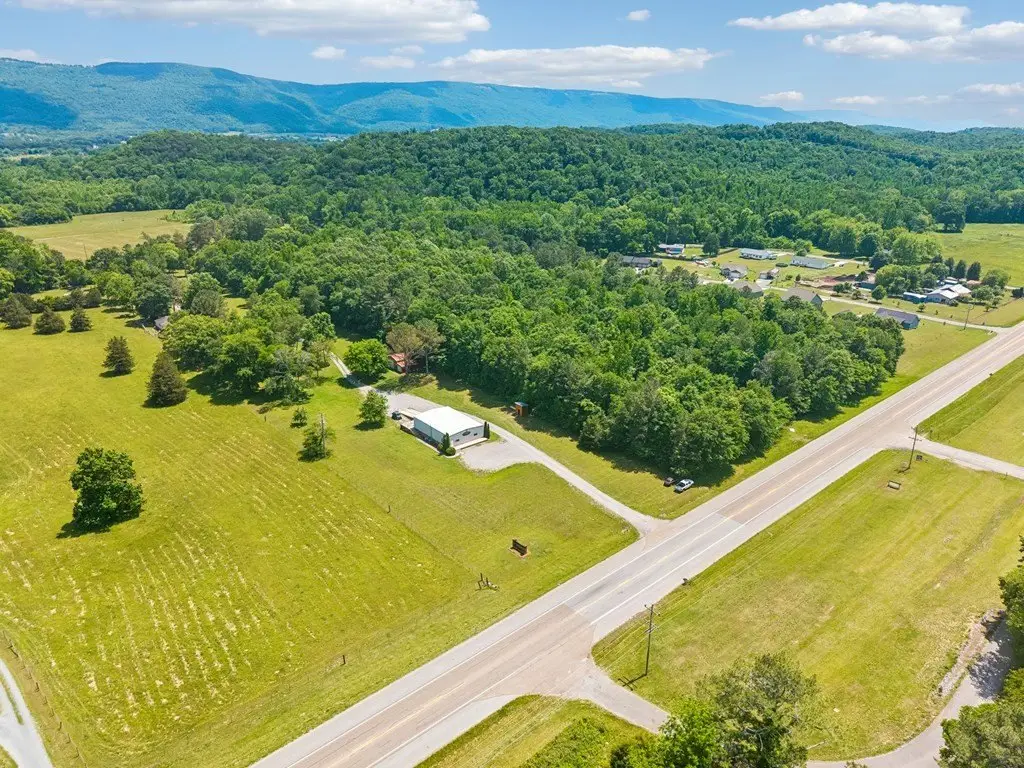
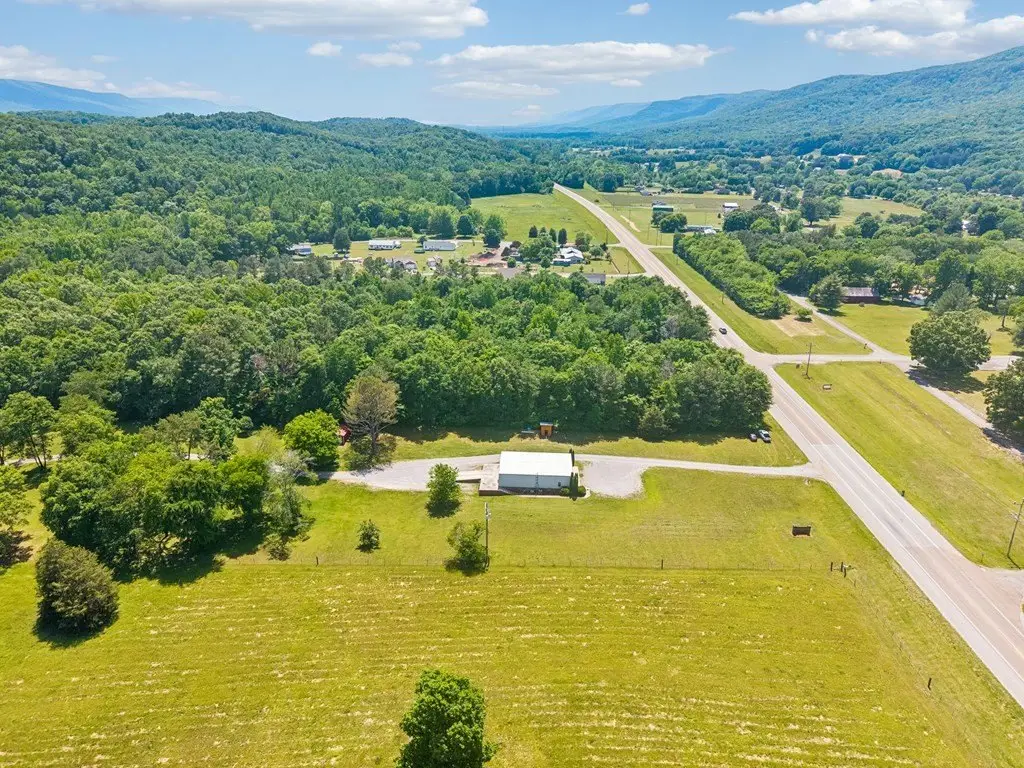
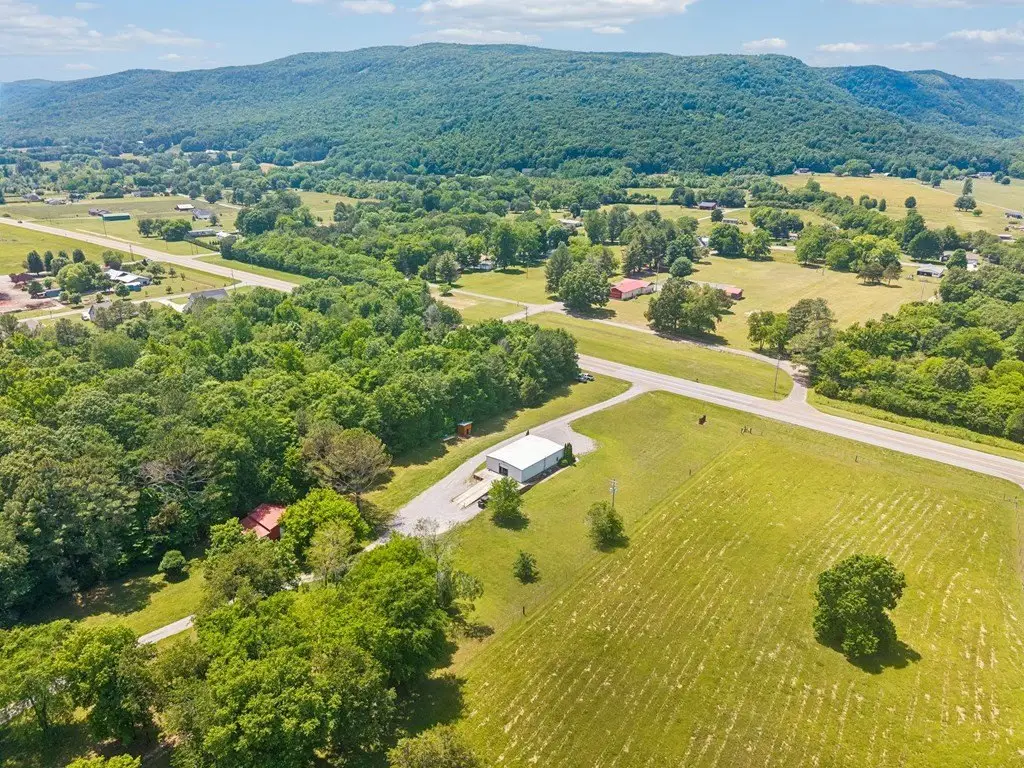
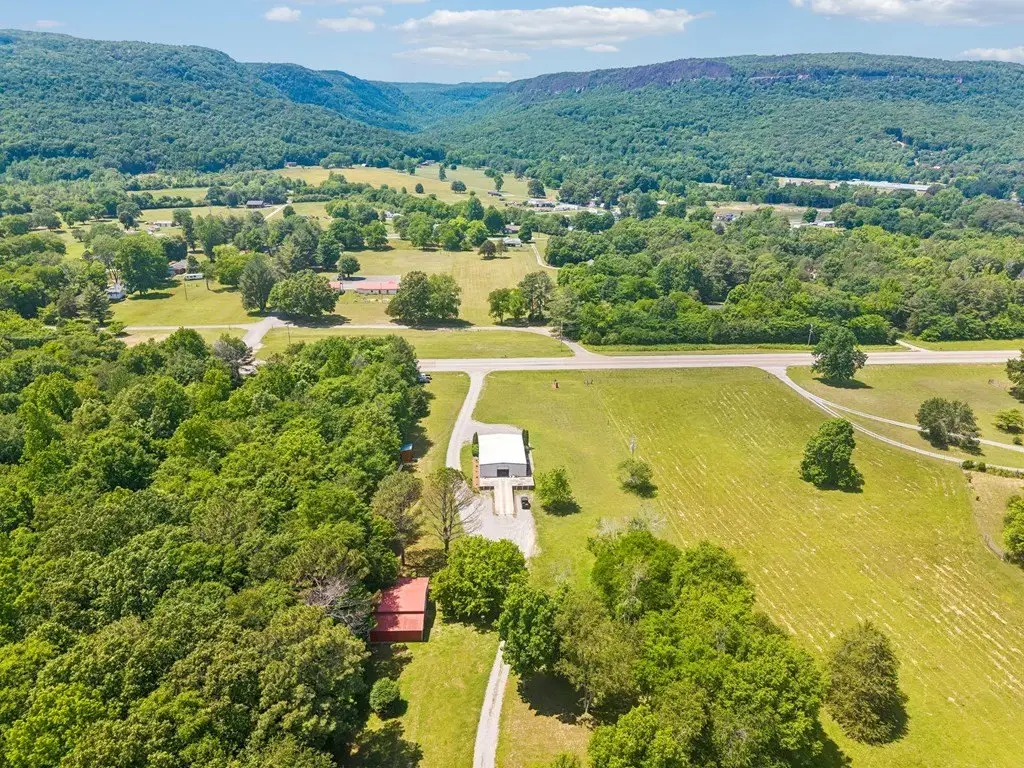
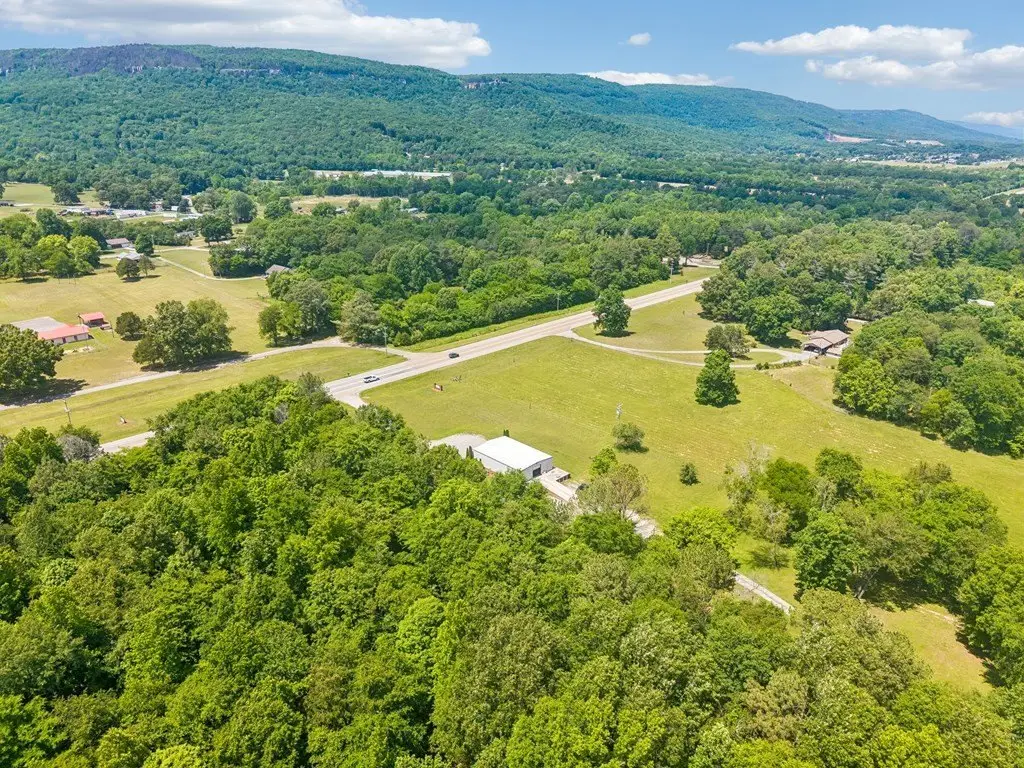
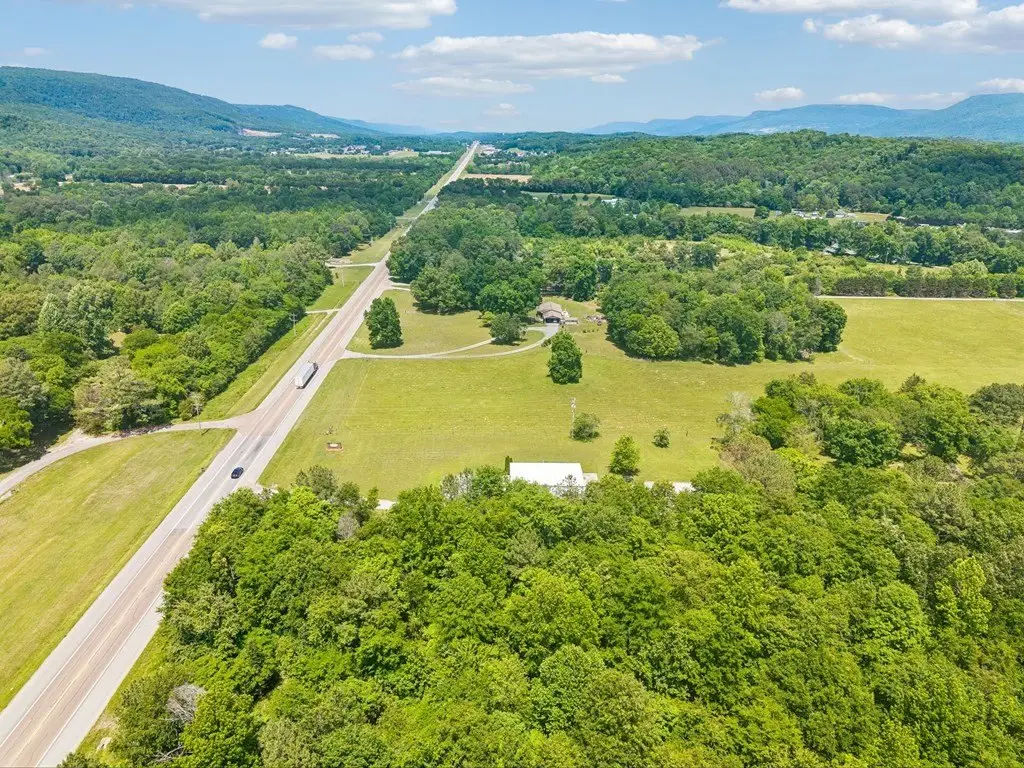
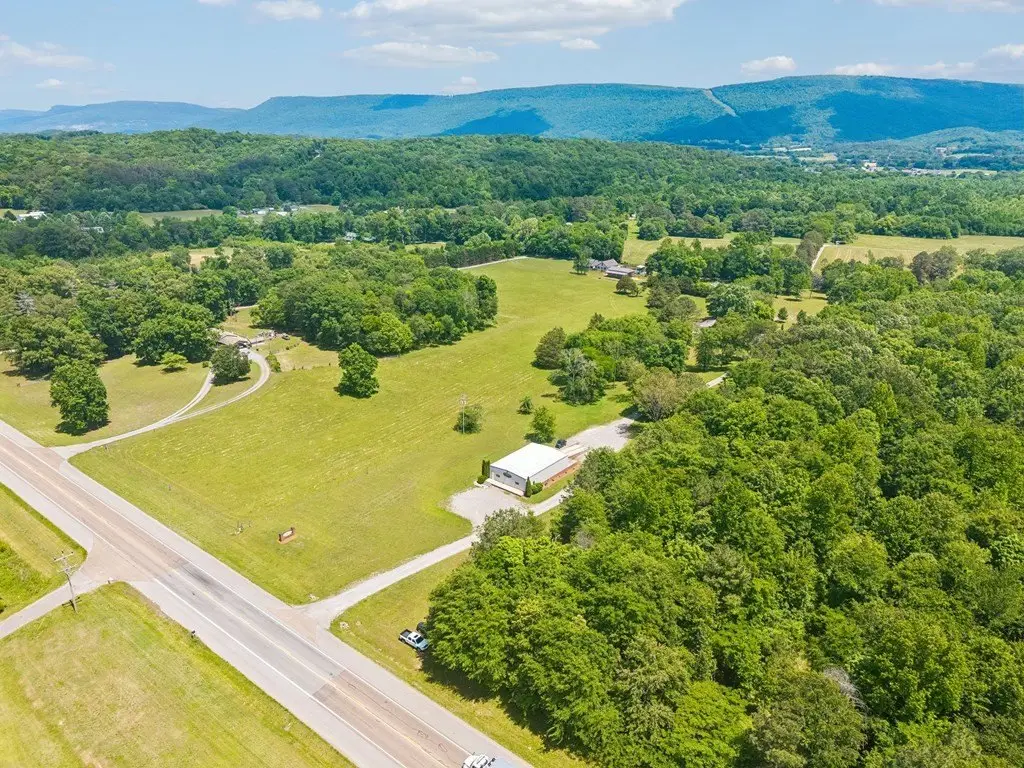
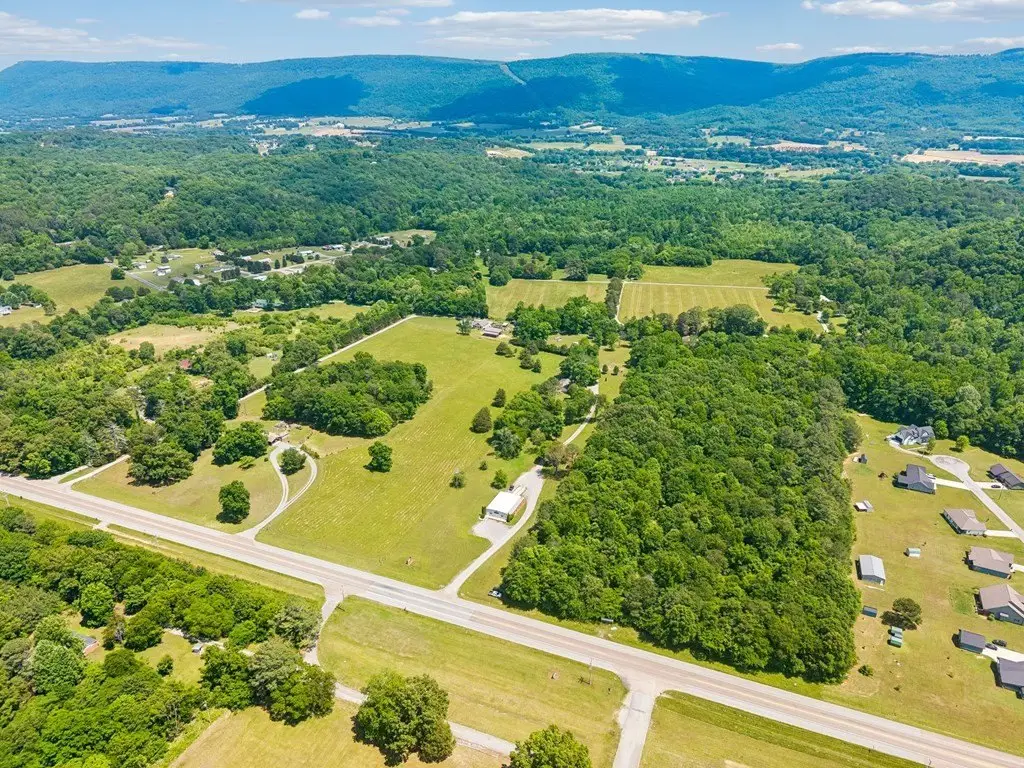
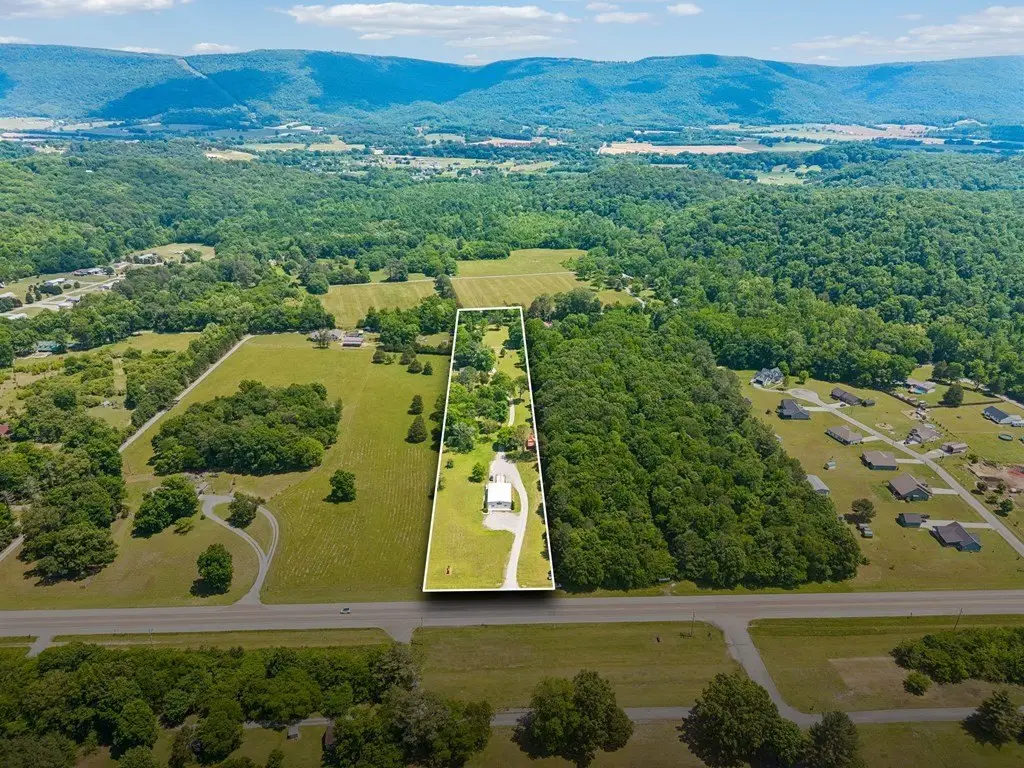
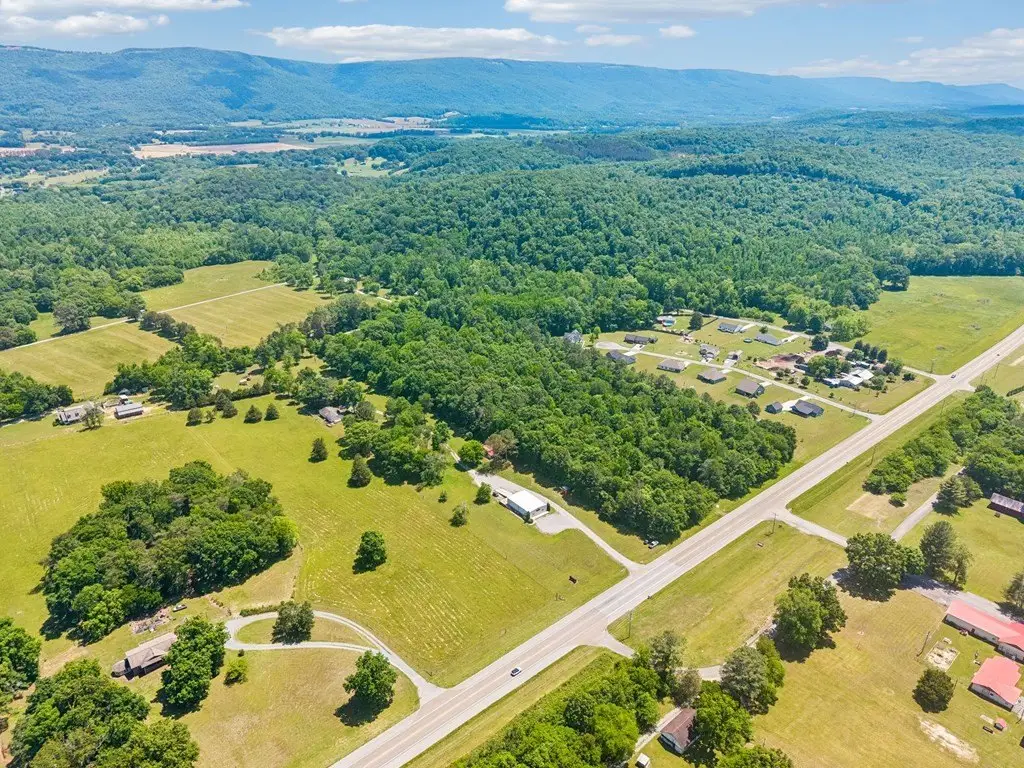
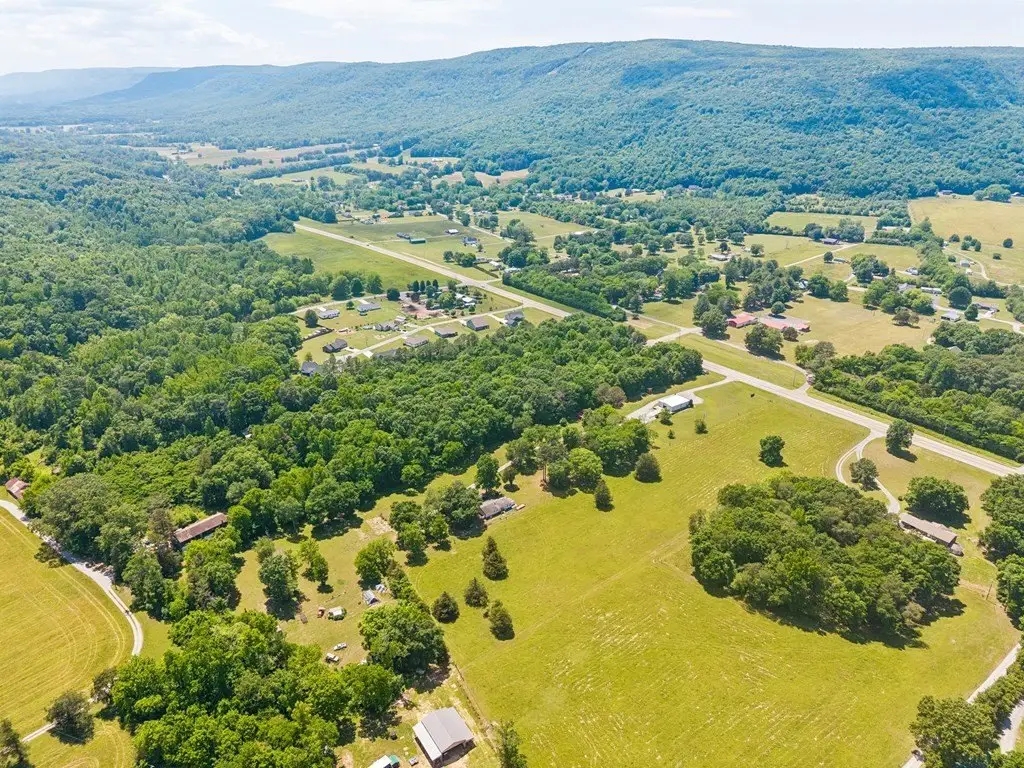
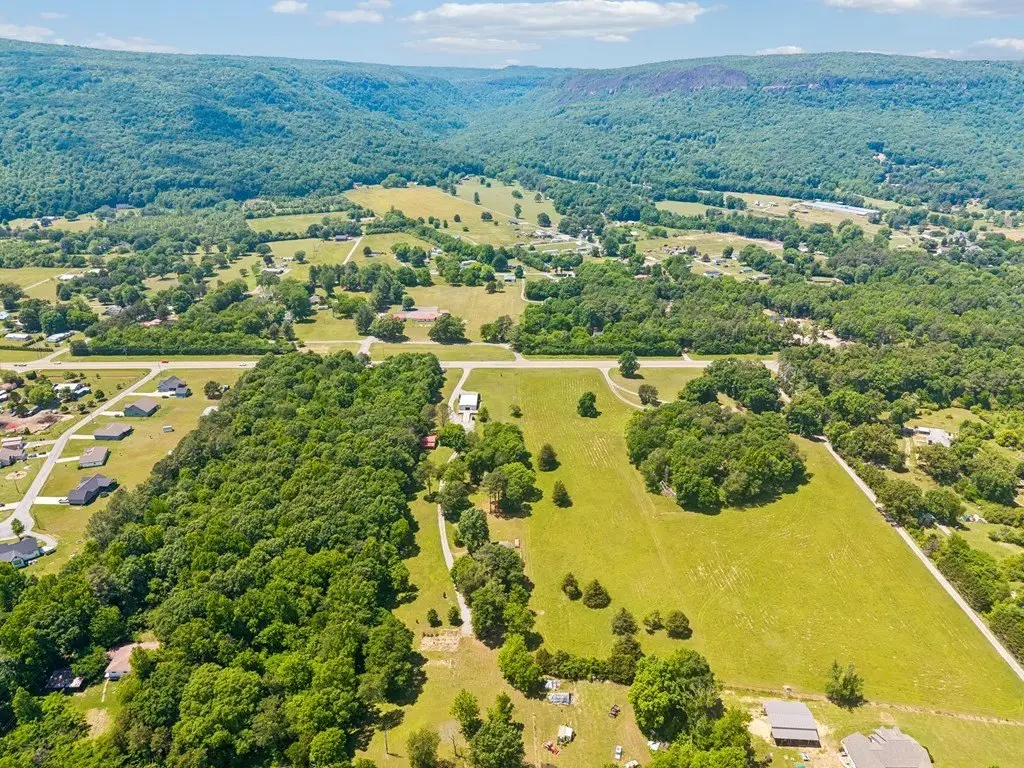
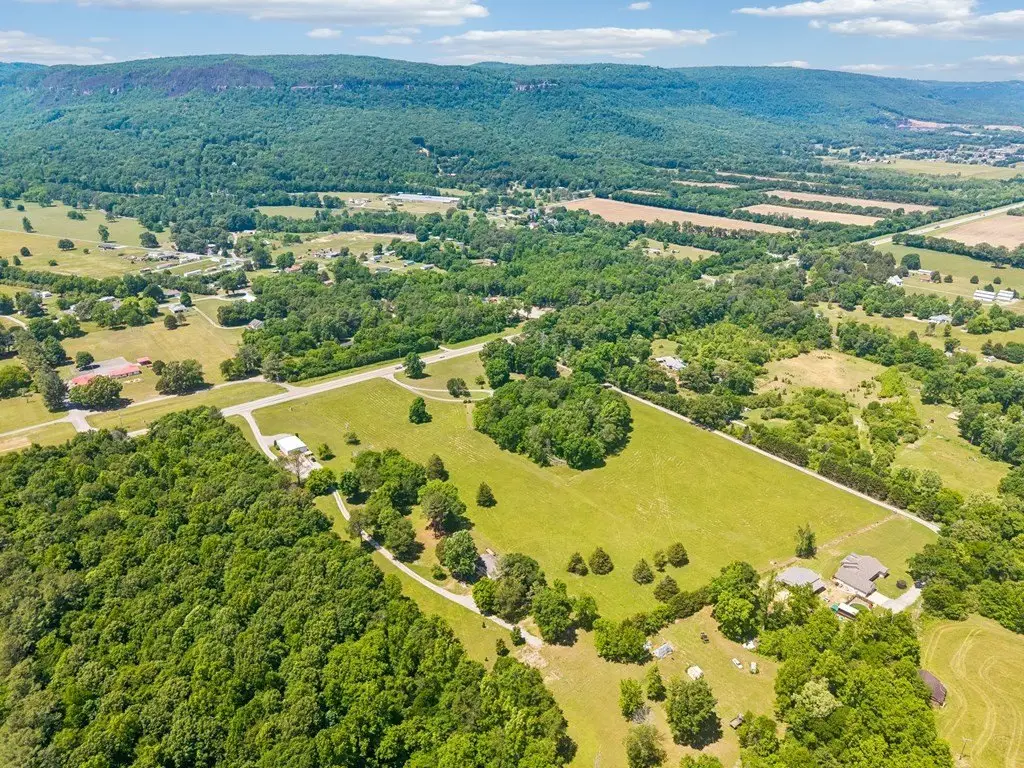
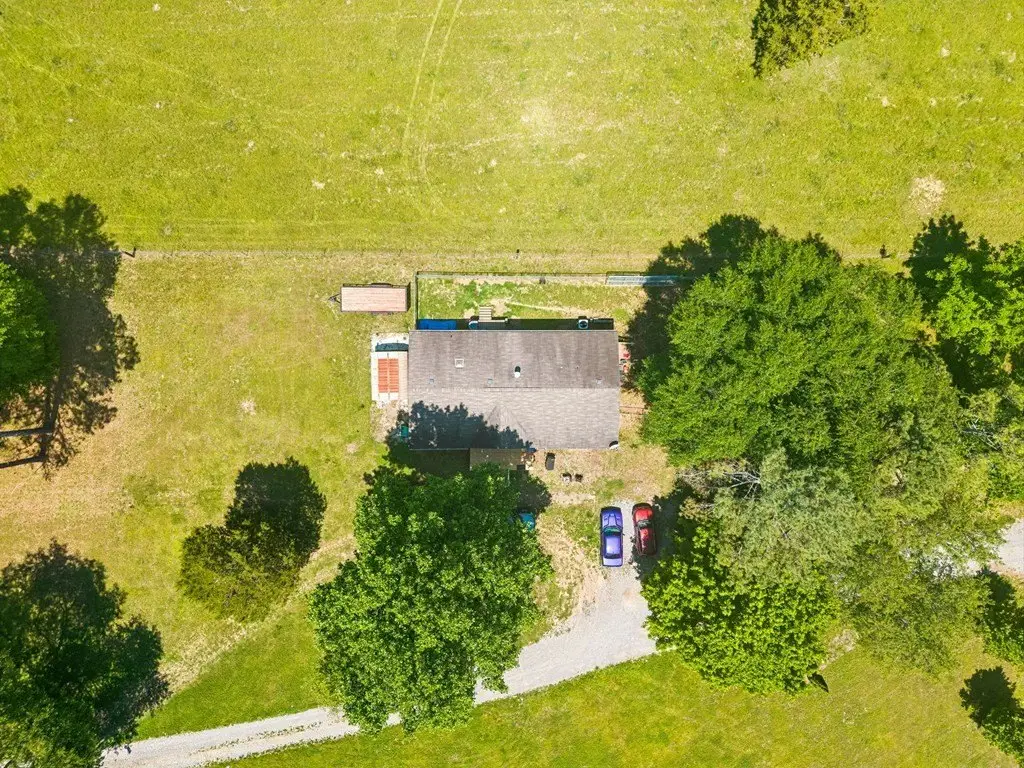
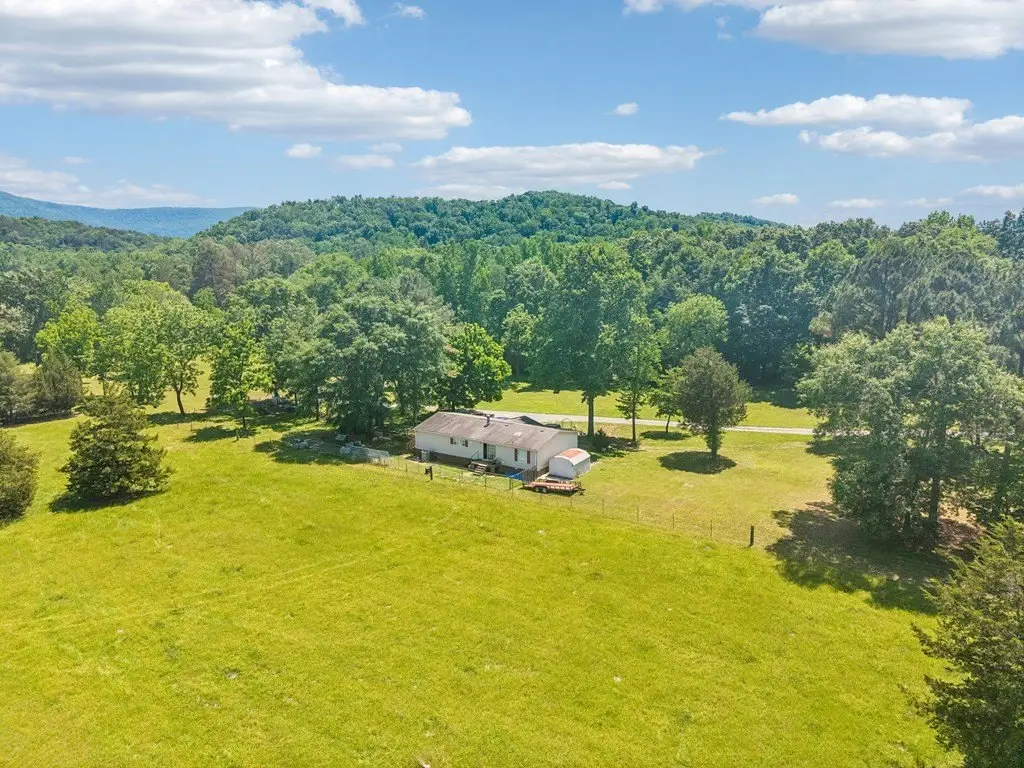
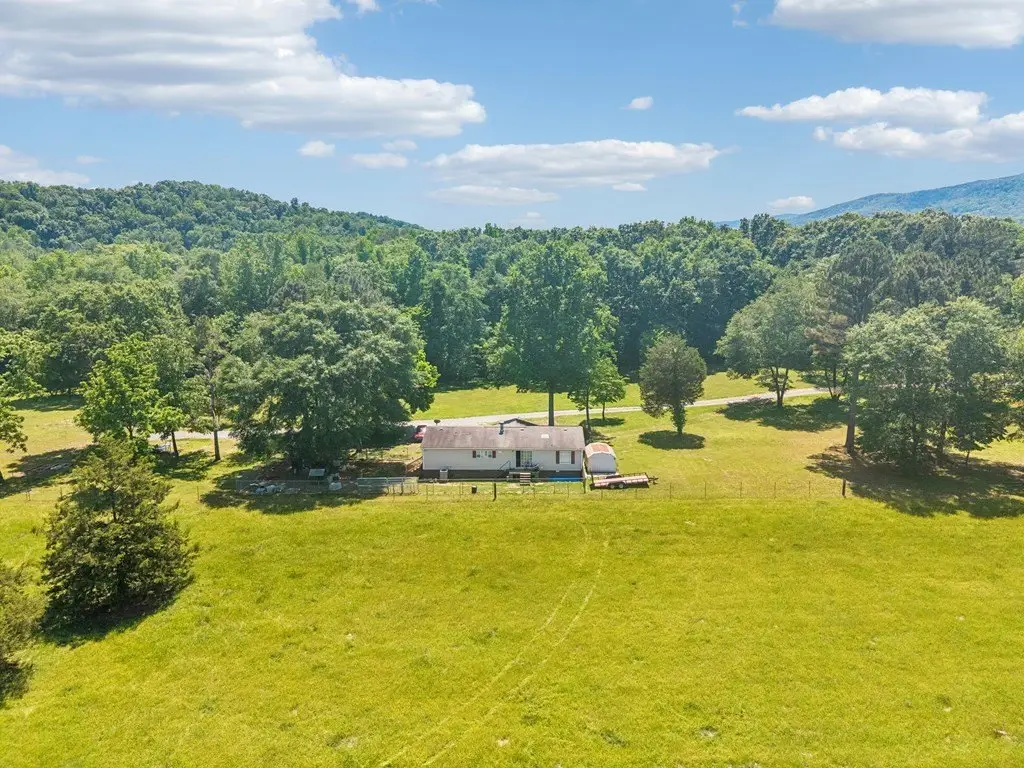
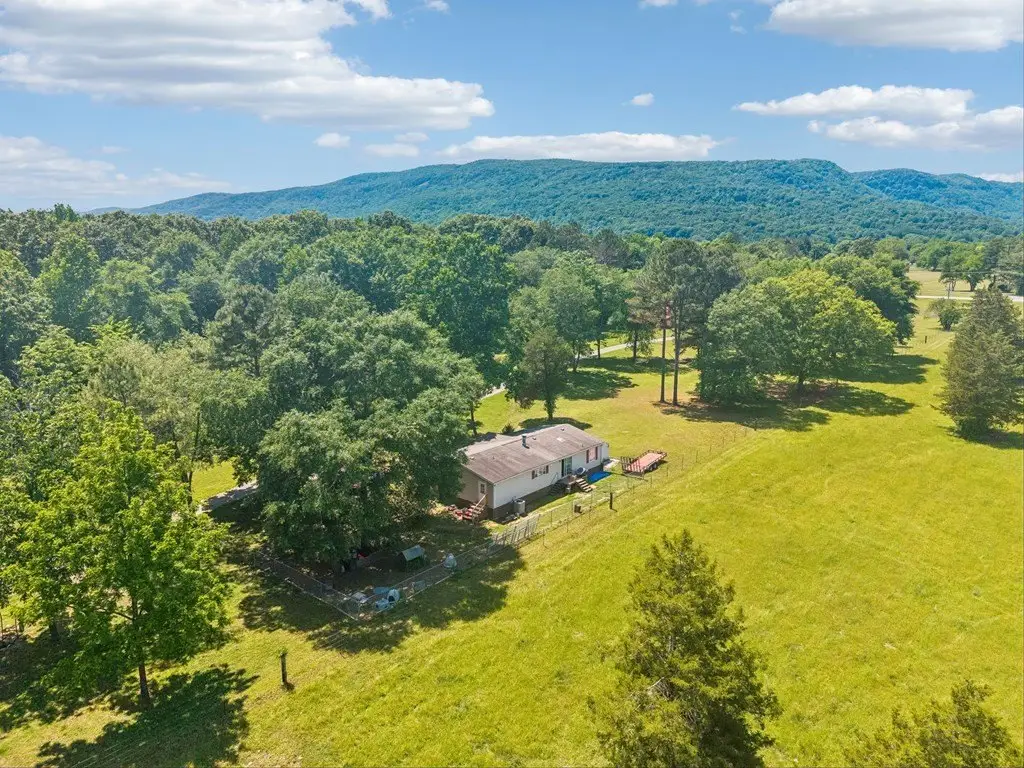
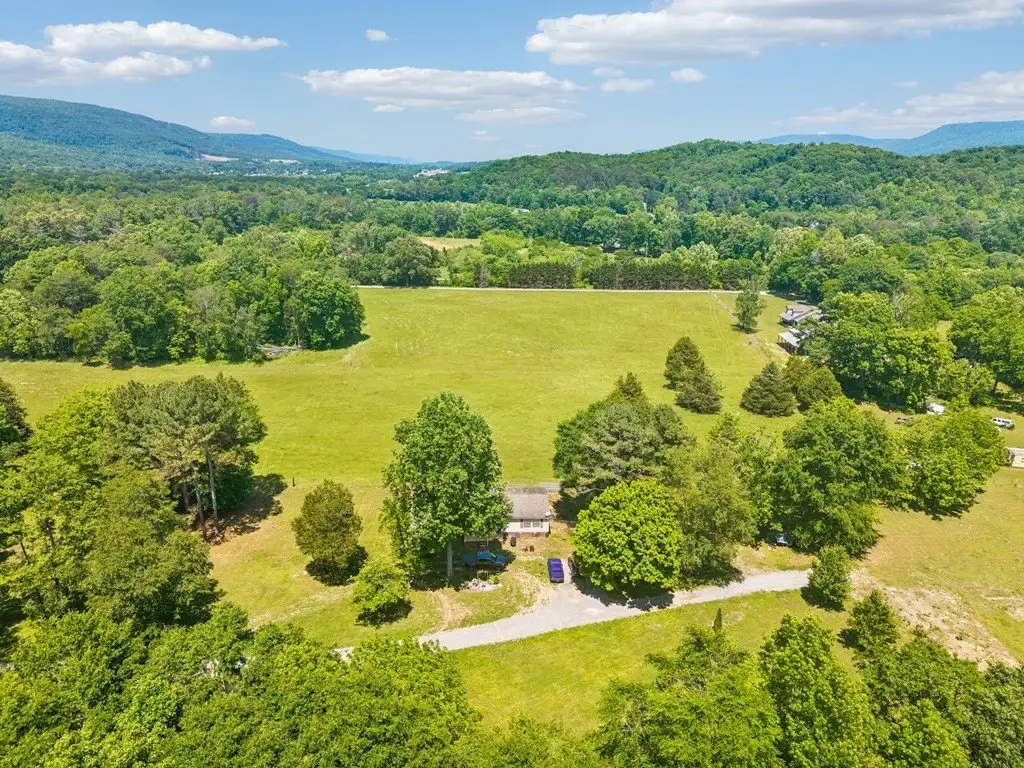
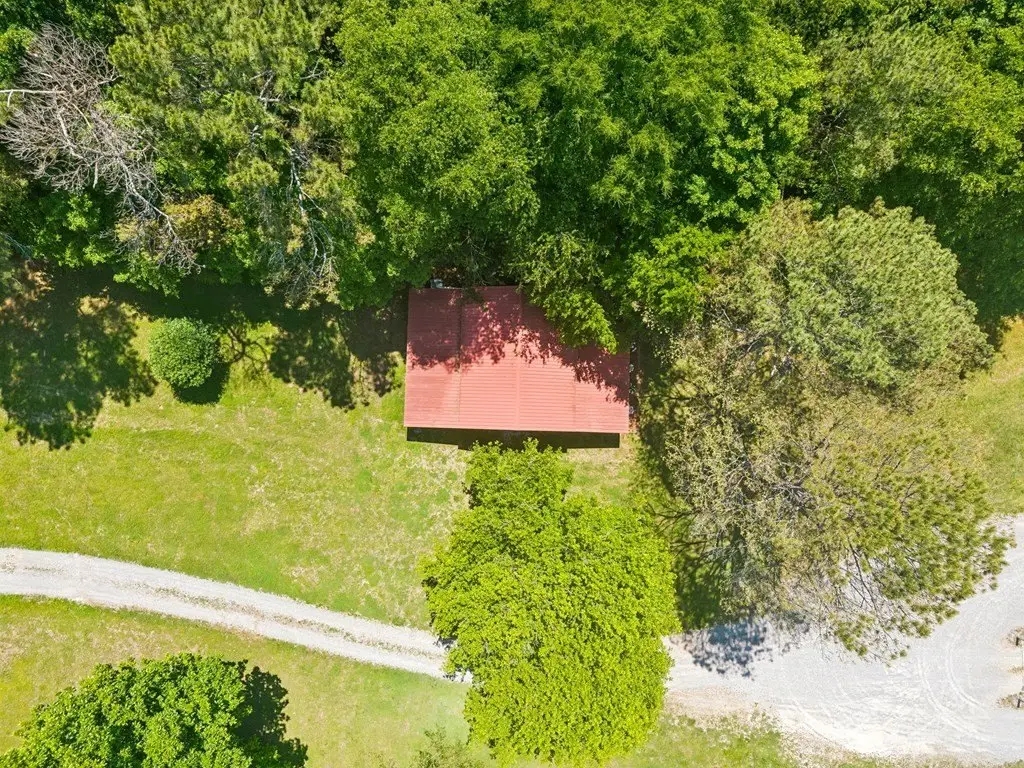
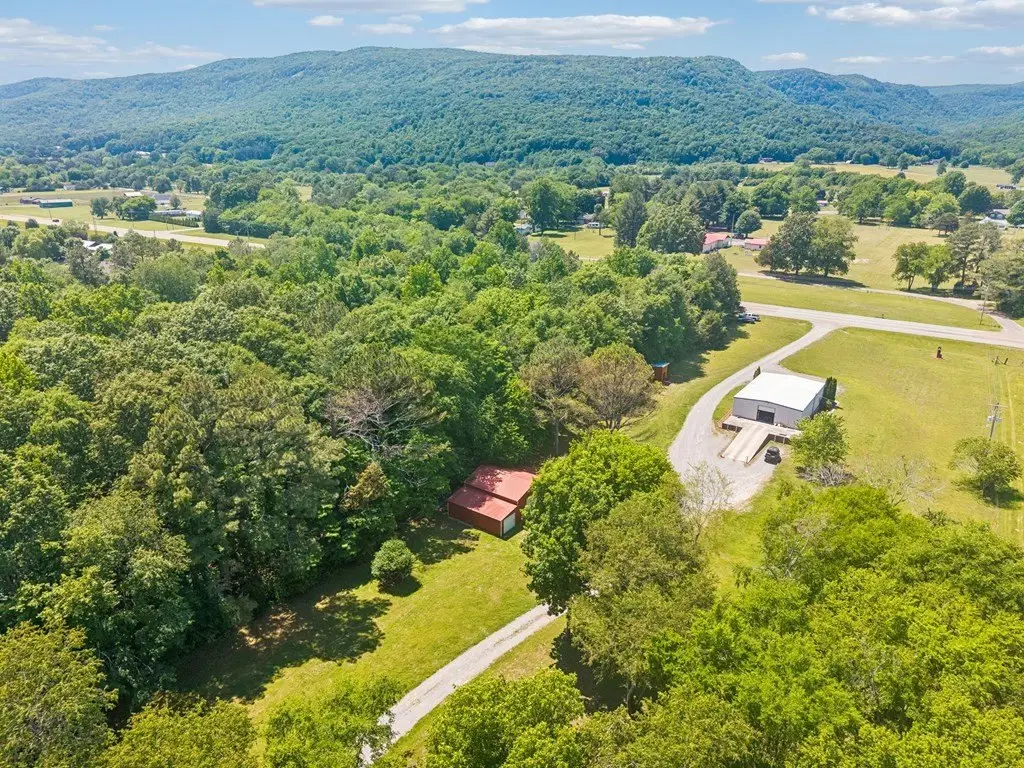
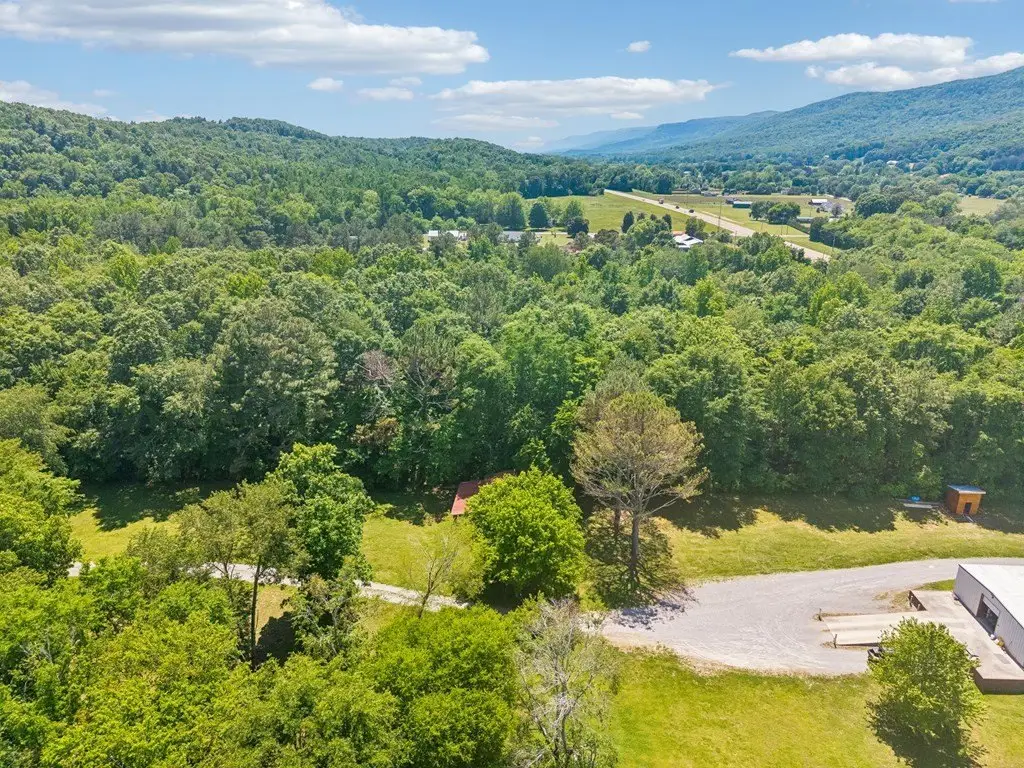
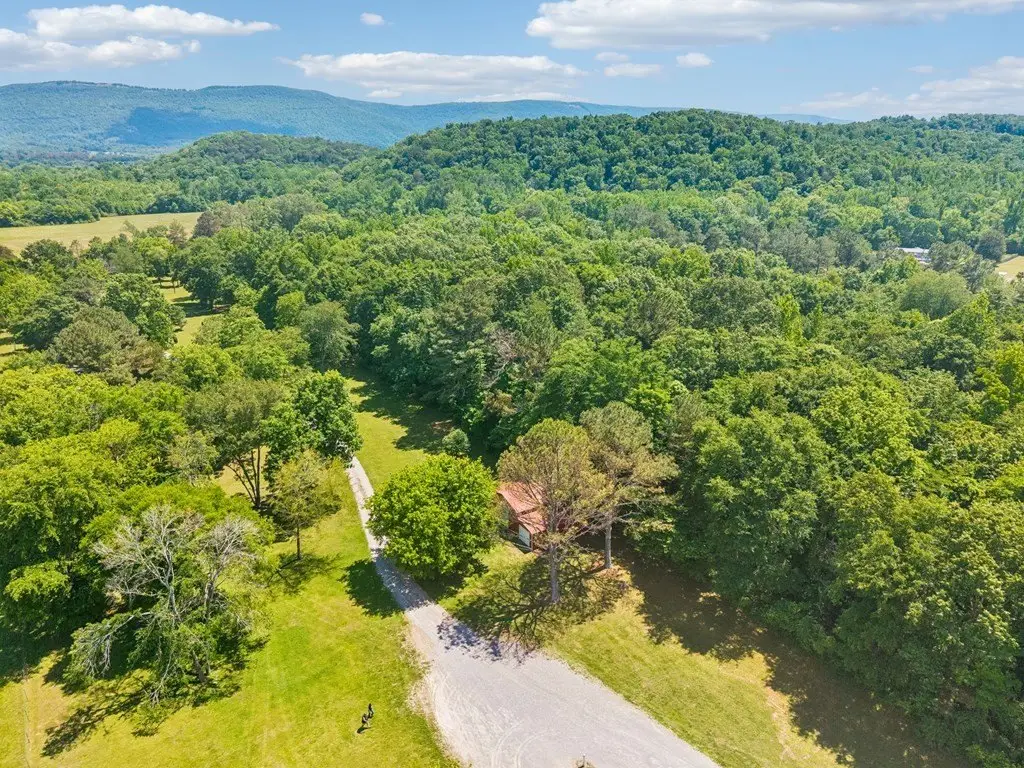
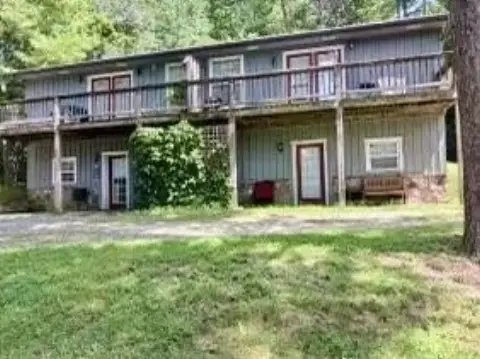
This 6.19-acre property includes a well-maintained home set among mature trees, along with open land that supports a range of on-site uses. Multiple outbuildings and large workshops are also included, offering dedicated space for storage, equipment, recreational vehicles, or other business-oriented work needs.
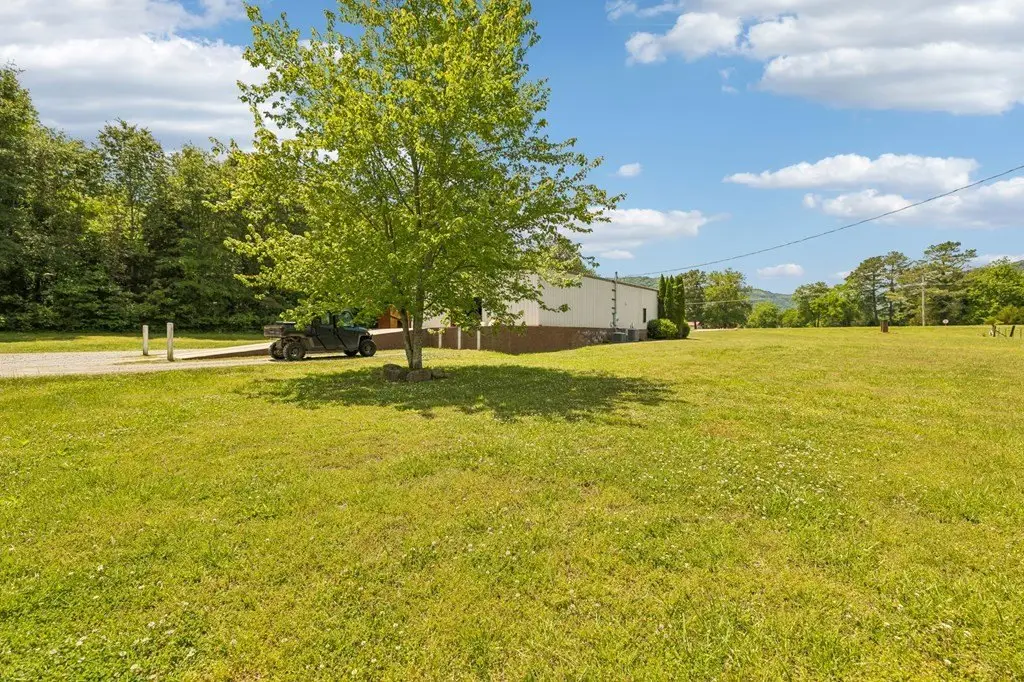
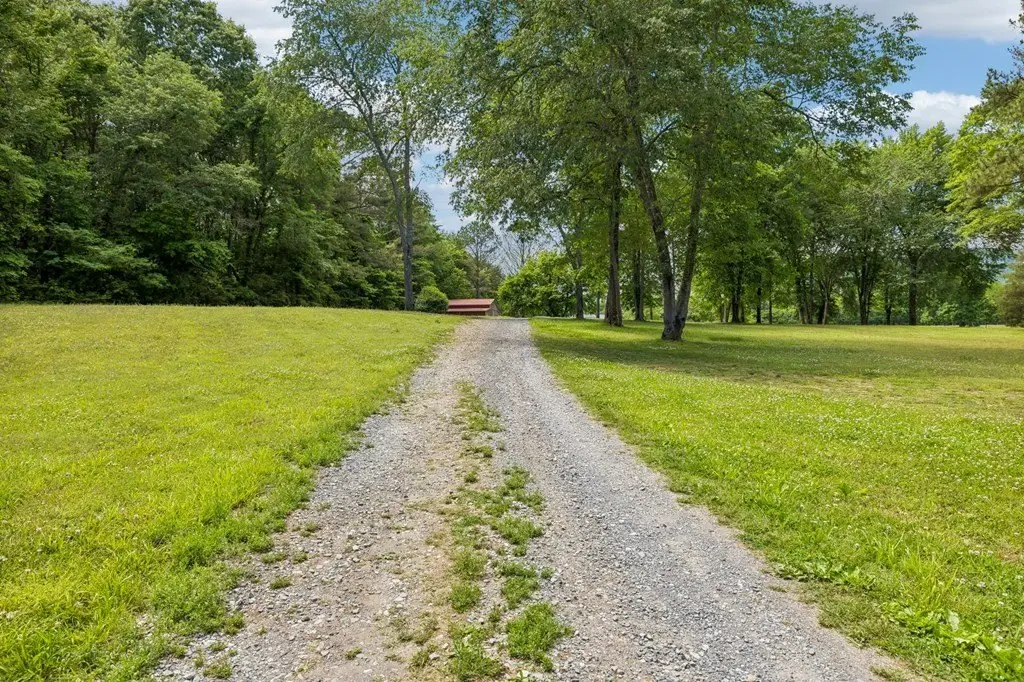
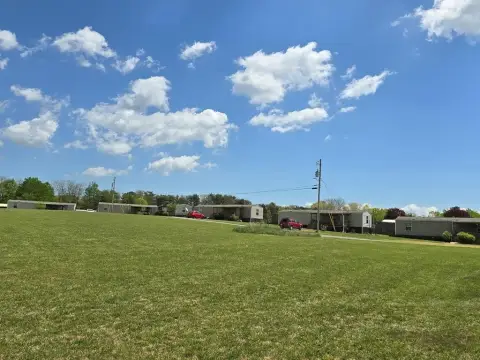
The property is located at 49 Cutting Edge Ln in Dunlap, TN 37327 (Sequatchie County). The combination of wooded areas and open space provides a degree of privacy while maintaining practical room for work and hobbies.
If you’re looking for land paired with substantial workshop capacity and auxiliary structures, this parcel is set up to accommodate multiple day-to-day uses on-site.
The property is located at 49 Cutting Edge Ln in Dunlap, TN 37327 (Sequatchie County). The combination of wooded areas and open space provides a degree of privacy while maintaining practical room for work and hobbies.
If you’re looking for land paired with substantial workshop capacity and auxiliary structures, this parcel is set up to accommodate multiple day-to-day uses on-site.
Key Highlights
- 6.19 acres of land offering privacy and outdoor space.
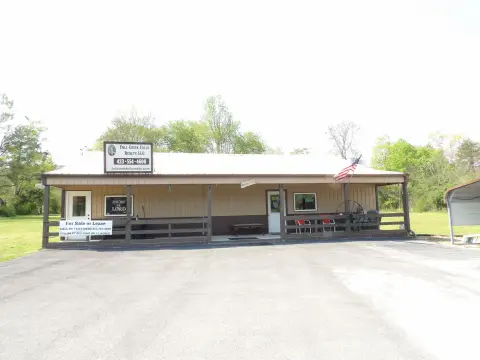
- Multiple outbuildings and large workshops suitable for storage, hobbies, or business use.
- Well‑maintained home with mature trees.
Financial Insights
Estimated NOI and Cap Rate
NOI / Yr
$21,143
Cap Rate
3.72%
Suggested Prices Based on Cap Rates
Cap Rate 5%
$422,860
$422.9K
Cap Rate 7%
$302,043
$302.0K
Cap Rate 9%
$234,922
$234.9K
Market Conditions
NOI Build-Up for 2,400 SF
Gross rent
$40.9K $17.04/SF
− Vacancy
−$2.5K −$1.02/SF
EGI
$38.4K $16.02/SF
− OpEx
−$17.3K −$7.21/SF
NOI
$21.1K $8.81/SF
Area
Sequatchie County, TN
Vacancy
6.00%
Lease Rate
$17.04 /SF/Yr
Expense Ratio
45.00%
Simulate Cap Rate and NOI
Suggested Prices Based on Cap Rates
Cap Rate 5%
$422,860
Cap Rate 7%
$302,043
Cap Rate 9%
$234,922
Alternative Uses
Best Use
Apartment 5plus
$302.0K
$264.3K – $352.4K
NOI $21,143 @ 7.0% cap · market cap 3.72%
Second Best
—
—
no second resolved use
Theoretical Best
Office A
$530.1K
$463.8K – $618.4K
NOI $37,104 @ 7.0% cap · market cap 6.52%
Zoning and permitted uses should be independently verified with authorities.
How Realmo checks its estimates
Property Analytics
Current Use
Location Intelligence
Trade Area within ½ mile
24
Businesses Nearby
Explore this area
Business Placement
Demographics for 37327, TN
12,412
Population
5,319
Households
2.3
Avg Household Size
43
Median Age
18%
College-Educated
81%
High-School Grad
191.4 sq mi
ZIP Area
65
Density / Sq Mi
$51,862
Median Household Income
$28,990
Median Earnings
$843
Median Rent
$217,600
Median Home Value



Frequently Asked Questions
What type of property is this?
Single family property - 6.19-acre property with a well-maintained home, mature trees, and multiple outbuildings including large workshops.
Where is this single family property located?
The property is located at 49 Cutting Edge Ln Dunlap, TN.
What is the asking price?
The asking price for this property is $569,000.
What are key features of this property?
This property features: 6.19 acres of land offering privacy and outdoor space.; Multiple outbuildings and large workshops suitable for storage, hobbies, or business use.; Well‑maintained home with mature trees.


