Flex Space with New Bay
For Sale
$1,169,000
4840 Memphis St, Dallas, TX 75207
Updated infrastructure supports office, showroom, studio, or boutique commercial use.
Property Size2,400 SF
Price / SF$487.08
Days on Market72
Property Features for 4840 Memphis St
General Information
Standard status
Active
Size
2,400 SF
Building Details
Year Built
1969
Listing Agency:
Compass RE Texas, LLC.
Listed By:
Angela Downes · License #0409878
(214) 814-8100
Source:
Tonyaharbin
Added: Aug 3
Changed: Oct 2
Last Checked: Oct 13 at 1:15AM
Displayed information is deemed reliable but is not guaranteed and should be independently verified. All listing content including descriptions, pricing, images are the copyrighted material of Compass RE Texas, LLC.
Investment Insights
Based on property information with market context.
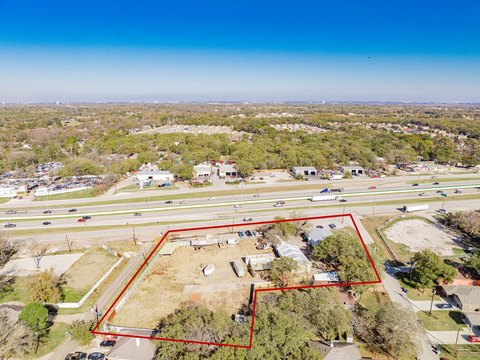
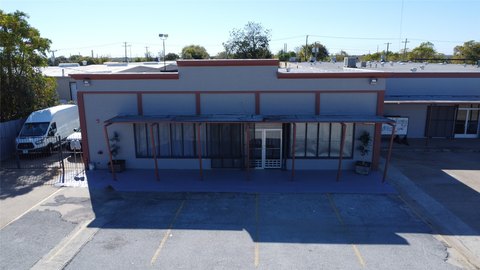
Built in 1969, this 2,400-square-foot flex property has received practical infrastructure upgrades, including new plumbing and HVAC, updated 3-phase power, fresh interior paint, and a new bay door. The layout supports creative office, showroom, studio, and boutique commercial applications described for the property. A turfed rear area adds usable outdoor space, while the gated driveway provides controlled access.
The property offers direct access to Inwood Road, with connectivity to I-35E, Love Field, Oak Lawn, and Downtown Dallas. It is currently leased, providing ongoing income for an owner seeking an occupied commercial asset.
The property offers direct access to Inwood Road, with connectivity to I-35E, Love Field, Oak Lawn, and Downtown Dallas. It is currently leased, providing ongoing income for an owner seeking an occupied commercial asset.
Key Highlights
- 2,400 SF flex property built in 1969
- New plumbing and HVAC, updated 3‑phase power, and fresh paint
- New bay door supports flexible commercial functionality
Financial Insights
Estimated NOI and Cap Rate
NOI / Yr
$38,617
Cap Rate
3.30%
Suggested Prices Based on Cap Rates
Cap Rate 5%
$772,340
$772.3K
Cap Rate 7%
$551,671
$551.7K
Cap Rate 9%
$429,078
$429.1K
Market Conditions
NOI Build-Up for 2,400 SF
Gross rent
$57.9K $24.12/SF
− Vacancy
−$2.7K −$1.13/SF
EGI
$55.2K $22.99/SF
− OpEx
−$16.6K −$6.90/SF
NOI
$38.6K $16.09/SF
Area
Dallas, TX
Vacancy
4.70%
Lease Rate
$24.12 /SF/Yr
Expense Ratio
30.00%
Simulate Cap Rate and NOI
Suggested Prices Based on Cap Rates
Cap Rate 5%
$772,340
Cap Rate 7%
$551,671
Cap Rate 9%
$429,078
Alternative Uses
Best Use
Office B
$1.97M
$1.72M – $2.30M
NOI $137,979 @ 7.0% cap · market cap 11.80%
Second Best
Retail
$551.7K
$482.7K – $643.6K
NOI $38,617 @ 7.0% cap · market cap 3.30%
Theoretical Best
Office A
$2.88M
$2.52M – $3.36M
NOI $201,586 @ 7.0% cap · market cap 17.24%
Zoning and permitted uses should be independently verified with authorities.
How Realmo checks its estimates
Property Analytics
Unlock full access to Insights
Subscribe to Realmo Intelligence
Open Analytics
Current Use
Location Intelligence
Trade Area within ½ mile
3,102
Businesses Nearby
Well-served
Demand for This Use
Explore this area
Business Placement
Demographics for 75207, TX
7,116
Population
2,465
Households
2.9
Avg Household Size
33
Median Age
30%
College-Educated
81%
High-School Grad
3.9 sq mi
ZIP Area
1,825
Density / Sq Mi
$84,149
Median Household Income
$45,903
Median Earnings
$1,789
Median Rent
Check the figures for this property
Cap Rate, Value Estimation, Potential NOI and more
View Realmo Analytics
Market
Vacancy Rate% for Office in Dallas, TX

Questions? Ask Rey
Realmo’s AI knows this listing — price, zoning, demand, history. Ask anything.




Similar Off Market Nearby
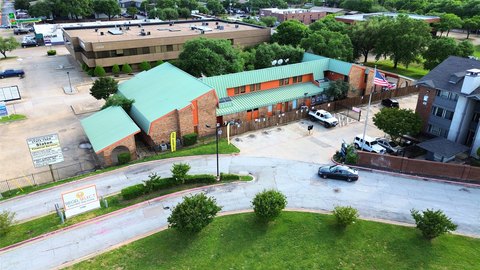
- Freshnez — 4936 Reading St, Dallas, TX 75247
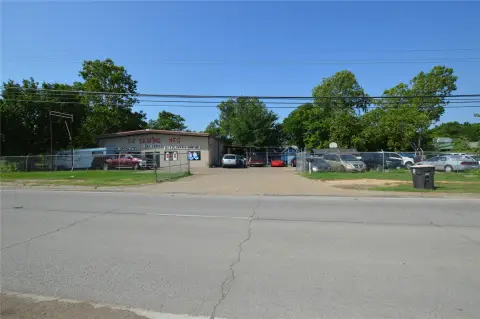
- Sonny Bryan’s Smokehouse — 2202 Inwood Rd, Dallas, TX 75235
Frequently Asked Questions
What type of property is this?
Flex space - Updated infrastructure supports office, showroom, studio, or boutique commercial use.
Where is this flex space located?
The property is located at 4840 Memphis St Dallas, TX.
What is the asking price?
The asking price for this property is $1,169,000.
What are key features of this property?
This property features: 2,400 SF flex property built in 1969; New plumbing and HVAC, updated 3‑phase power, and fresh paint; New bay door supports flexible commercial functionality


