Turn-Key Restaurant Near Smugglers’
For Sale
$1,295,000
4807 Vt Route 15, Cambridge, VT 05464
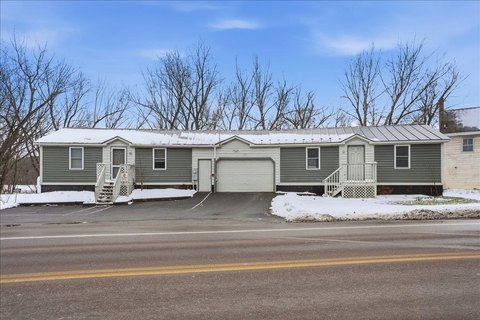
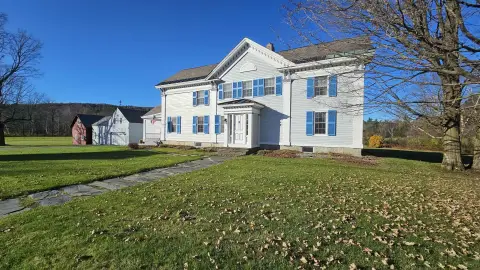
Fully operational restaurant for sale near Smugglers’ Notch Resort.
Property Size2,793 SF
Price / SF$463.66
Days on Market218
Property Features for 4807 Vt Route 15
General Information
Standard status
Active
Size
2,793 SF
Building Details
Year Built
1978
Listing Agency:
KW Vermont-Stowe
Listed By:
Steven Foster · License #VT 081.0134141
(802) 585-1150
Source:
Langelange
Added: Mar 11
Changed: Sep 12
Last Checked: Oct 7 at 4:28PM
Displayed information is deemed reliable but is not guaranteed and should be independently verified. All listing content including descriptions, pricing, images are the copyrighted material of KW Vermont-Stowe
Investment Insights
Based on property information with market context.
This is an opportunity to own a turn-key restaurant in a Vermont town, located minutes from Smugglers’ Notch Resort. The restaurant benefits from foot traffic and a customer base of locals and visitors. The space has been recently renovated, including a reconfigured entryway and bar area designed to optimize flow during service hours. The sale includes all furniture, fixtures, and equipment, as well as the intellectual property and assets of the current restaurant, The Family Table. This is a chance to step into a fully operational restaurant in a prime location.
Key Highlights
- Turn‑key restaurant opportunity in a prime Vermont location, minutes from Smugglers’ Notch Resort.
- Includes all furniture, fixtures, equipment, and intellectual property of the existing restaurant, The Family Table.
- Recently renovated with modern updates, including a reconfigured entryway and bar area.
Financial Insights
Estimated NOI and Cap Rate
NOI / Yr
$45,449
Cap Rate
3.51%
Suggested Prices Based on Cap Rates
Cap Rate 5%
$908,980
$909.0K
Cap Rate 7%
$649,271
$649.3K
Cap Rate 9%
$504,989
$505.0K
Market Conditions
NOI Build-Up for 2,793 SF
Gross rent
$61.3K $21.96/SF
− Vacancy
−$736 −$0.26/SF
EGI
$60.6K $21.70/SF
− OpEx
−$15.1K −$5.42/SF
NOI
$45.4K $16.27/SF
Area
Chittenden County, VT
Vacancy
1.20%
Lease Rate
$21.96 /SF/Yr
Expense Ratio
25.00%
Simulate Cap Rate and NOI
Suggested Prices Based on Cap Rates
Cap Rate 5%
$908,980
Cap Rate 7%
$649,271
Cap Rate 9%
$504,989
Alternative Uses
Best Use
Specialty Retail
$649.3K
$568.1K – $757.5K
NOI $45,449 @ 7.0% cap · market cap 3.51%
Second Best
—
—
no second resolved use
Theoretical Best
Office A
$766.1K
$670.3K – $893.8K
NOI $53,626 @ 7.0% cap · market cap 4.14%
Zoning and permitted uses should be independently verified with authorities.
How Realmo checks its estimates
Property Analytics
Unlock full access to Insights
Subscribe to Realmo Intelligence
Open Analytics
Current Use
Location Intelligence
Trade Area within ½ mile
141
Businesses Nearby
Well-served
Demand for This Use
Explore this area
Business Placement
Demographics for 05464, VT
2,975
Population
1,521
Households
2
Avg Household Size
40
Median Age
49%
College-Educated
97%
High-School Grad
56.4 sq mi
ZIP Area
53
Density / Sq Mi
$86,464
Median Household Income
$41,993
Median Earnings
$1,091
Median Rent
$326,100
Median Home Value
Check the figures for this property
Cap Rate, Value Estimation, Potential NOI and more
View Realmo Analytics
Market
Vacancy Rate% for Retail in Northeast region

Questions? Ask Rey
Realmo’s AI knows this listing — price, zoning, demand, history. Ask anything.

Frequently Asked Questions
What type of property is this?
Conventional restaurant - Fully operational restaurant for sale near Smugglers’ Notch Resort.
Where is this conventional restaurant located?
The property is located at 4807 Vt Route 15 Cambridge, VT.
What is the asking price?
The asking price for this property is $1,295,000.
What are key features of this property?
This property features: Turn‑key restaurant opportunity in a prime Vermont location, minutes from Smugglers’ Notch Resort.; Includes all furniture, fixtures, equipment, and intellectual property of the existing restaurant, The Family Table.; Recently renovated with modern updates, including a reconfigured entryway and bar area.


