CMX-1 Mixed-Use Corner

For Sale
$269,900
4801 N 10TH Street, Philadelphia, PA 19141
Multi-Family, PHILADELPHIA, PA
Property Size1,410 SF
Lot Size0.03 Acres
Price / SF$191.42
Days on Market105
Property Features for 4801 N 10TH Street
General Information
Property type
Residential Multi Family
Property subtype
Other
Rooms
Basement
Parking features
On Street
Interior features
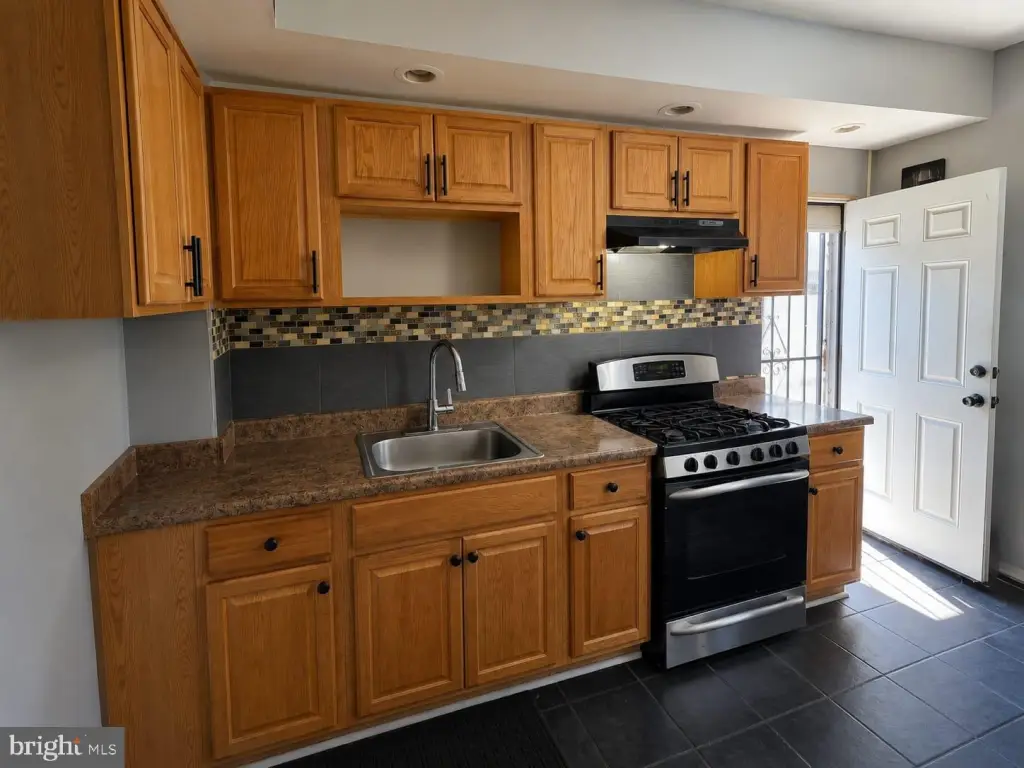
Kitchen - Eat-In
Subdivision
LOGAN
High school
OLNEY HIGH SCHOOL EAST
Elementary school district
PHILADELPHIA CITY
Middle school district
PHILADELPHIA CITY
High school district
PHILADELPHIA CITY
Standard status
Active
Size
1,410 SF
Lot size
0.03 Acres
Taxes and HOA fees
Tax Annual Amount
1743
Utilities
Heating system
Forced Air
Amenities
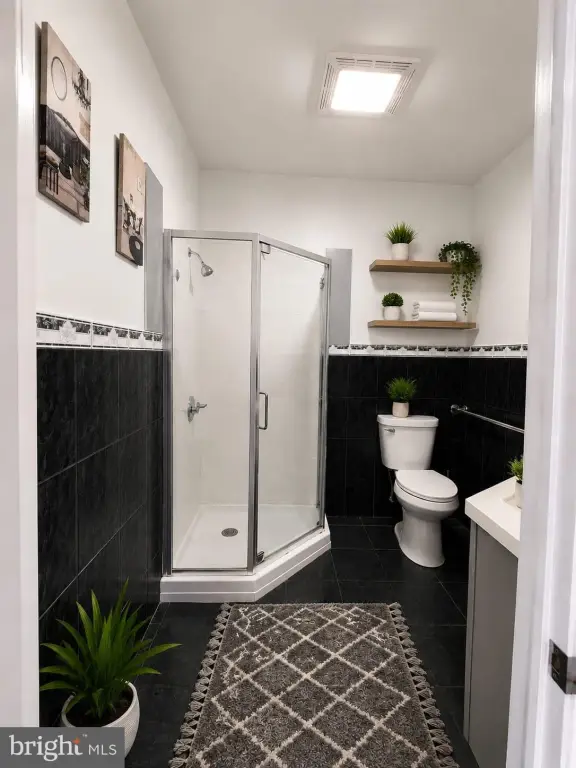
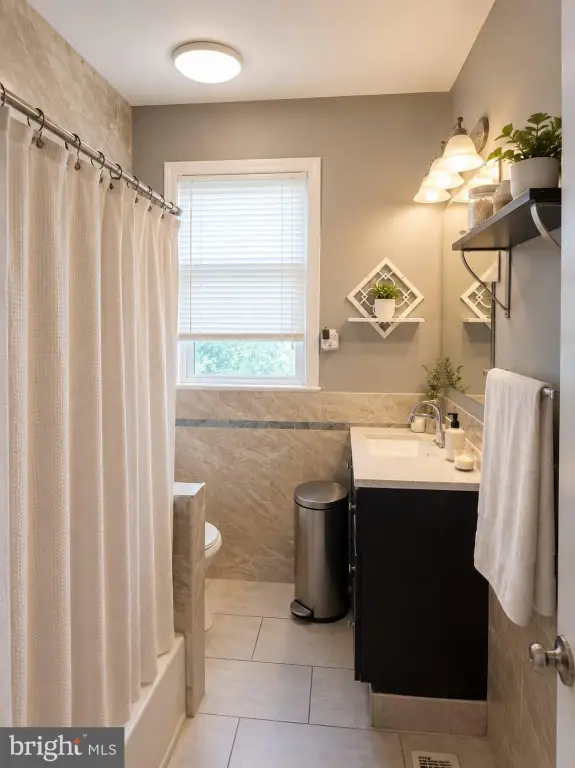
full bathroom
wheelchair-accessible ramp and wide entry door
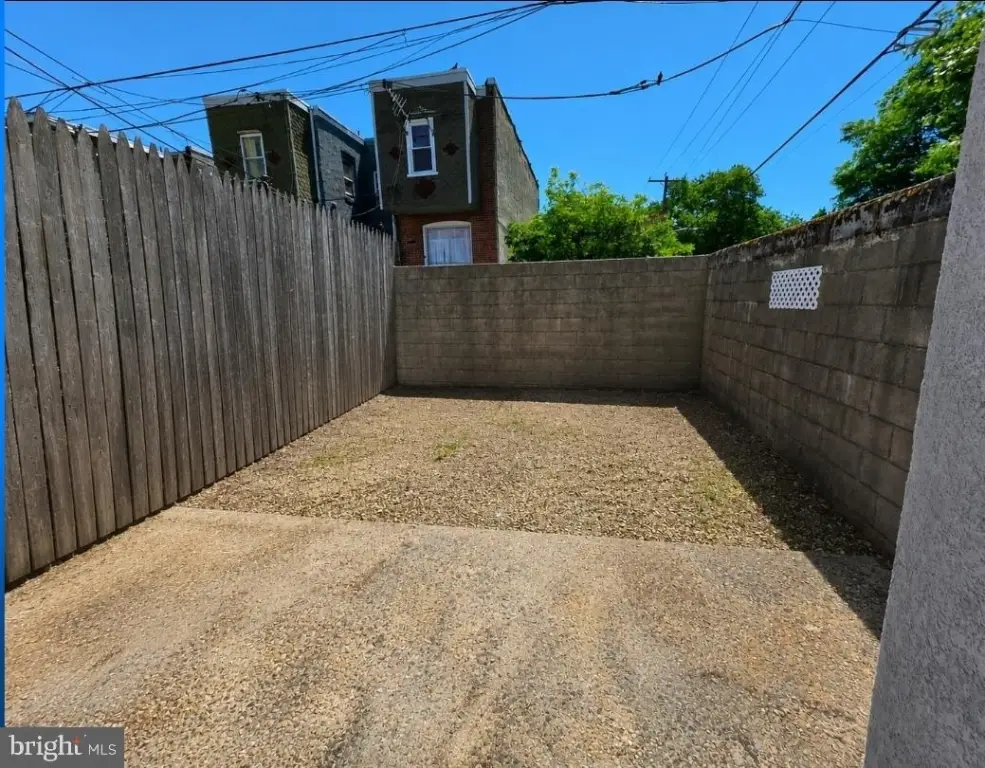
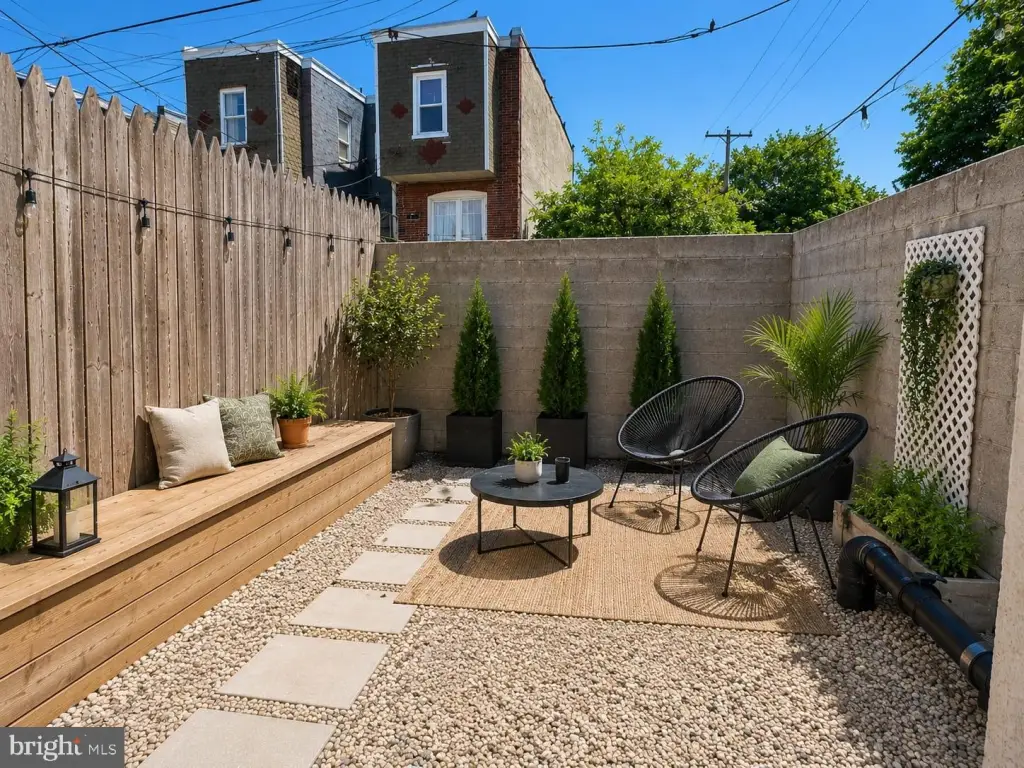
private yard
200-amp electrical service
full, dry basement
forced-air heating system
ductwork throughout the building
separate entrances
Building Details
Year built
1940
Number of units
2
Building materials
Stucco
Architectural style
Other
Listing Agency:
Keller Williams Real Estate Tri-County · Keller Williams Realty
(215) 464-8800
Listed By:
Rosario Khatri · License #Rs352119
(267) 897-8649
Added: Jun 30
Changed: Aug 20
Last Checked: Oct 12 at 2:06AM
MLS# PAPH2643036
Copyright © 2026 Bright MLS. All rights reserved. All information provided by the listing agent/broker is deemed reliable but is not guaranteed and should be independently verified.
Investment Insights
Based on property information with market context.
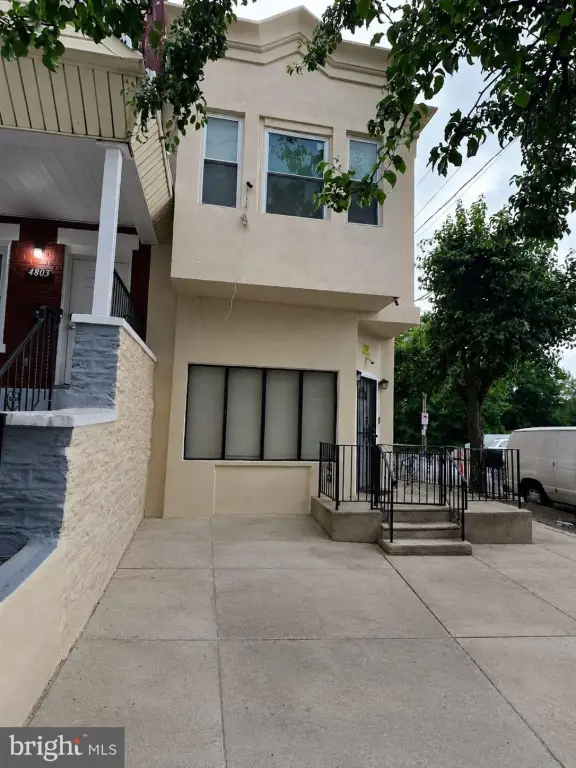
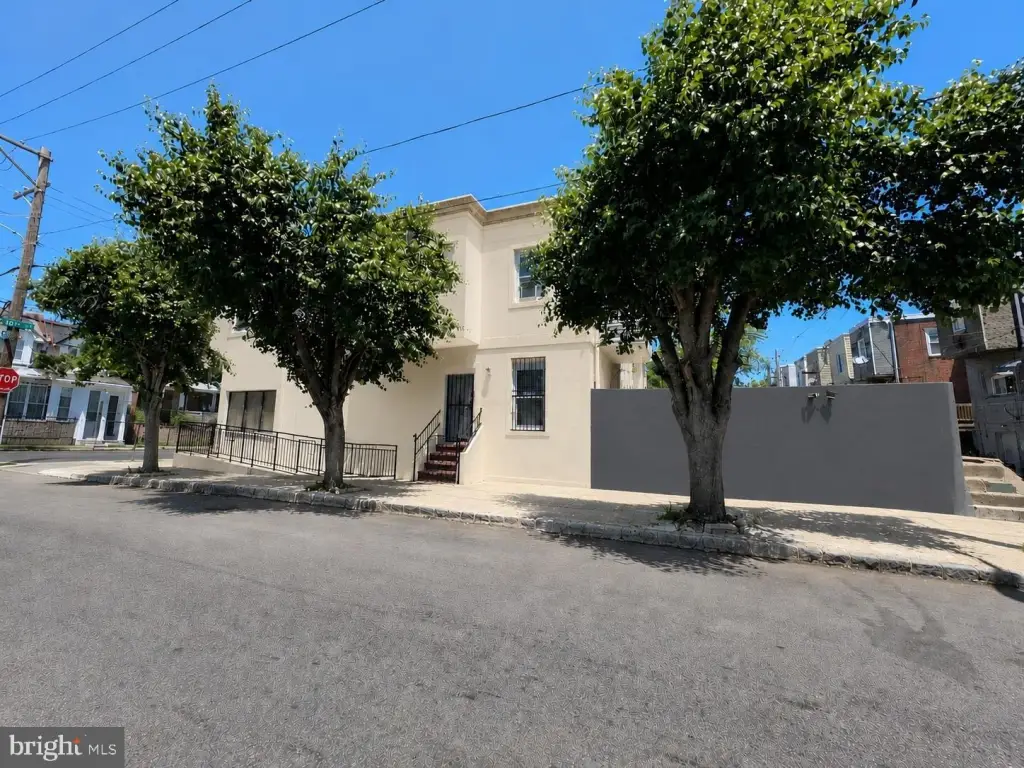
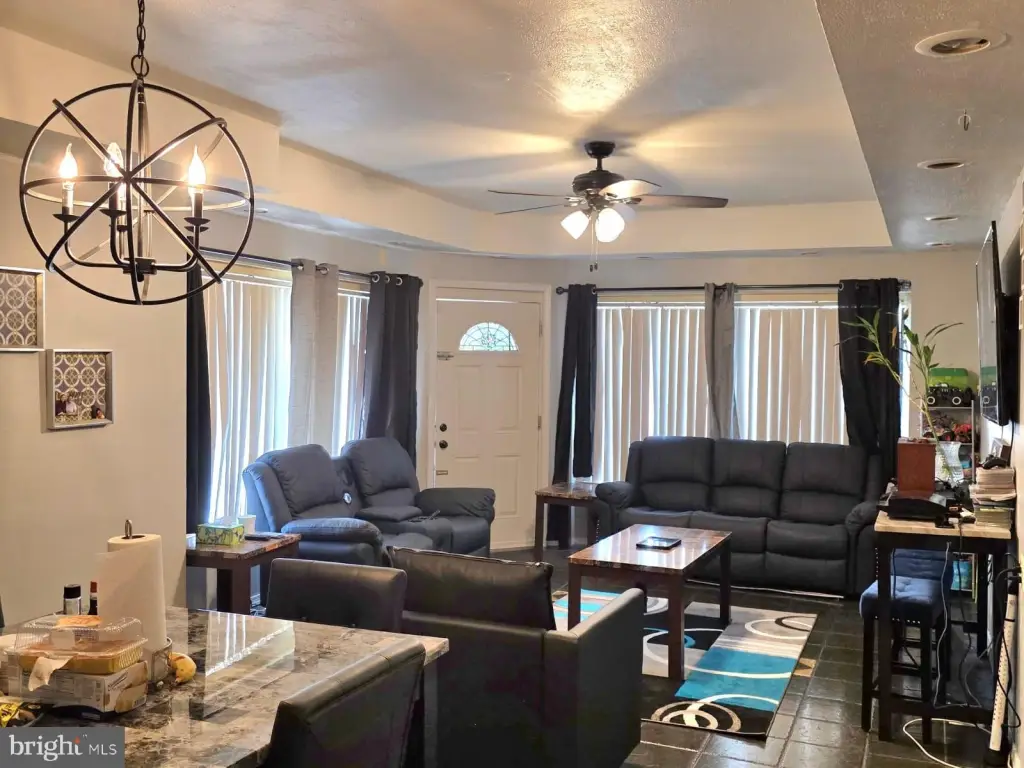
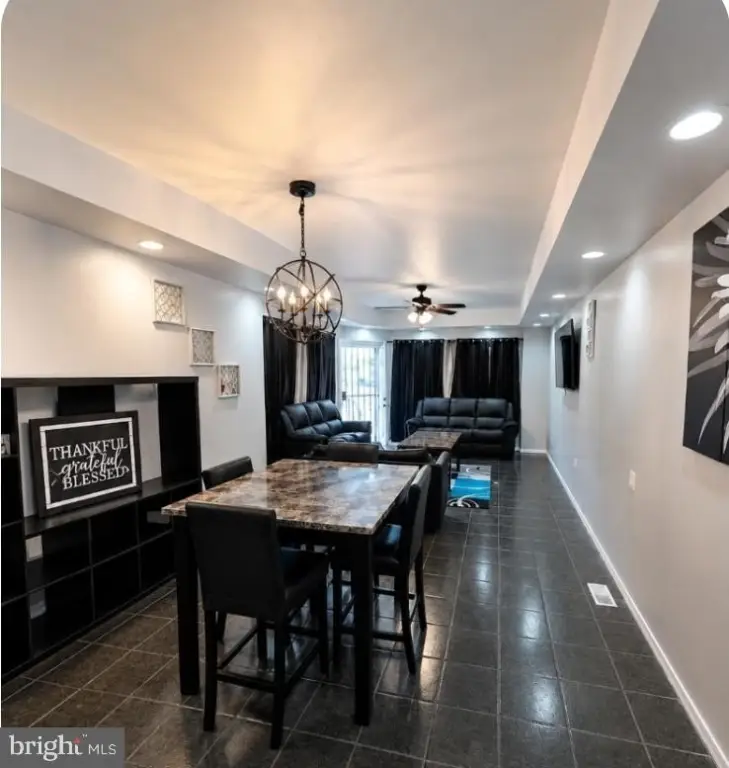
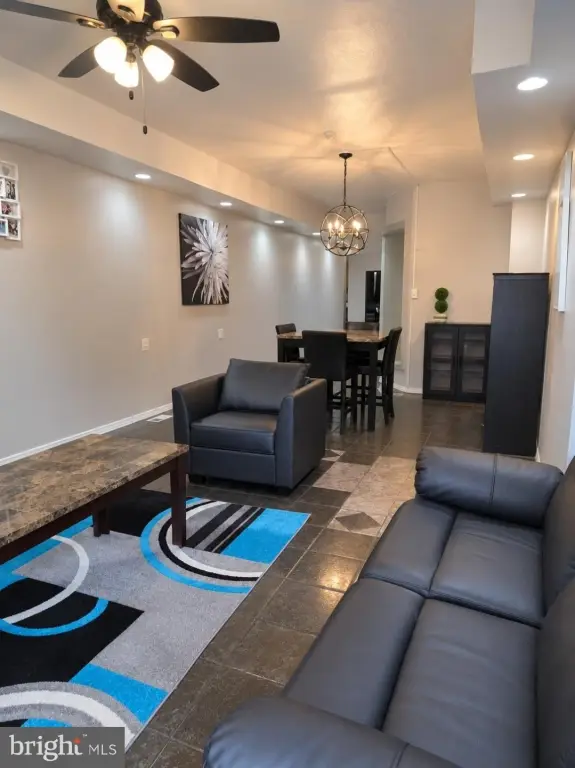
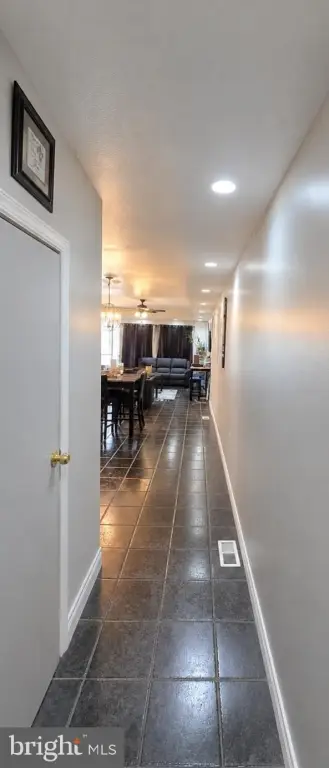
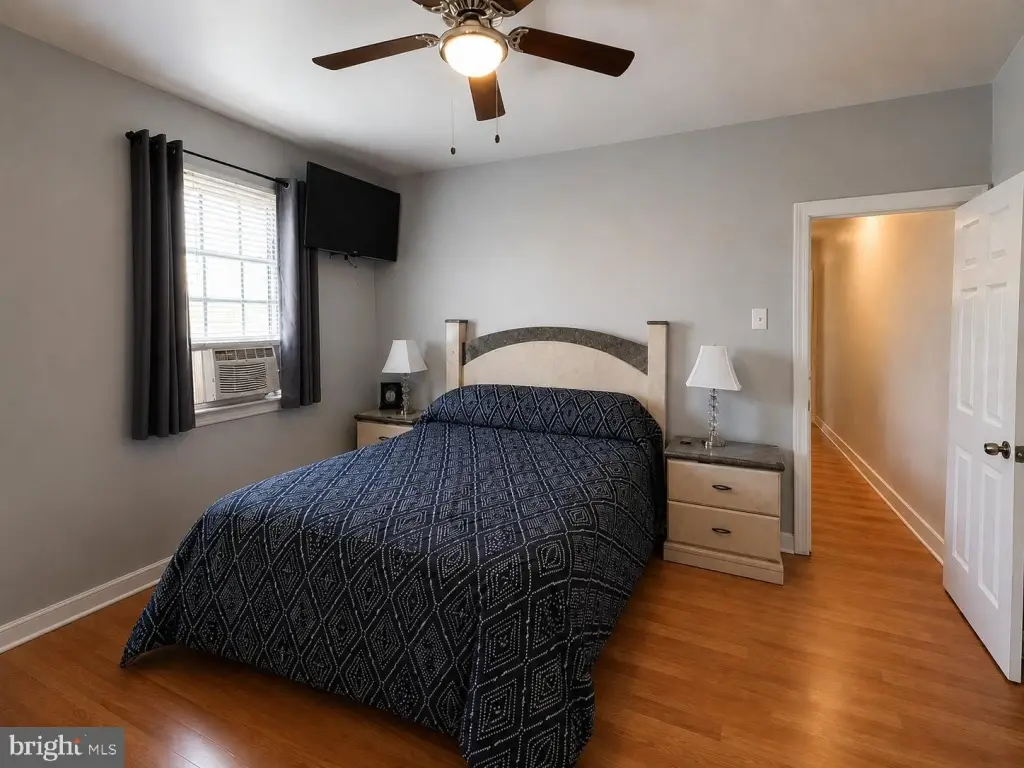
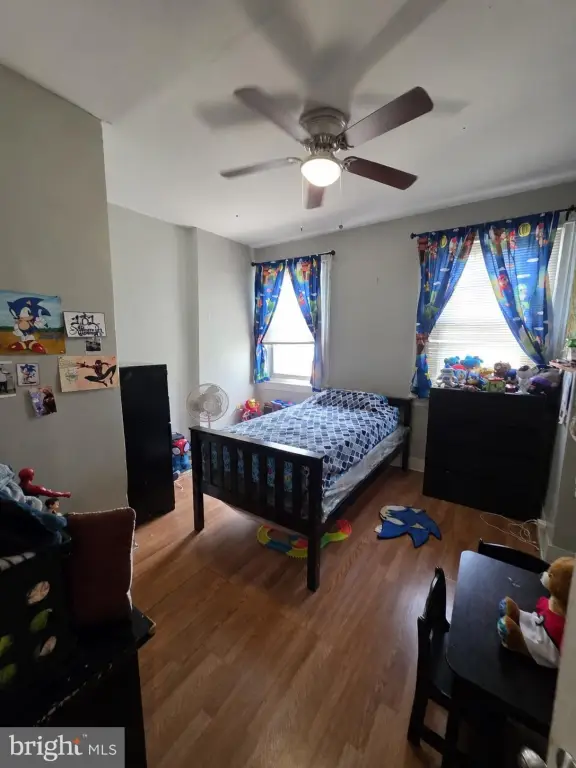
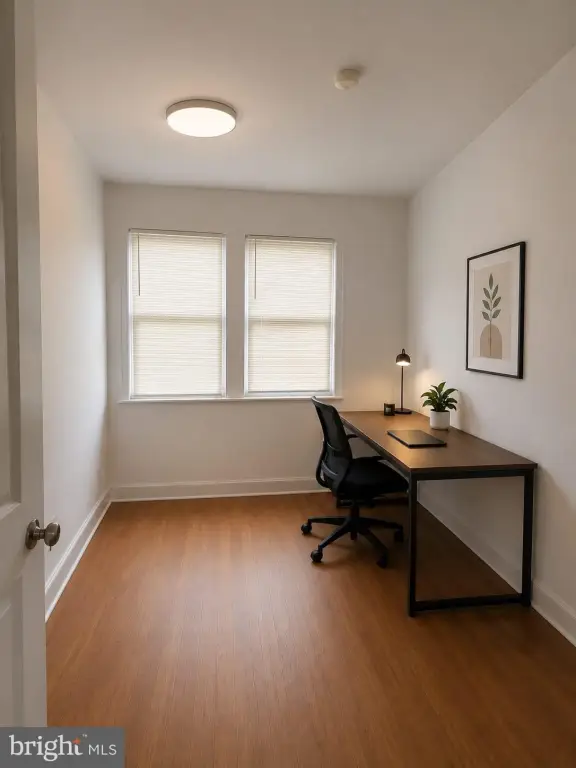
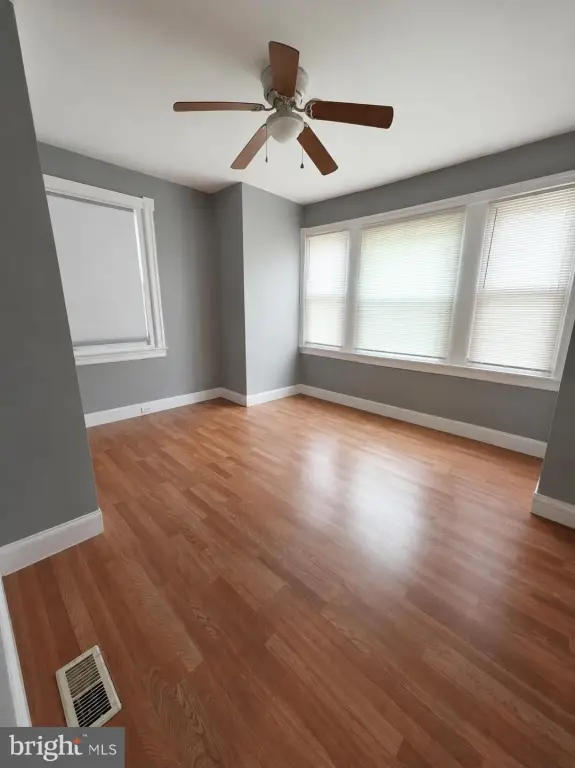
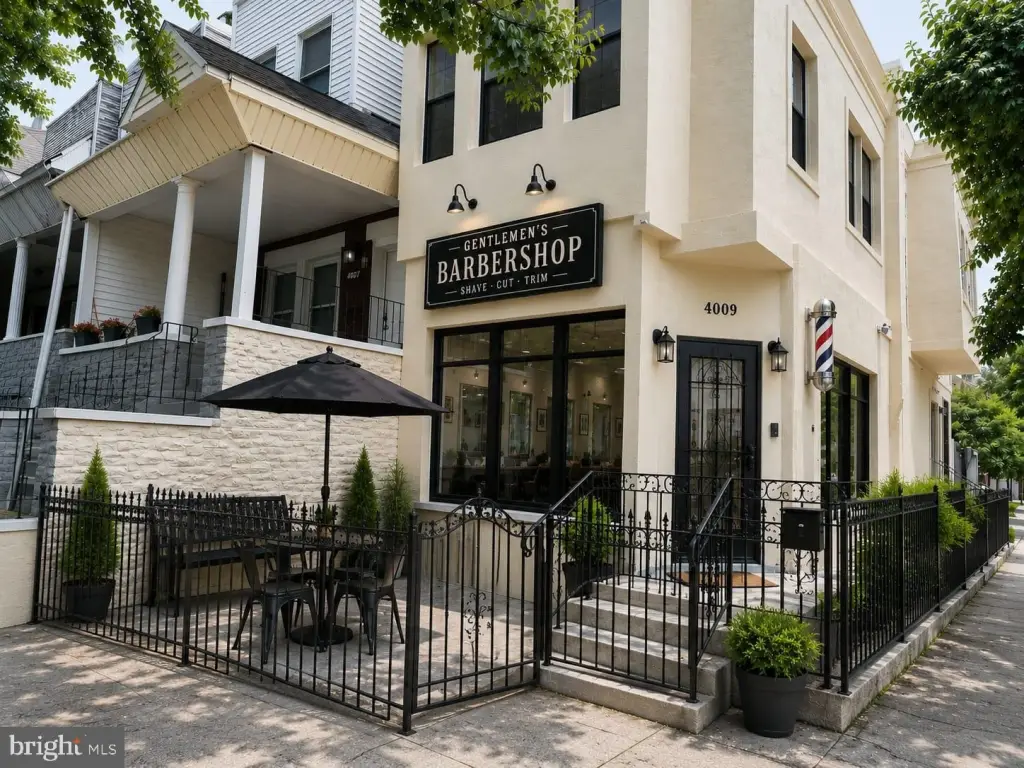
Located at 4801 N. 10th Street in Philadelphia, this 1,410-square-foot mixed-use property was built in 1940 and occupies a 0.0296-acre lot. CMX-1 zoning supports a range of commercial and mixed-use applications. The first floor contains a commercial area with tile flooring, barber-style lighting, dedicated electrical outlets, and a full bathroom. A four-bedroom apartment occupies the second floor, with its own entrance and an additional full bathroom.
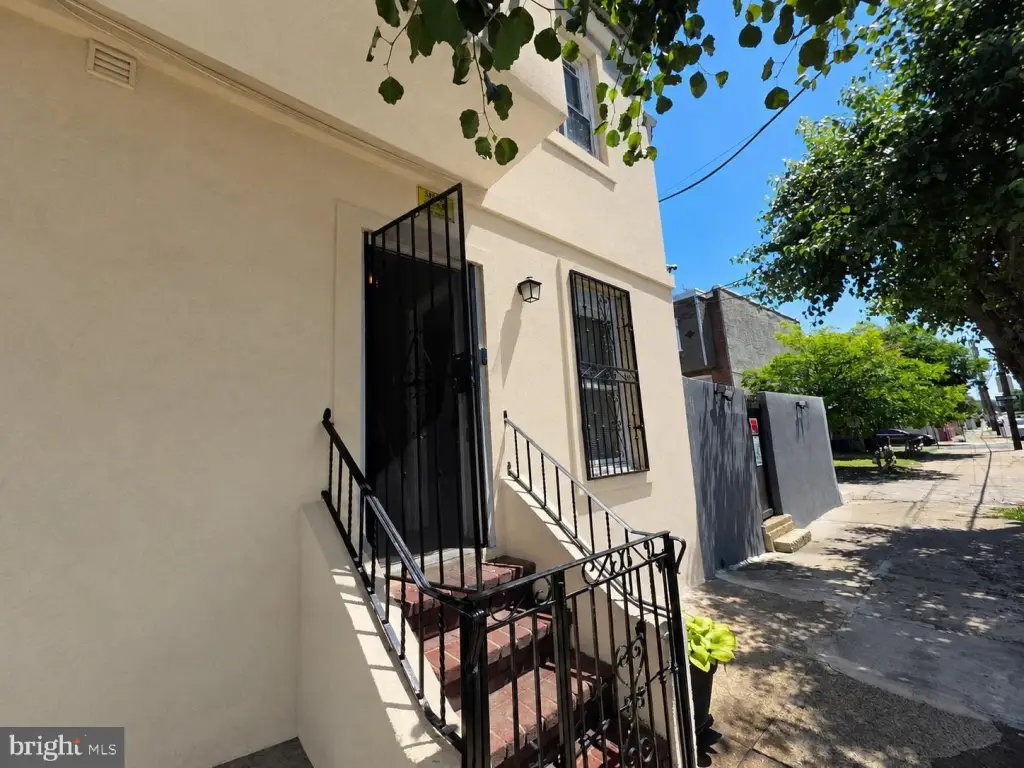
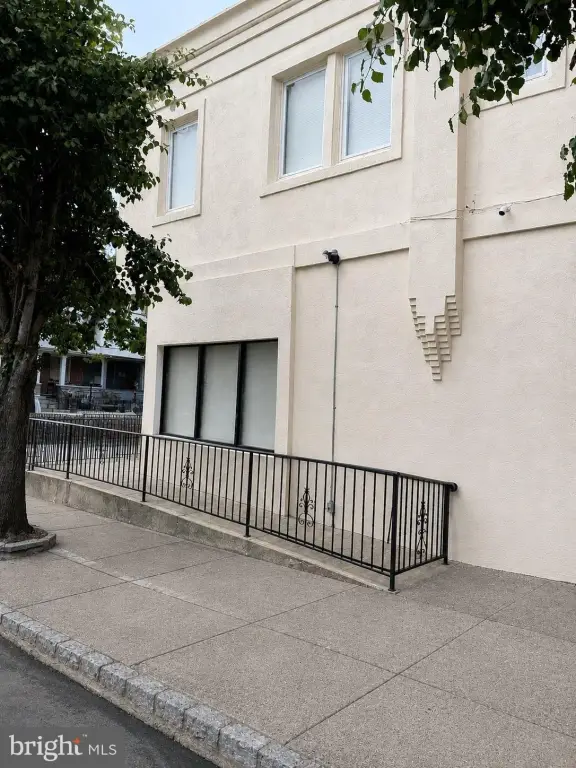
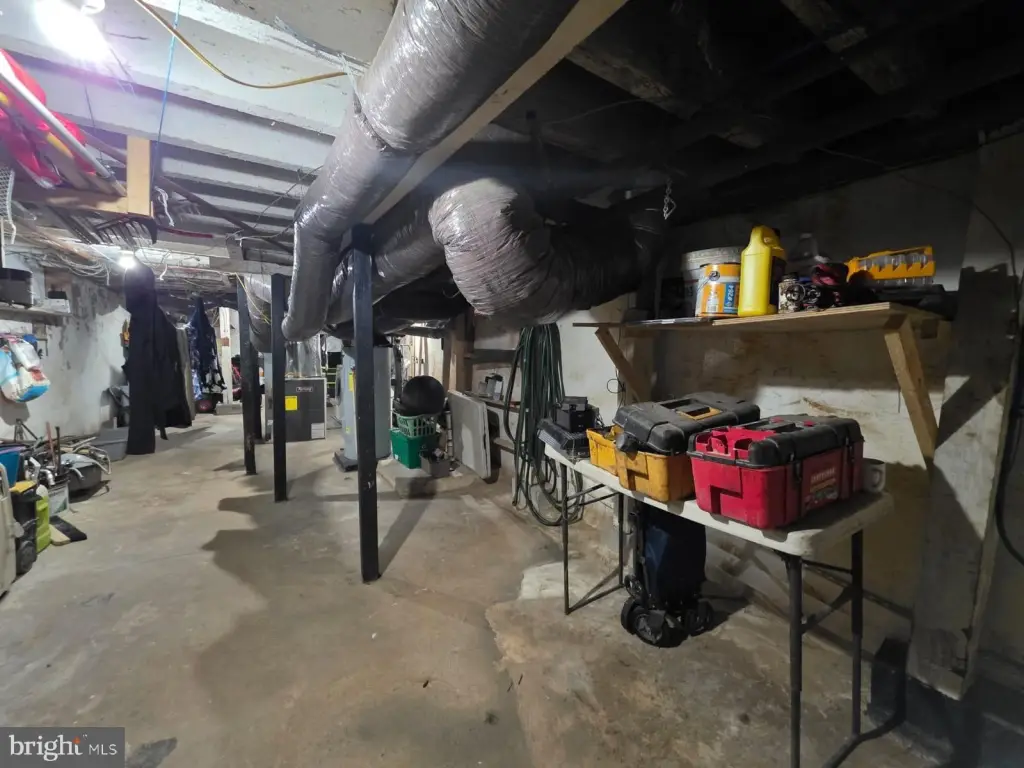
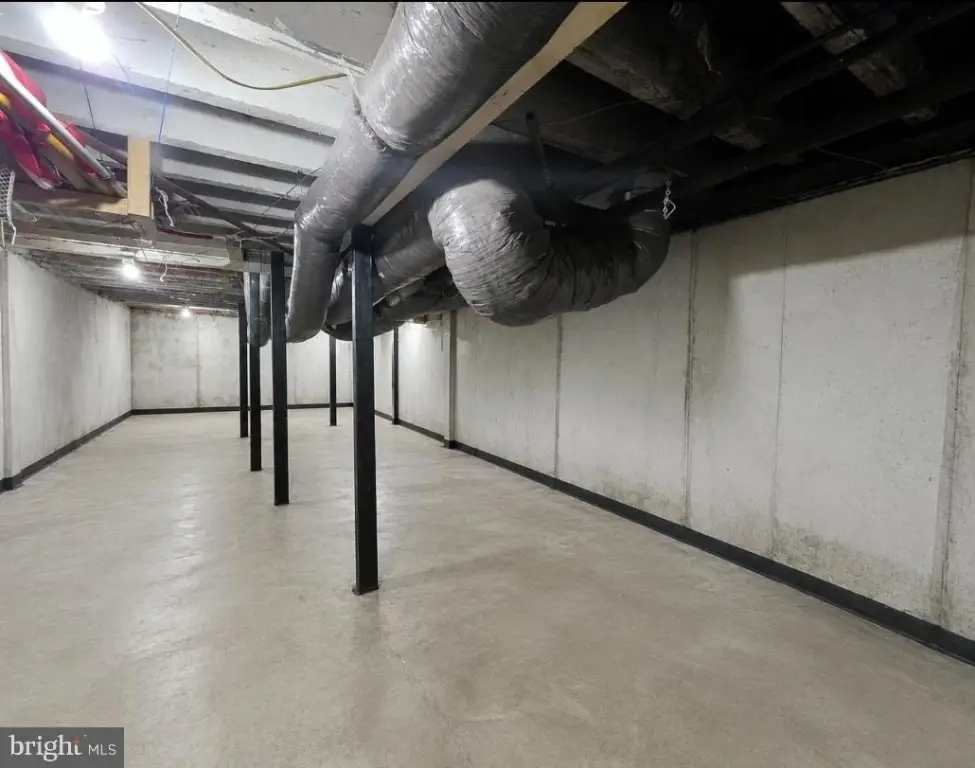
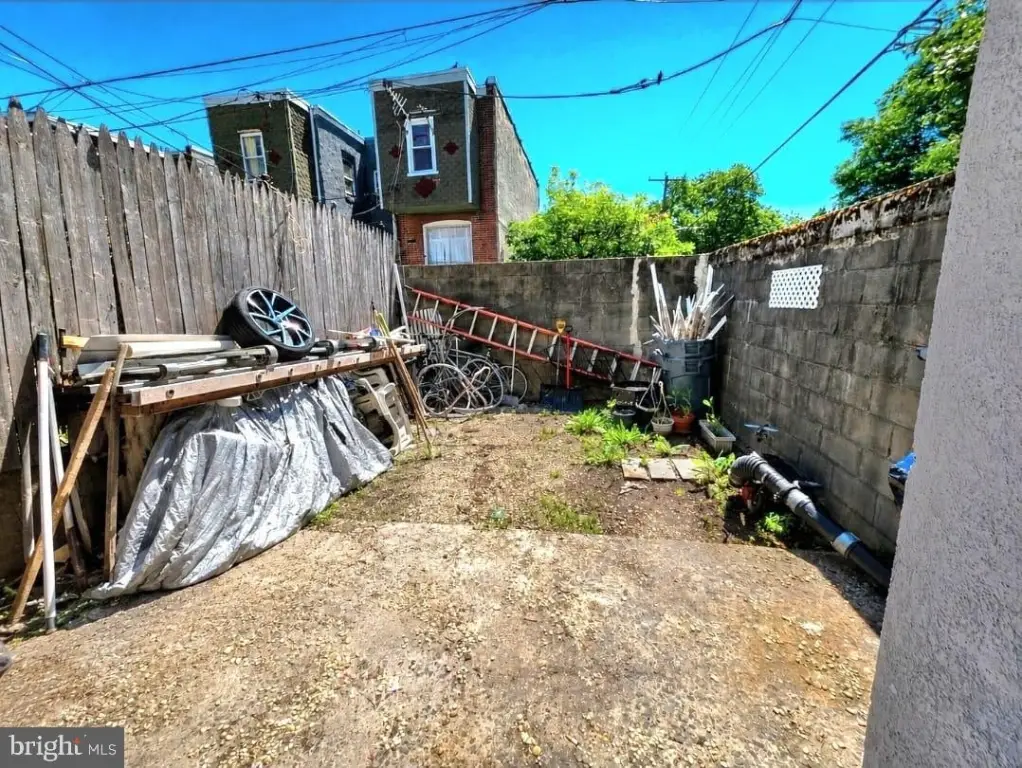
Separate commercial and residential entrances support independent access between the two levels. Accessibility features include a wheelchair ramp and wide entry door. The building also offers a full dry basement, private yard, forced-air heat, stucco construction, and 200-amp electrical service. Utilities may be separated into two meters. Existing ductwork remains from a prior central air system, while parking is available on the street.
Separate commercial and residential entrances support independent access between the two levels. Accessibility features include a wheelchair ramp and wide entry door. The building also offers a full dry basement, private yard, forced-air heat, stucco construction, and 200-amp electrical service. Utilities may be separated into two meters. Existing ductwork remains from a prior central air system, while parking is available on the street.
Key Highlights
- 1,410‑square‑foot mixed‑use building on a 0.0296‑acre lot
- CMX‑1 zoning with commercial space on the first floor
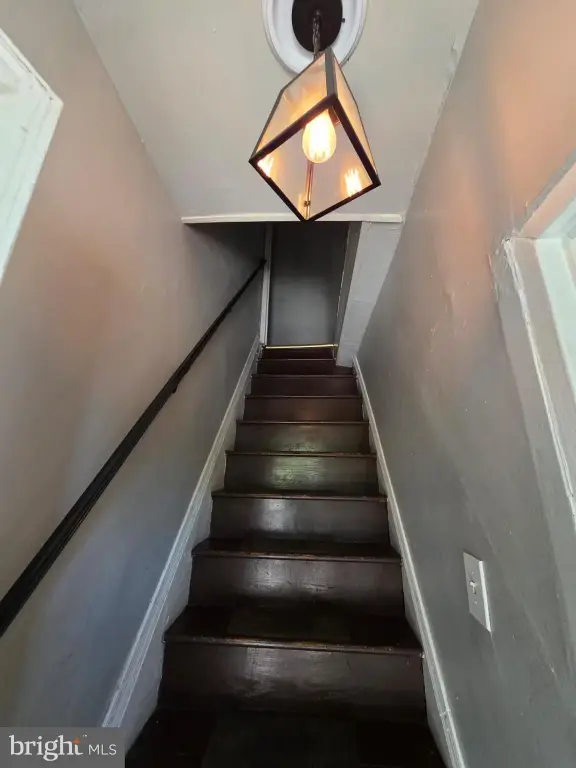
- Second‑floor four‑bedroom apartment with separate entrance
Financial Insights
Estimated NOI and Cap Rate
NOI / Yr
$18,555
Cap Rate
6.87%
Suggested Prices Based on Cap Rates
Cap Rate 5%
$371,100
$371.1K
Cap Rate 7%
$265,071
$265.1K
Cap Rate 9%
$206,167
$206.2K
Market Conditions
NOI Build-Up for 1,410 SF
Gross rent
$31.0K $21.96/SF
− Vacancy
−$6.2K −$4.41/SF
EGI
$24.7K $17.55/SF
− OpEx
−$6.2K −$4.39/SF
NOI
$18.6K $13.16/SF
Area
Philadelphia, PA
Vacancy
20.10%
Lease Rate
$21.96 /SF/Yr
Expense Ratio
25.00%
Simulate Cap Rate and NOI
Suggested Prices Based on Cap Rates
Cap Rate 5%
$371,100
Cap Rate 7%
$265,071
Cap Rate 9%
$206,167
Alternative Uses
Best Use
Office B
$265.1K
$231.9K – $309.3K
NOI $18,555 @ 7.0% cap · market cap 6.87%
Second Best
Mixed Use
$239.3K
$209.4K – $279.2K
NOI $16,751 @ 7.0% cap · market cap 6.21%
Theoretical Best
Multifamily LT 5
$343.7K
$300.8K – $401.0K
NOI $24,062 @ 7.0% cap · market cap 8.92%
Zoning and permitted uses should be independently verified with authorities.
Property Analytics
Unlock full access to Insights
Subscribe to Realmo Intelligence
Open Analytics
Current Use
Lease Details
1
Residential units
Yes
Utilities to site
Location Intelligence
Trade Area within ½ mile
1,638
Businesses Nearby
Explore this area
Business Placement
Demographics for 19141, PA
31,047
Population
16,290
Households
1.9
Avg Household Size
39
Median Age
16%
College-Educated
87%
High-School Grad
1.7 sq mi
ZIP Area
18,263
Density / Sq Mi
$42,461
Median Household Income
$34,464
Median Earnings
$1,009
Median Rent
$143,400
Median Home Value
Check the figures for this property
Cap Rate, Value Estimation, Potential NOI and more
View Realmo Analytics
Market
Vacancy Rate% for Office in Philadelphia, PA

Questions? Ask Rey
Realmo’s AI knows this listing — price, zoning, demand, history. Ask anything.




Frequently Asked Questions
What type of property is this?
Mixed-use property - Two-level configuration combines a commercial storefront with a separately entered four-bedroom apartment and full basement storage.
Where is this mixed-use property located?
The property is located at 4801 N 10TH Street Philadelphia, PA.
What is the asking price?
The asking price for this property is $269,900.
What are key features of this property?
This property features: 1,410‑square‑foot mixed‑use building on a 0.0296‑acre lot; CMX‑1 zoning with commercial space on the first floor; Second‑floor four‑bedroom apartment with separate entrance


