B-2 Mixed-Use
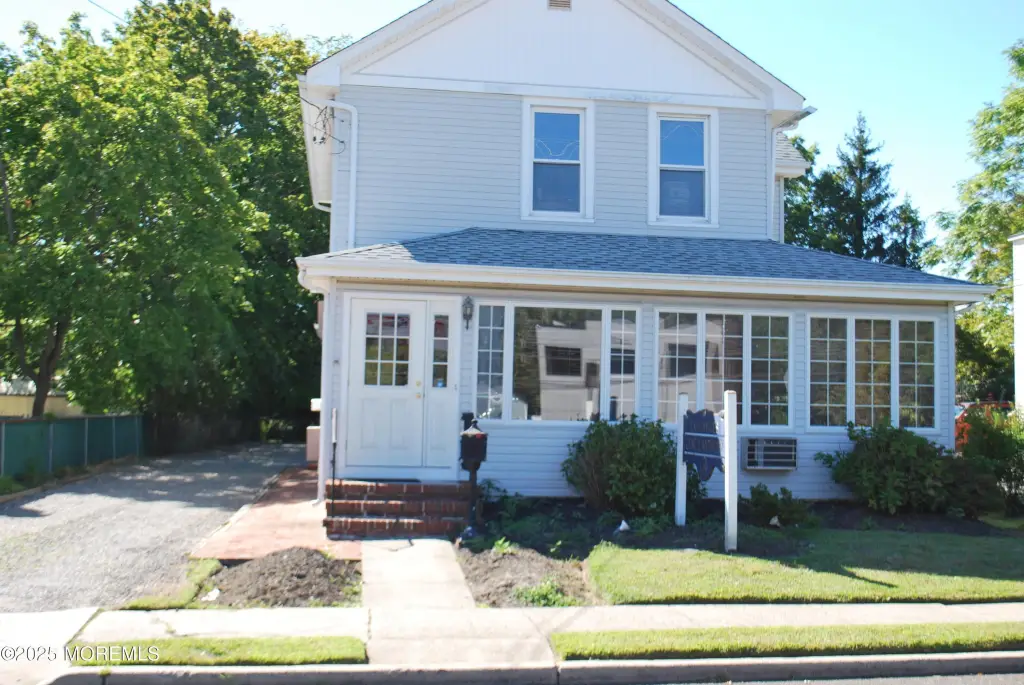
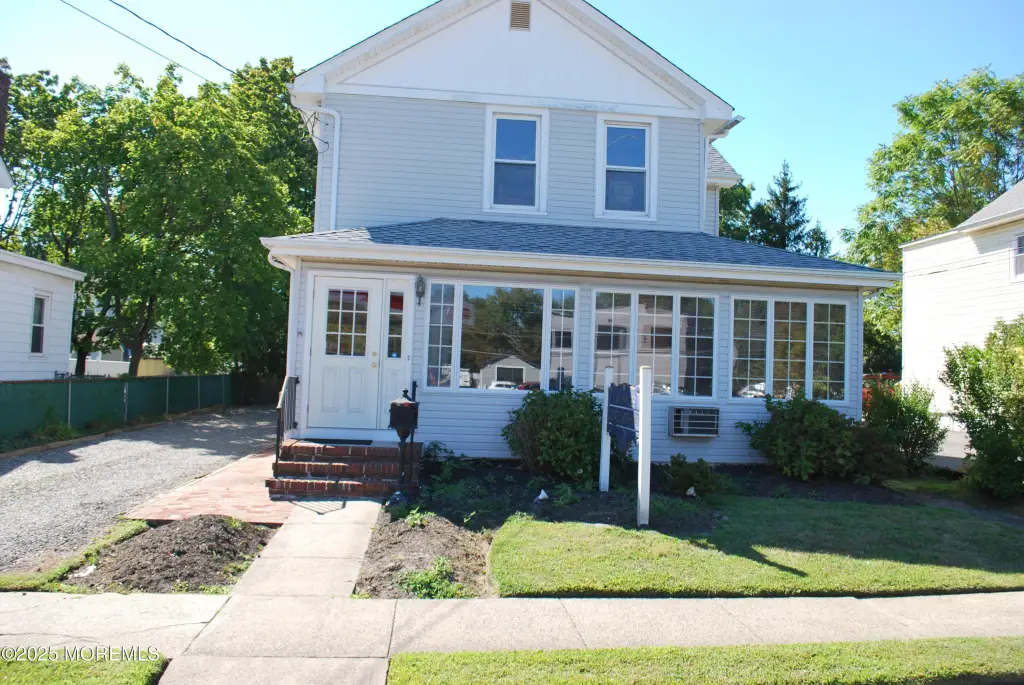
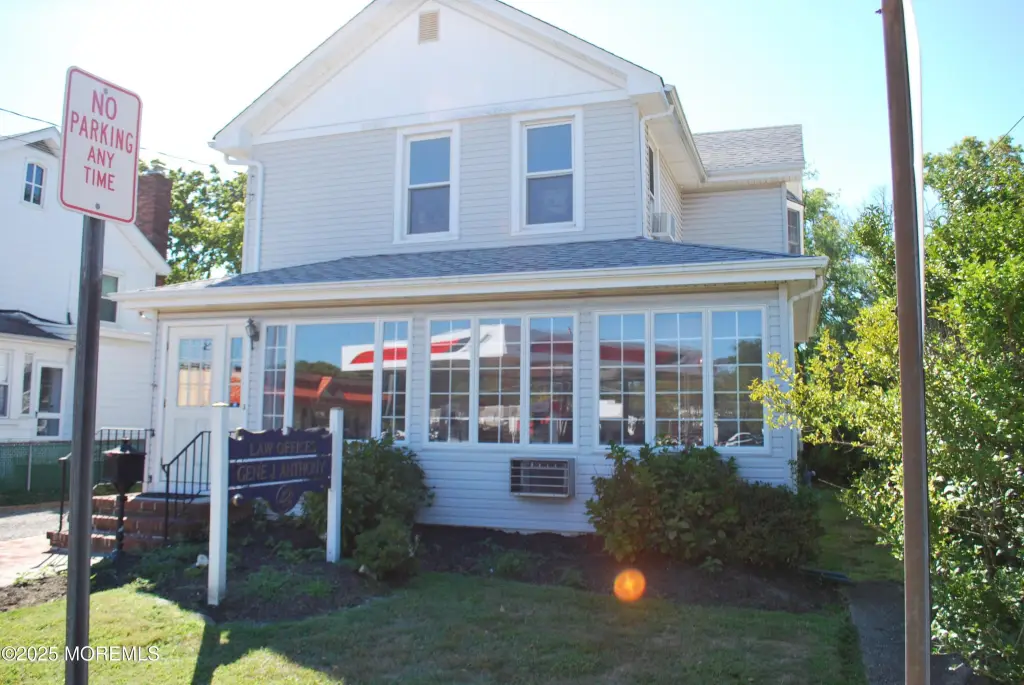
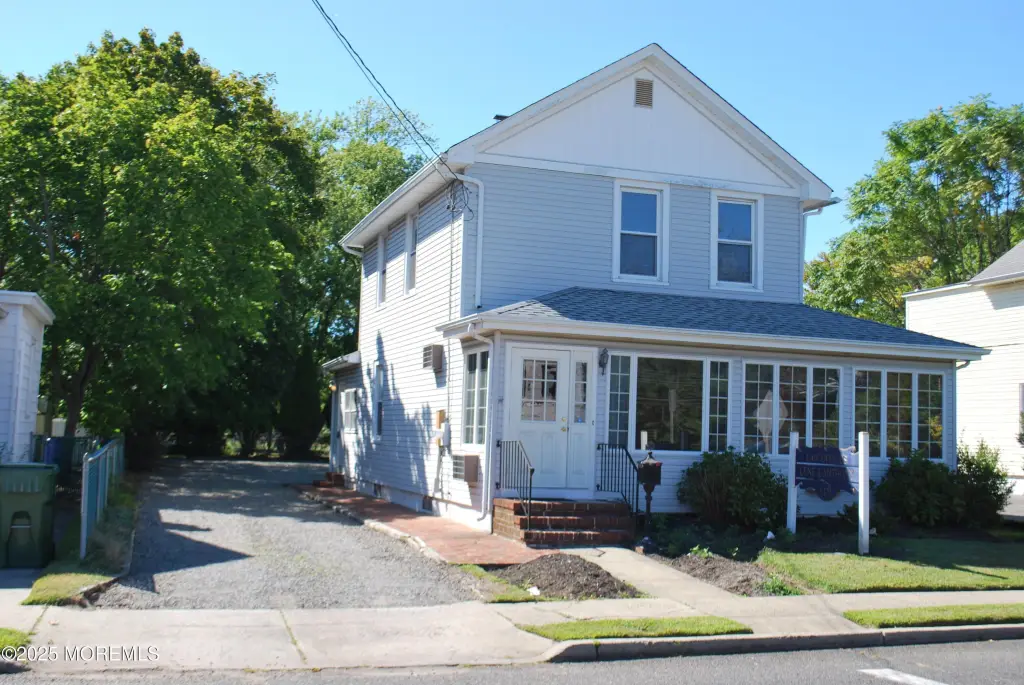
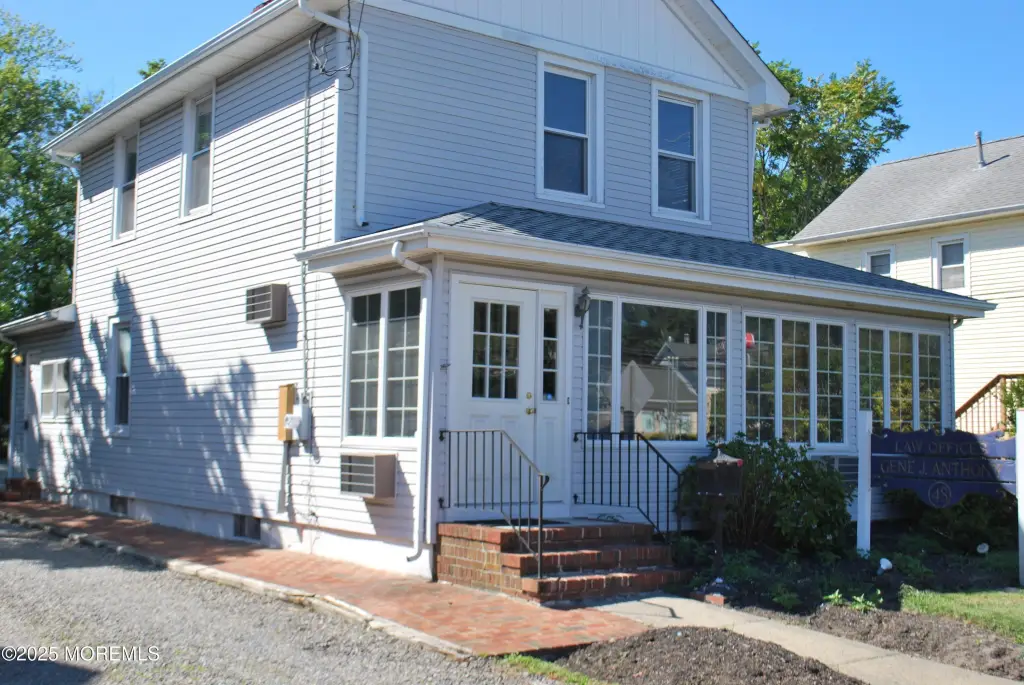
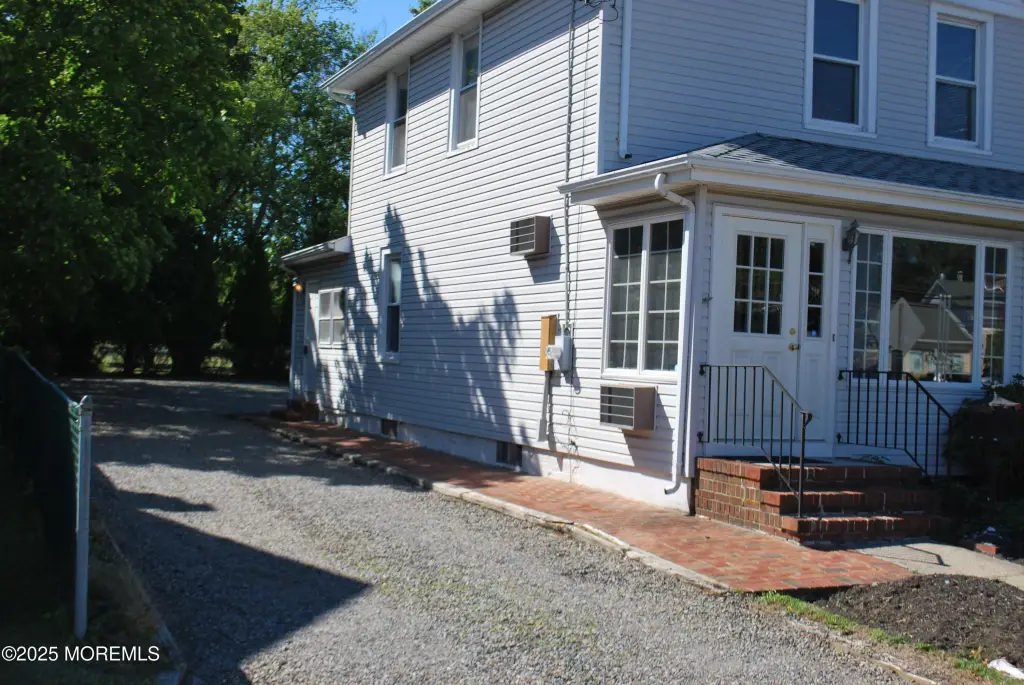
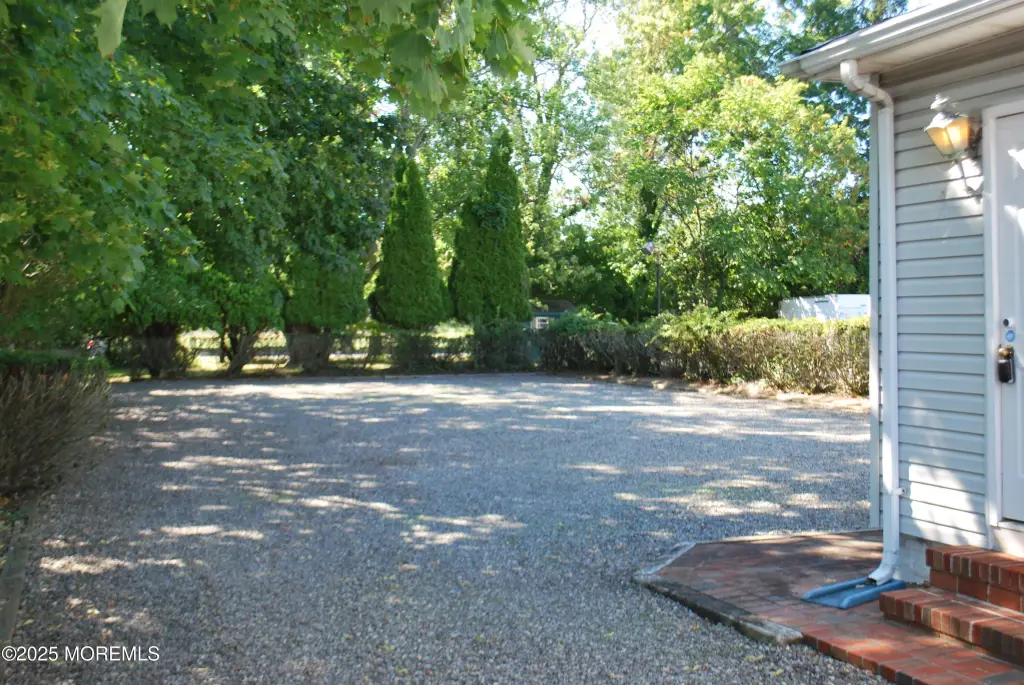
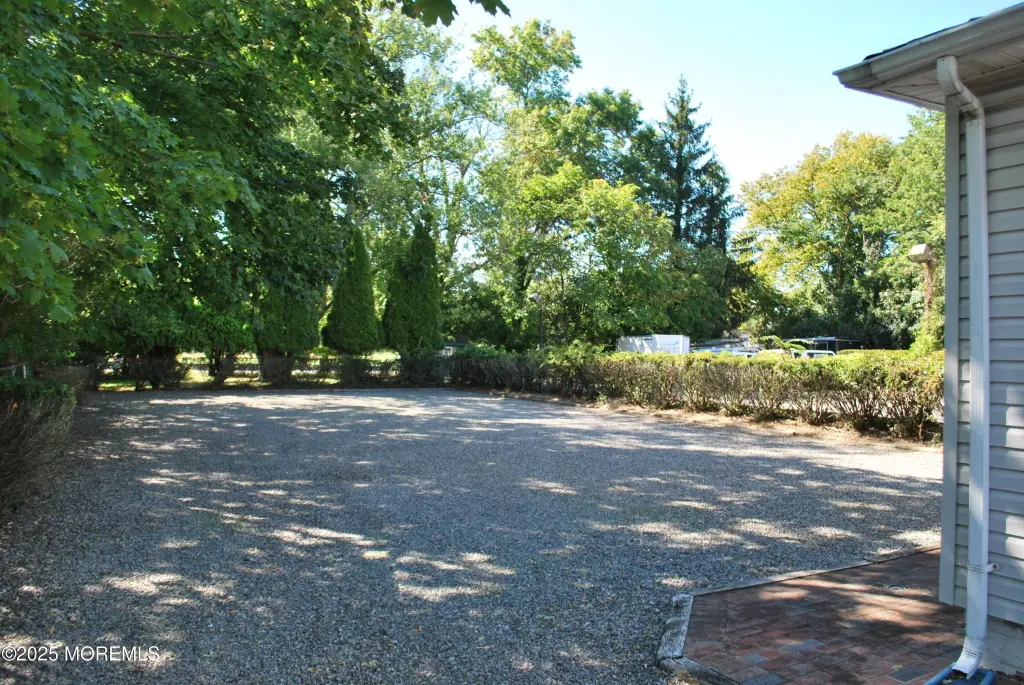
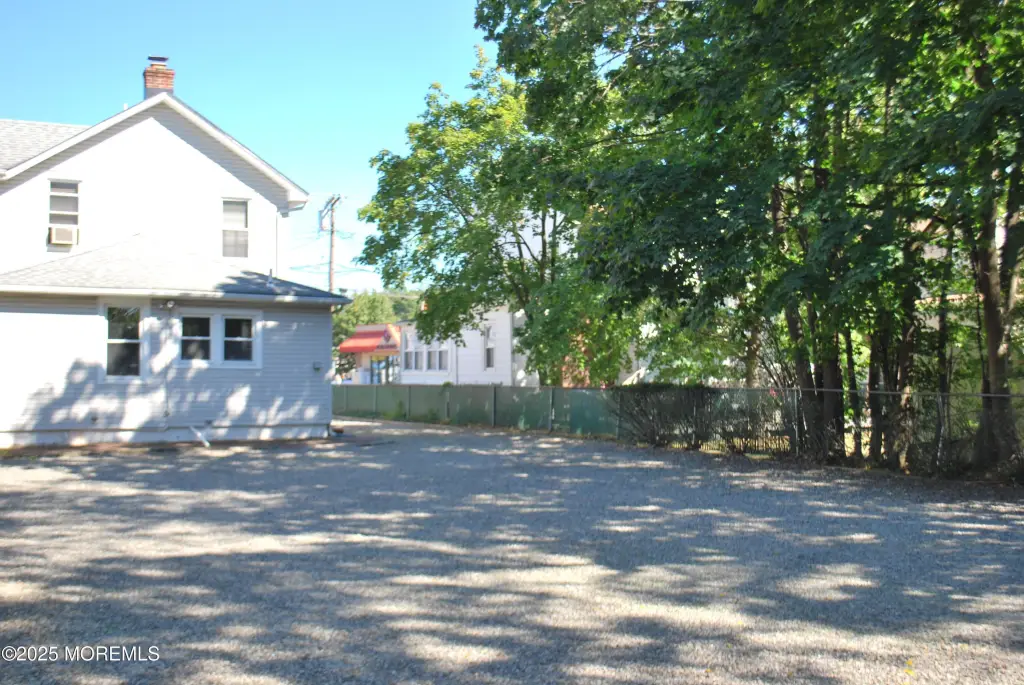
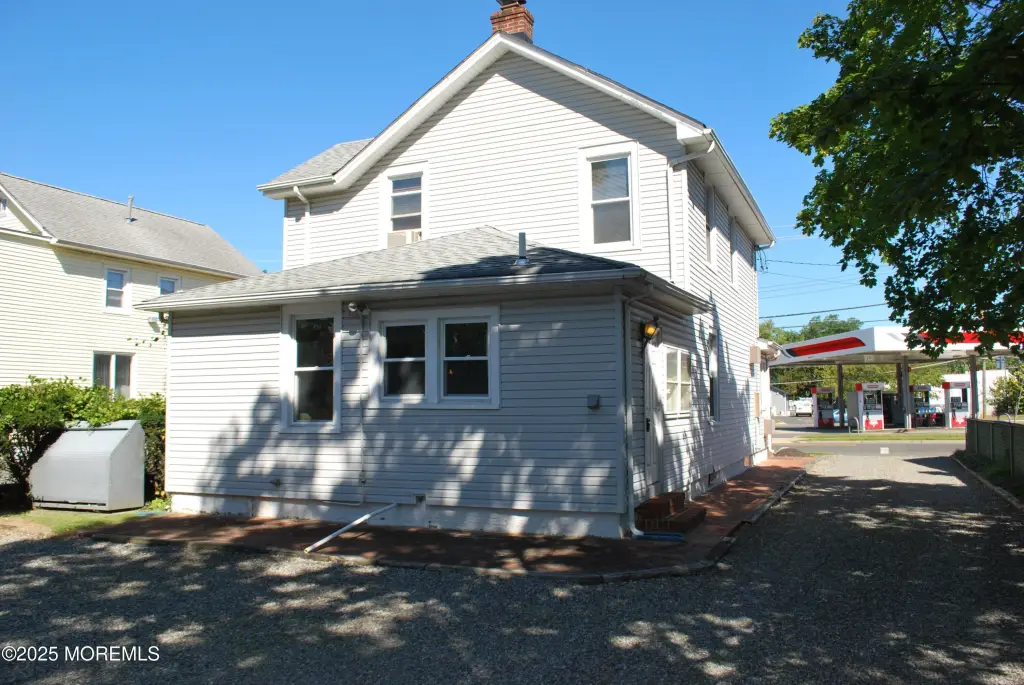
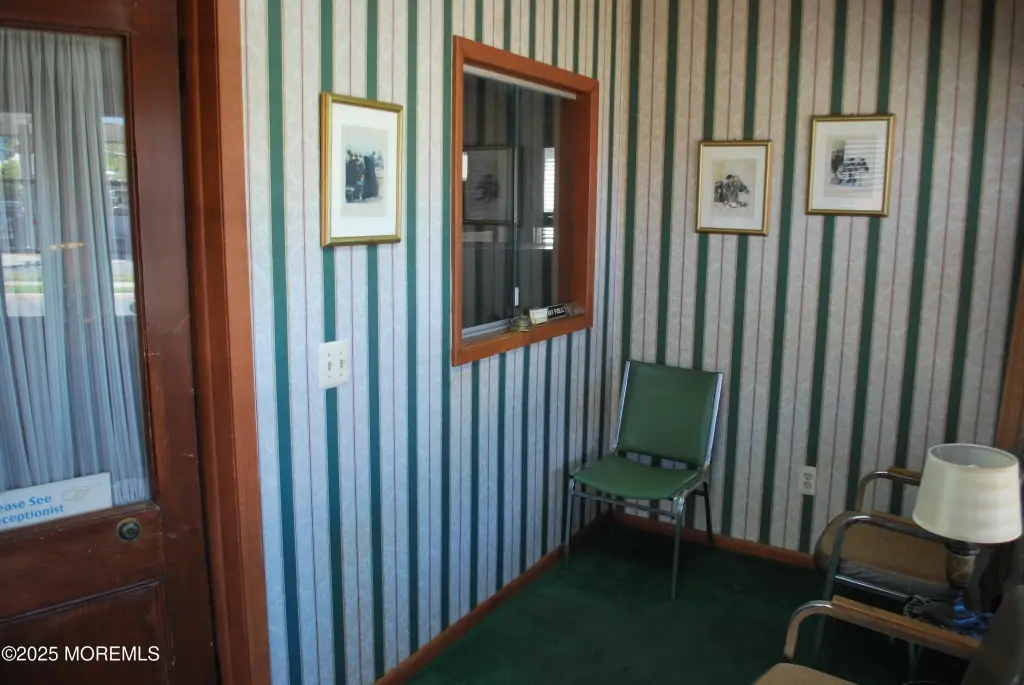
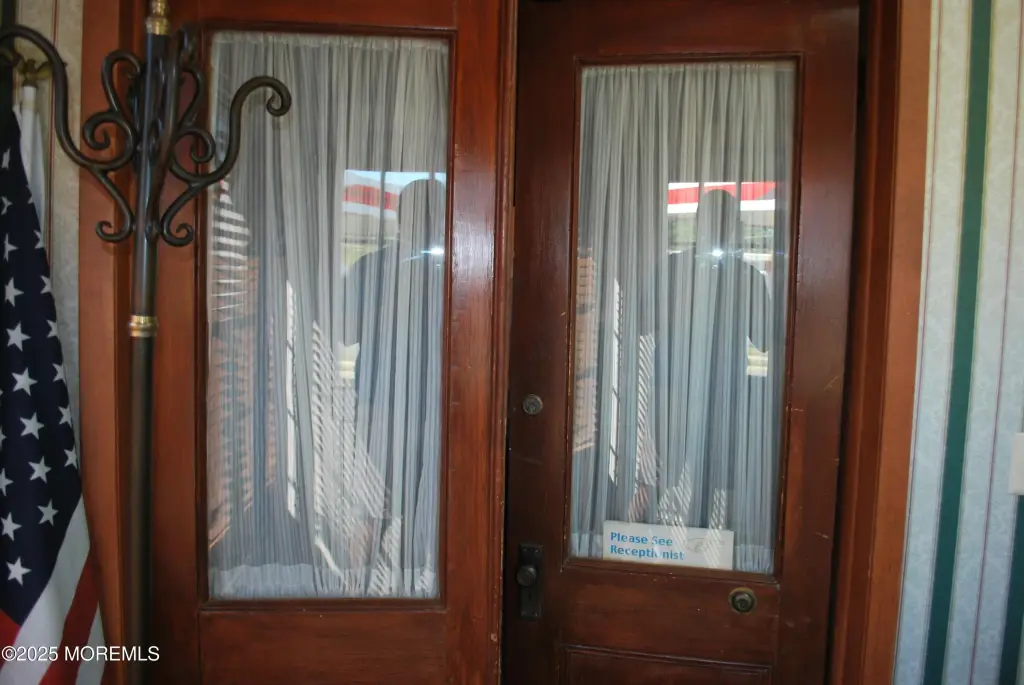
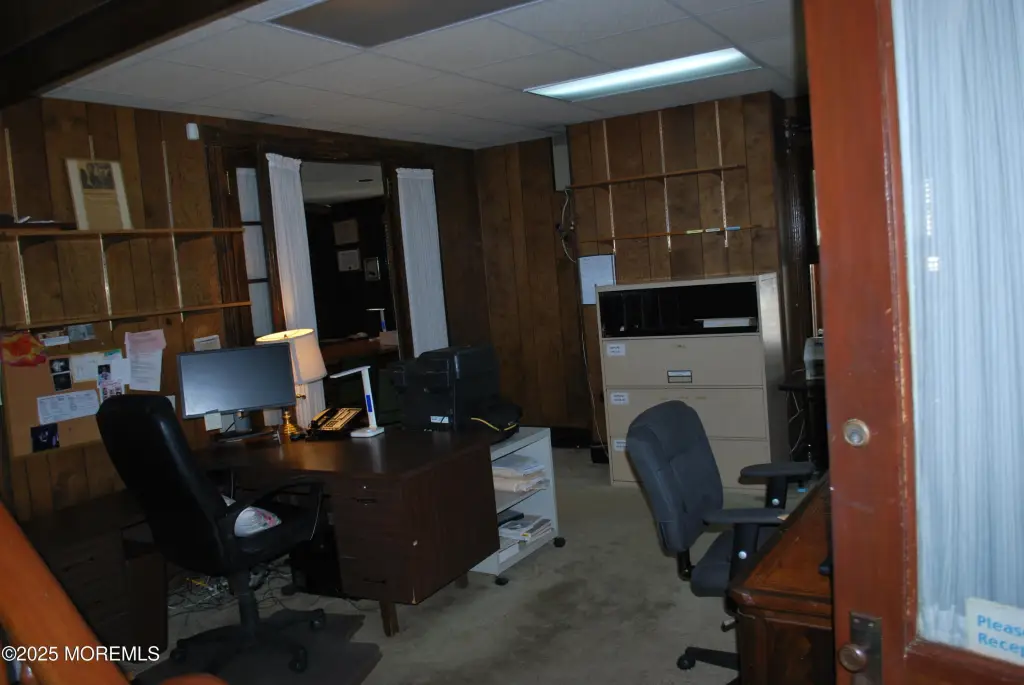
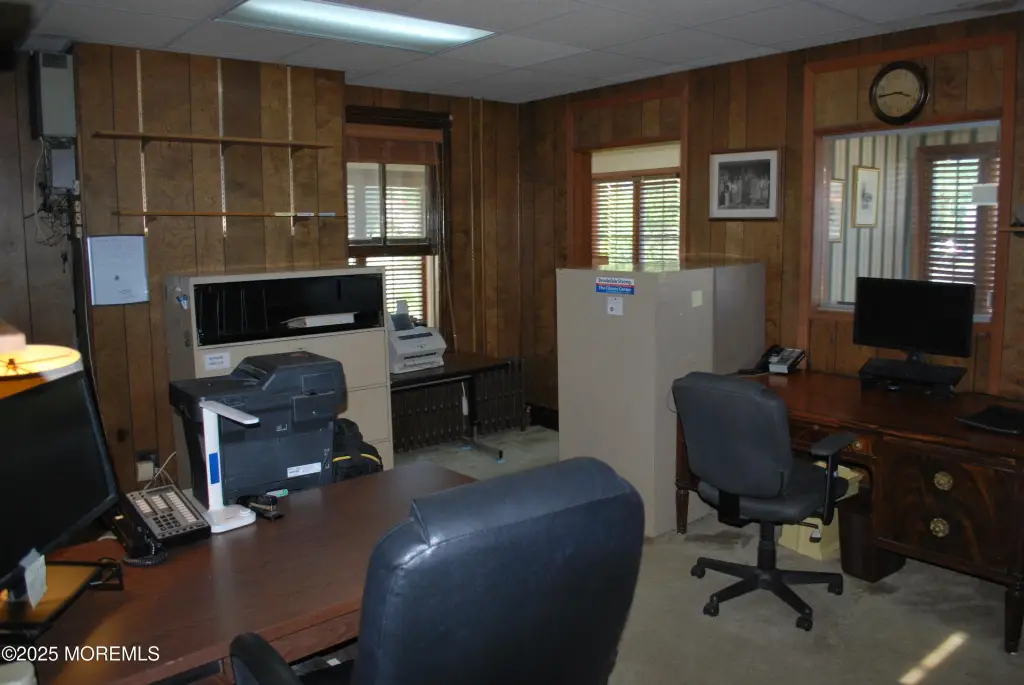
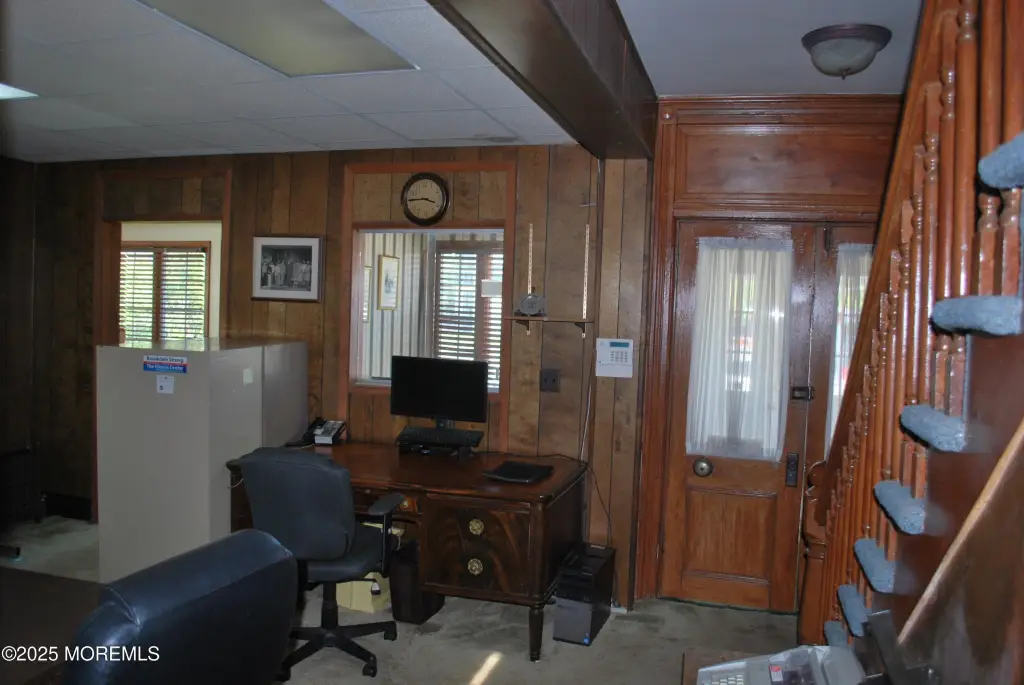
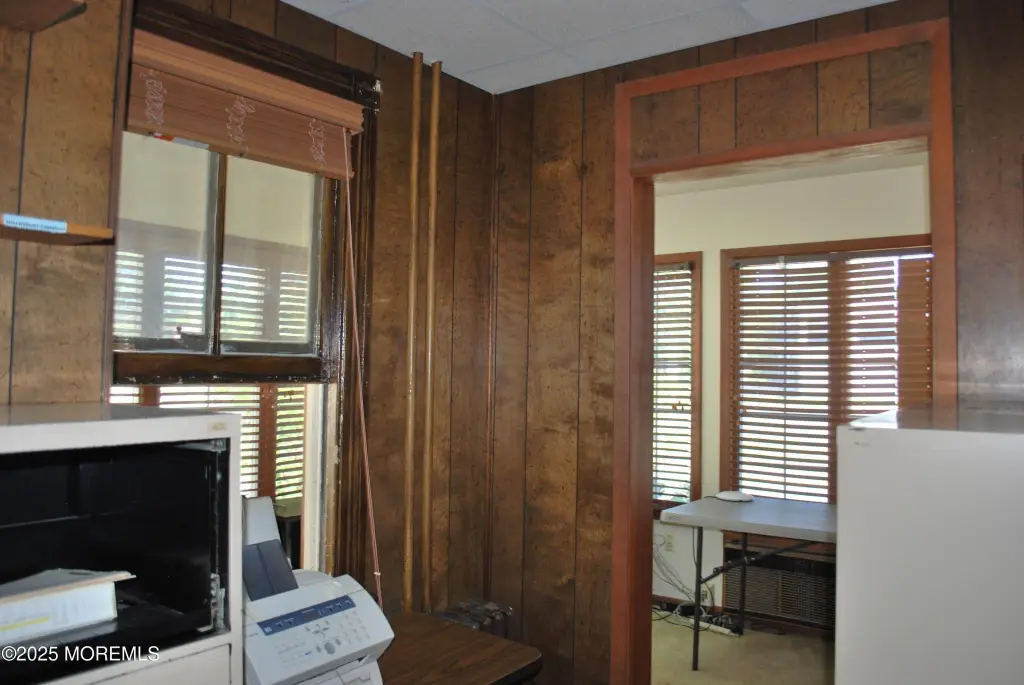
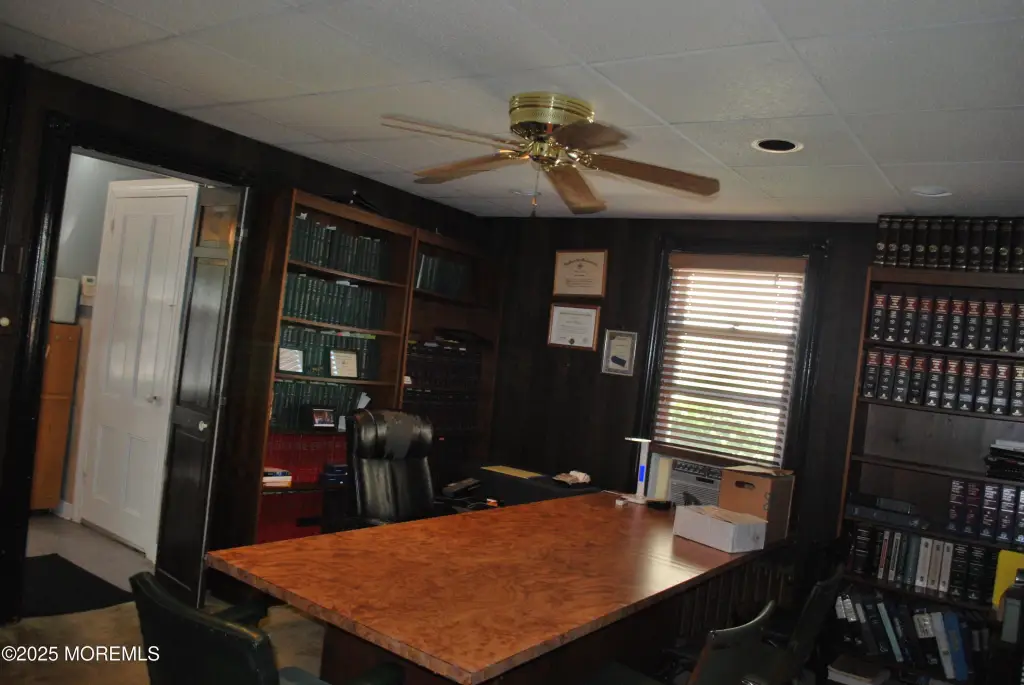
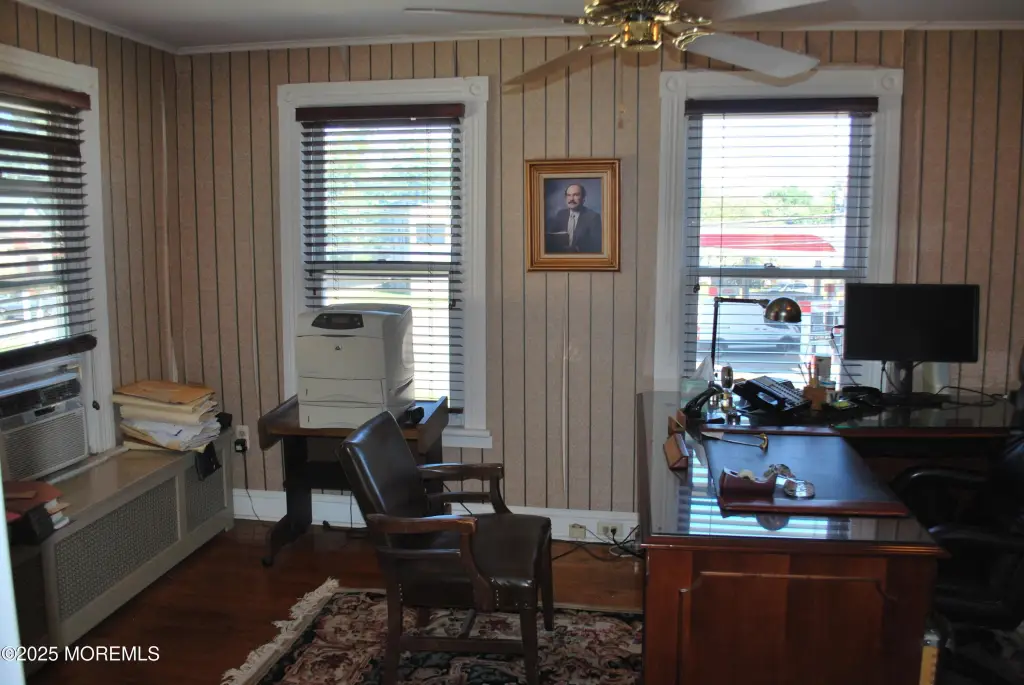
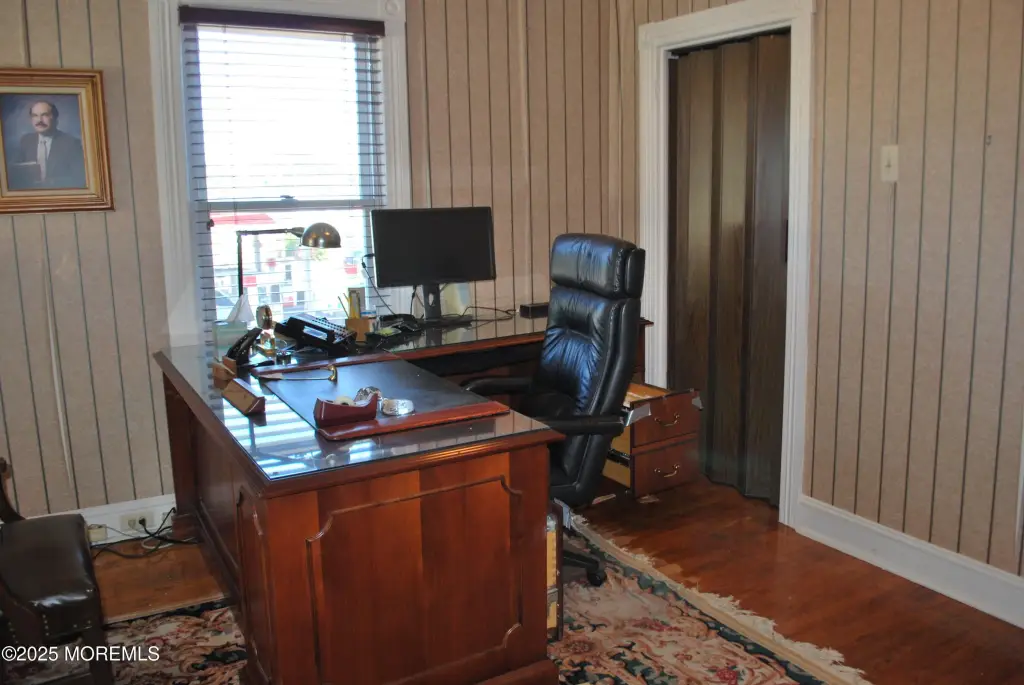
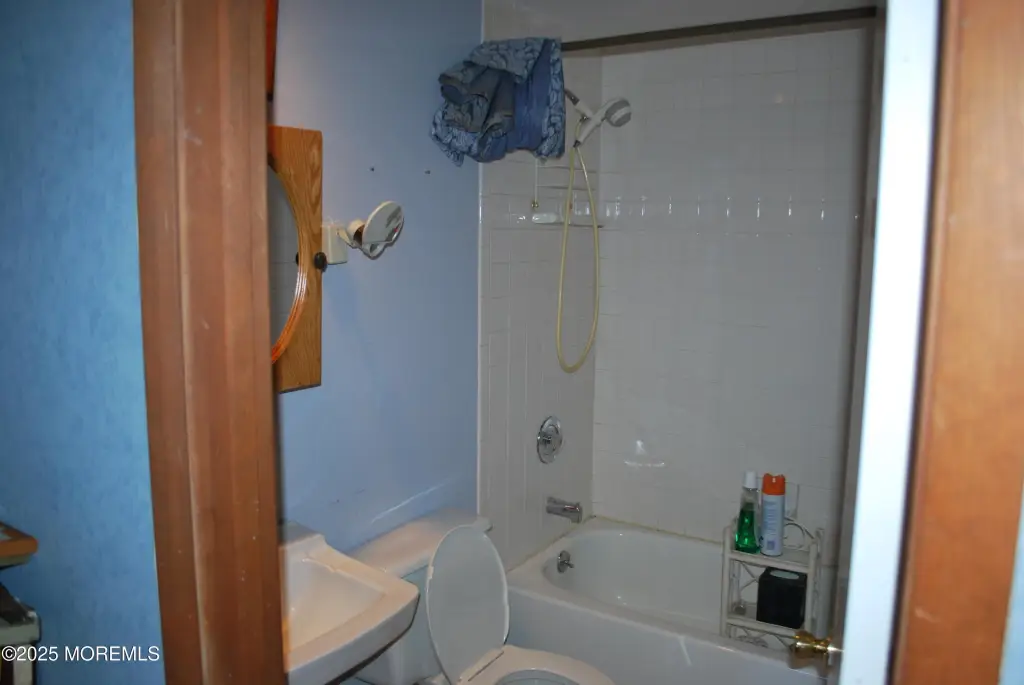
For Sale
$650,000
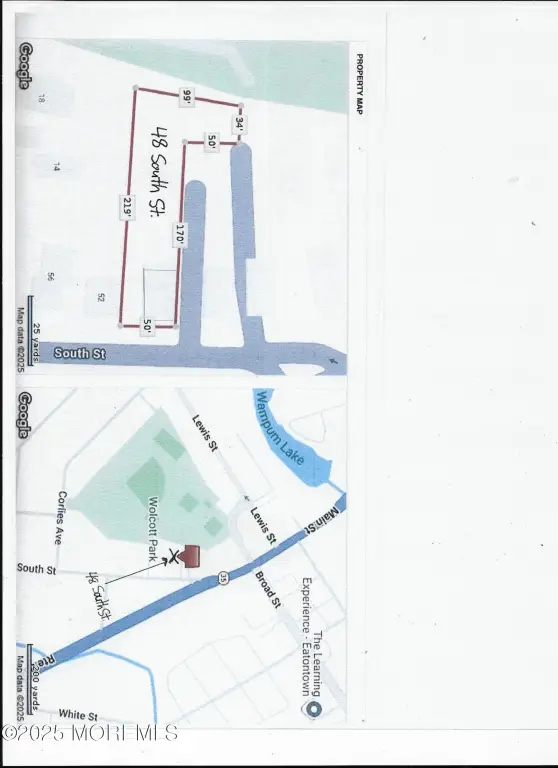
48 South Street, Eatontown, NJ 07724
Commercial Sale, Eatontown, NJ
Property Size1,804 SF
Lot Size0.25 Acres
Price / SF$360.31
Days on Market95
Property Features for 48 South Street
General Information
Property type
Commercial Sale
Property subtype
Other
Zoning description
Office, Retail, Residential, Professional, Multi-Use, Mixed, Live-in Professional
Rooms
Basement
Parking features
Parking Lot
Security features
Security System
Exterior features
Lighting
Basement
Partial
Lot features
Irregular Lot, Level, Sidewalks
Directions
Rt 35 to South St. #48
Standard status
Active
APN
12-00902-0000-00031
Size
1,804 SF
Lot size
0.25 Acres
Additional Details
Property Use
Mixed-Use Commercial
Taxes and HOA fees
Tax Year
2025
Tax Annual Amount
10798
Utilities
Sewer type
Public Sewer
Heating system
Baseboard, Oil
Cooling system
Window Unit(s)
Water source
Public
Building Details
Year built
1910
Floors in Building
2
Roof type
Shingle
Listing Agency:
Keller Williams Realty East Monmouth
Listed By:
John Sherrod
(732) 704-4033
Added: Jul 24
Changed: Oct 25
Last Checked: Oct 26 at 12:06PM
MLS# 22622706
Copyright © 2026 More MLS. All rights reserved. All information provided by the listing agent/broker is deemed reliable but is not guaranteed and should be independently verified.

Ask AI about this property
Review the available facts, identify missing information and prepare questions for the agent.
Investment Insights
Based on property information with market context.
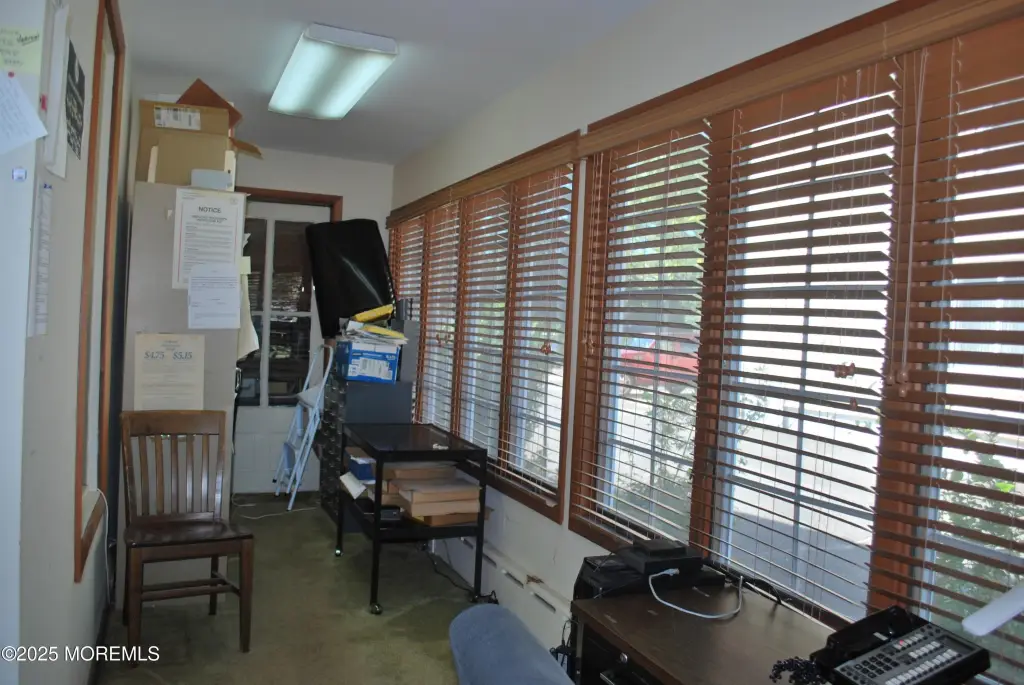
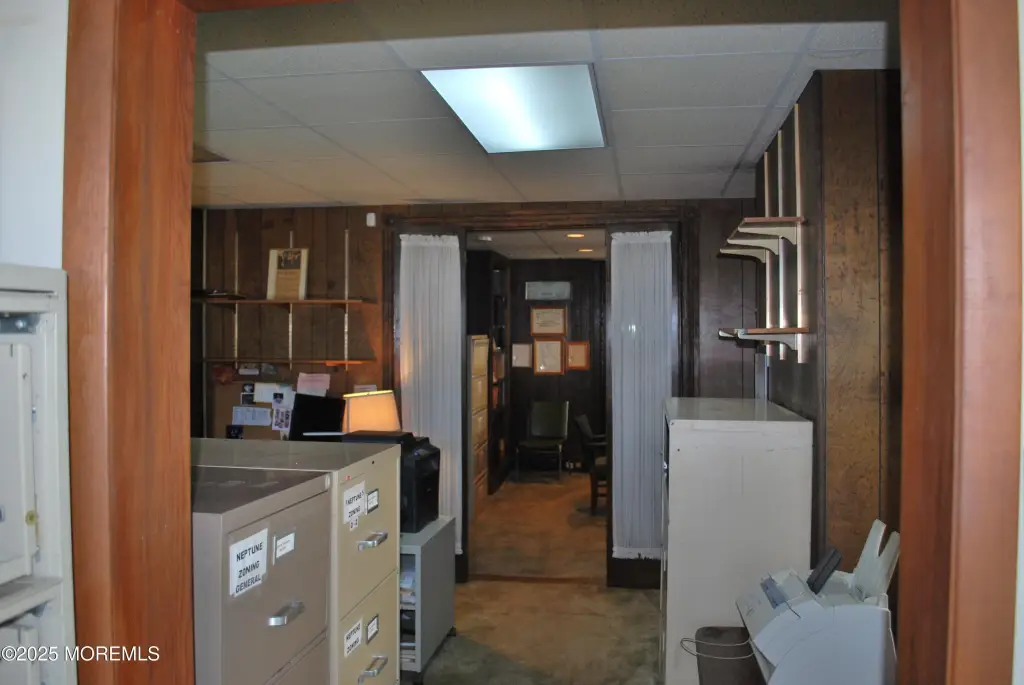
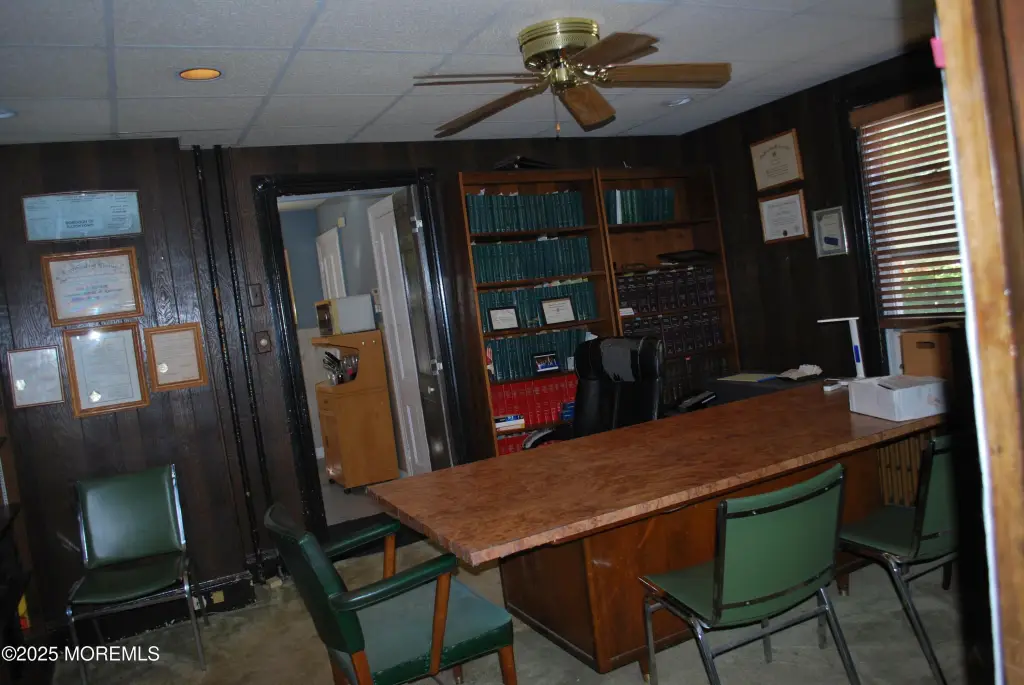
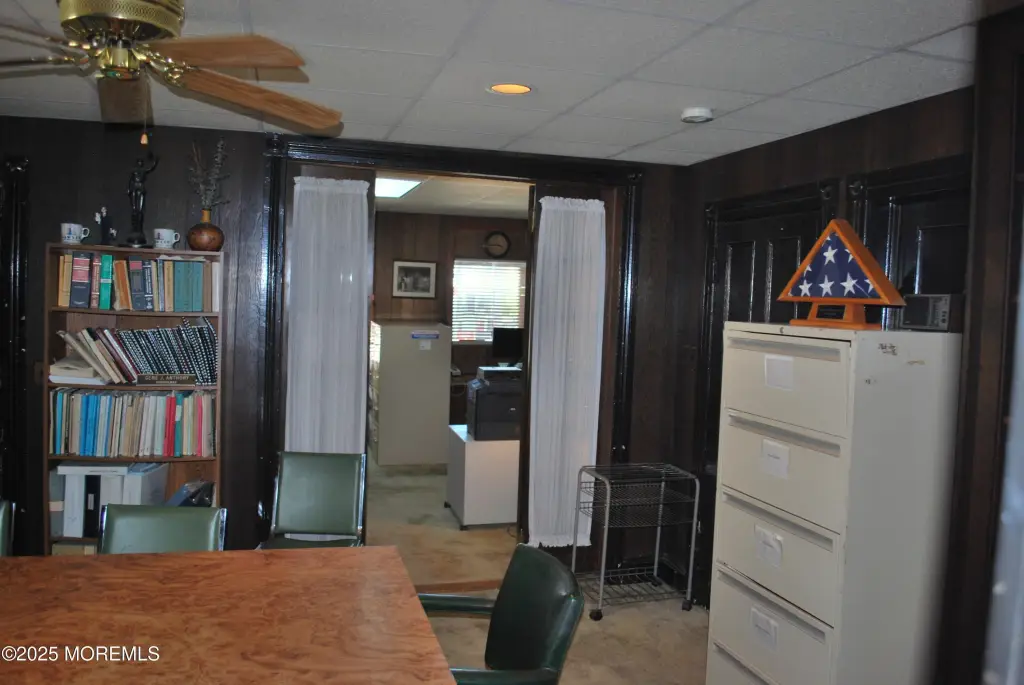
Located at 48 South Street in Eatontown, this mixed-use commercial property contains 1,804 square feet on a 0.25-acre parcel within the B-2 Business Zone. The property includes a basement, parking lot, exterior lighting, shingle roofing, baseboard oil heat, and window-unit cooling. Public water and public sewer serve the site.
The property has exposure from Rt 35 and is positioned near redevelopment activity at Fort Monmouth, including the Netflix Studios construction project, while Monmouth Mall is undergoing major renovations that include housing. The B-2 zone identifies a range of potential commercial uses, including offices, personal services, retail sales, and live-in professional uses; buyers are responsible for confirming permitted uses with the town.
The property has exposure from Rt 35 and is positioned near redevelopment activity at Fort Monmouth, including the Netflix Studios construction project, while Monmouth Mall is undergoing major renovations that include housing. The B-2 zone identifies a range of potential commercial uses, including offices, personal services, retail sales, and live-in professional uses; buyers are responsible for confirming permitted uses with the town.
Key Highlights
- 1,804‑square‑foot mixed‑use commercial property
- 0.25‑acre parcel in Eatontown’s B‑2 Business Zone
- Visibility from Rt 35
Financial Insights
Estimated NOI and Cap Rate
NOI / Yr
$27,601
Cap Rate
4.25%
Suggested Prices Based on Cap Rates
Cap Rate 5%
$552,020
$552.0K
Cap Rate 7%
$394,300
$394.3K
Cap Rate 9%
$306,678
$306.7K
Market Conditions
NOI Build-Up for 1,804 SF
Gross rent
$54.1K $30.00/SF
− Vacancy
−$17.3K −$9.60/SF
EGI
$36.8K $20.40/SF
− OpEx
−$9.2K −$5.10/SF
NOI
$27.6K $15.30/SF
Area
Monmouth County, NJ
Vacancy
32.00%
Lease Rate
$30.00 /SF/Yr
Expense Ratio
25.00%
Simulate Cap Rate and NOI
Suggested Prices Based on Cap Rates
Cap Rate 5%
$552,020
Cap Rate 7%
$394,300
Cap Rate 9%
$306,678
Alternative Uses
Best Use
Office B
$394.3K
$345.0K – $460.0K
NOI $27,601 @ 7.0% cap · market cap 4.25%
Second Best
Mixed Use
$347.9K
$304.4K – $405.9K
NOI $24,354 @ 7.0% cap · market cap 3.75%
Theoretical Best
Office A
$471.1K
$412.2K – $549.6K
NOI $32,974 @ 7.0% cap · market cap 5.07%
Zoning and permitted uses should be independently verified with authorities.
How Realmo checks its estimates
Property Analytics
Unlock full access to Insights
Subscribe to Realmo Intelligence
Open Analytics
Current Use
Location Intelligence
Trade Area within ½ mile
703
Businesses Nearby
Explore this area
Business Placement
Demographics for 07724, NJ
23,494
Population
10,424
Households
2.3
Avg Household Size
44
Median Age
45%
College-Educated
92%
High-School Grad
12.1 sq mi
ZIP Area
1,942
Density / Sq Mi
$99,170
Median Household Income
$53,234
Median Earnings
$1,640
Median Rent
$487,300
Median Home Value
Check the figures for this property
Cap Rate, Value Estimation, Potential NOI and more
View Realmo Analytics
Market
Vacancy Rate% for Office in Northeast region



Frequently Asked Questions
What type of property is this?
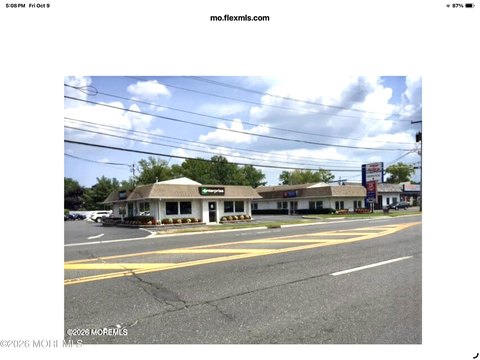
Mixed-use property - Mixed-use commercial building in Eatontown’s B-2 Business Zone with parking, public utilities, and visibility from Rt 35.
Where is this mixed-use property located?
The property is located at 48 South Street Eatontown, NJ.
What is the asking price?
The asking price for this property is $650,000.
What are key features of this property?
This property features: 1,804‑square‑foot mixed‑use commercial property; 0.25‑acre parcel in Eatontown’s B‑2 Business Zone; Visibility from Rt 35



