Turnkey Four-Family Rebuilt in
For Sale
$1,375,000
468 Salem St, Malden, MA 02148
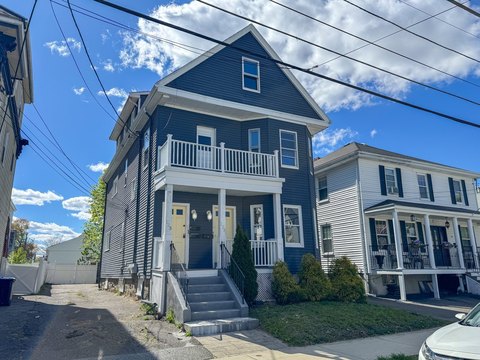
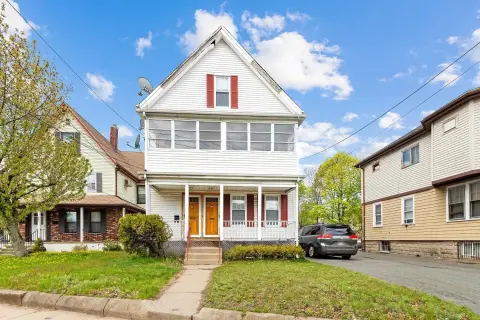
A modernized quadplex with updated finishes and systems, designed for low-maintenance ownership and dependable rental income.
Property Size2,671 SF
Price / SF$514.79
Days on Market142
Property Features for 468 Salem St
General Information
Standard status
Active
Size
2,671 SF
Property subtype
Multi-Family
Zoning
ResA
Additional Details
Business Included
Yes
Multifamily Units
4
Taxes and HOA fees
Annual Taxes
$10,462
Building Details
Building Size
2,671 SF
Year Built
1930
Year Renovated
2016
Stories
4
Listing Agency:
United Brokers
Listed By:
Mission Impossible Team
(781) 629-2258
Source:
Churchillprop
Added: Jun 1
Changed: Oct 6
Last Checked: Oct 19 at 5:12AM
Displayed information is deemed reliable but is not guaranteed and should be independently verified. All listing content including descriptions, pricing, images are the copyrighted material of United Brokers

Ask AI about this property
Review the available facts, identify missing information and prepare questions for the agent.
Investment Insights
Based on property information with market context.
This turnkey four-family property was rebuilt from the studs in 2016, offering modern systems and updated finishes throughout. The result is a newer-construction multifamily asset with a low-maintenance ownership approach, appealing to both investors focused on rental stability and owner-occupants looking to offset living costs with in-place income.
Located on Salem Street, the property benefits from strong commuter access with an MBTA bus stop directly at the doorstep. It also provides convenient access to the Malden Center and Oak Grove Orange Line stations for seamless trips into Boston. The area is well connected to Route 60, Route 1, I-93, and downtown Boston, supporting ongoing tenant demand.
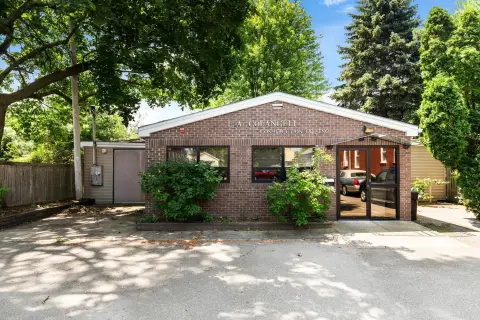
With street parking and minimal landscaping, the day-to-day upkeep is streamlined compared to more maintenance-intensive multifamily configurations. For buyers seeking a relatively recent rebuild in a high-demand rental market, this is an attractive opportunity to combine current-generation building improvements with transit-connected location advantages.
Located on Salem Street, the property benefits from strong commuter access with an MBTA bus stop directly at the doorstep. It also provides convenient access to the Malden Center and Oak Grove Orange Line stations for seamless trips into Boston. The area is well connected to Route 60, Route 1, I-93, and downtown Boston, supporting ongoing tenant demand.
With street parking and minimal landscaping, the day-to-day upkeep is streamlined compared to more maintenance-intensive multifamily configurations. For buyers seeking a relatively recent rebuild in a high-demand rental market, this is an attractive opportunity to combine current-generation building improvements with transit-connected location advantages.
Key Highlights
- 4‑family quadplex rebuilt from the studs in 2016 with updated finishes and modern systems
- Year built: 1930; 2016 rebuild improves the property with modernized features throughout
- Located on Salem St with an MBTA bus stop directly at the doorstep
Financial Insights
Estimated NOI and Cap Rate
NOI / Yr
$56,519
Cap Rate
4.11%
Suggested Prices Based on Cap Rates
Cap Rate 5%
$1,130,380
$1.1M
Cap Rate 7%
$807,414
$807.4K
Cap Rate 9%
$627,989
$628.0K
Market Conditions
NOI Build-Up for 2,671 SF
Gross rent
$84.9K $31.80/SF
− Vacancy
−$4.2K −$1.57/SF
EGI
$80.7K $30.23/SF
− OpEx
−$24.2K −$9.07/SF
NOI
$56.5K $21.16/SF
Area
Middlesex County, MA
Vacancy
4.94%
Lease Rate
$31.80 /SF/Yr
Expense Ratio
30.00%
Simulate Cap Rate and NOI
Suggested Prices Based on Cap Rates
Cap Rate 5%
$1,130,380
Cap Rate 7%
$807,414
Cap Rate 9%
$627,989
Alternative Uses
Best Use
Multifamily LT 5
$807.4K
$706.5K – $942.0K
NOI $56,519 @ 7.0% cap · market cap 4.11%
Second Best
Apartment 5plus
$759.2K
$664.3K – $885.7K
NOI $53,144 @ 7.0% cap · market cap 3.87%
Theoretical Best
Office A
$1.58M
$1.38M – $1.84M
NOI $110,686 @ 7.0% cap · market cap 8.05%
Zoning and permitted uses should be independently verified with authorities.
How Realmo checks its estimates
Property Analytics
Unlock full access to Insights
Subscribe to Realmo Intelligence
Open Analytics
Lease Details
4
Residential units
Turnkey business
Opportunity
Location Intelligence
Trade Area within ½ mile
1,034
Businesses Nearby
Explore this area
Business Placement
Demographics for 02148, MA
66,274
Population
28,043
Households
2.4
Avg Household Size
36
Median Age
45%
College-Educated
87%
High-School Grad
5.0 sq mi
ZIP Area
13,255
Density / Sq Mi
$95,298
Median Household Income
$56,077
Median Earnings
$2,066
Median Rent
$607,500
Median Home Value
Check the figures for this property
Cap Rate, Value Estimation, Potential NOI and more
View Realmo Analytics
Market
Vacancy Rate% for Multifamily in Northeast region







Frequently Asked Questions
What type of property is this?
Quadplex - A modernized quadplex with updated finishes and systems, designed for low-maintenance ownership and dependable rental income.
Where is this quadplex located?
The property is located at 468 Salem St Malden, MA.
What is the asking price?
The asking price for this property is $1,375,000.
What are key features of this property?
This property features: 4‑family quadplex rebuilt from the studs in 2016 with updated finishes and modern systems; Year built: 1930; 2016 rebuild improves the property with modernized features throughout; Located on Salem St with an MBTA bus stop directly at the doorstep


