DC Income-Producing Multifamily
For Sale
$550,000
46 FORRESTER STREET SW, Washington, DC 20032
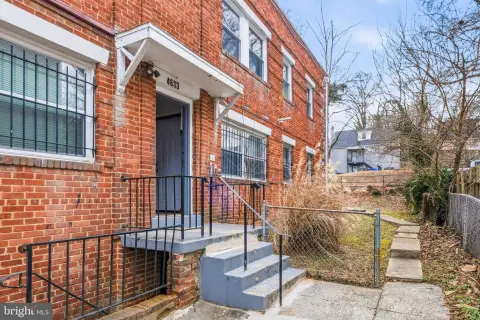
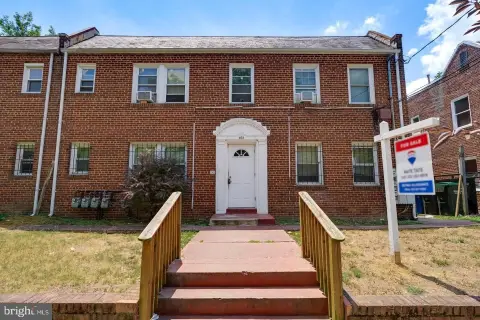
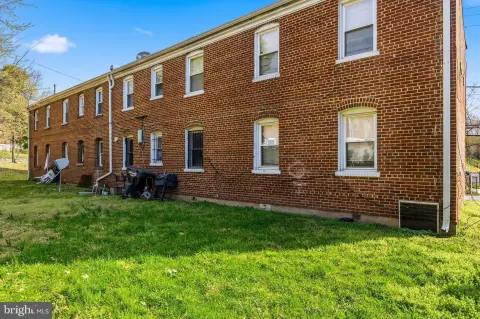
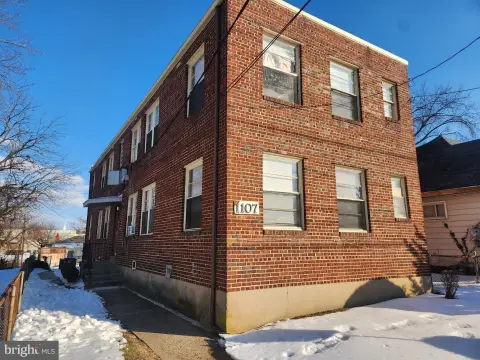
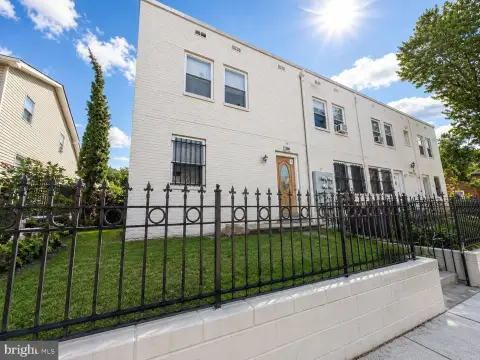
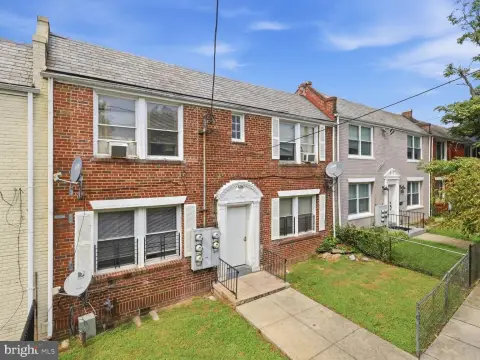
Turnkey multifamily property with income potential in Washington, DC.
Property Size2,556 SF
Price / SF$215.18
Days on Market197
Property Features for 46 FORRESTER STREET SW
General Information
Standard status
Active
Size
2,556 SF
Property subtype
Quadruplex
Taxes and HOA fees
Annual Taxes
$5,033
Building Details
Building Size
2,556 SF
Year Built
1943
Listing Agency:
RE/MAX Allegiance
Listed By:
Nathaniel Tate · License #SP96896
(202) 262-8819
Source:
Kerishull
Added: Apr 2
Changed: Oct 3
Last Checked: Oct 15 at 7:04AM
Displayed information is deemed reliable but is not guaranteed and should be independently verified. All listing content including descriptions, pricing, images are the copyrighted material of RE/MAX Allegiance

Ask AI about this property
Review the available facts, identify missing information and prepare questions for the agent.
Investment Insights
Based on property information with market context.
This income-producing property in Washington, DC, features 4 bedrooms and 2 baths configured across multiple units. One unit is currently generating $1,451 per month, with total rental potential approaching $6,000 per month. The property is suitable for investors and owner-occupants, offering a house-hacking opportunity to live in one unit while renting out the others. The location provides convenient access to major commuter routes and public transportation, including the Washington Metro, facilitating commutes to downtown DC, Navy Yard, and Capitol Hill. Residents can enjoy proximity to dining, shopping, and entertainment options at The Wharf, as well as other neighborhood amenities in Southwest DC. FHA and VA buyers are welcome.
Key Highlights
- High income potential with existing $1,451/month income and total potential approaching $6,000/month.
- House‑hacking opportunity: live in one unit and rent out the others to cover mortgage costs.
- Versatile property with 4 bedrooms and 2 baths configured across multiple units, suitable for investors or owner‑occupants.
Financial Insights
Estimated NOI and Cap Rate
NOI / Yr
$45,796
Cap Rate
8.33%
Suggested Prices Based on Cap Rates
Cap Rate 5%
$915,920
$915.9K
Cap Rate 7%
$654,229
$654.2K
Cap Rate 9%
$508,844
$508.8K
Market Conditions
NOI Build-Up for 2,556 SF
Gross rent
$69.0K $27.00/SF
− Vacancy
−$3.6K −$1.40/SF
EGI
$65.4K $25.60/SF
− OpEx
−$19.6K −$7.68/SF
NOI
$45.8K $17.92/SF
Area
Washington, DC
Vacancy
5.20%
Lease Rate
$27.00 /SF/Yr
Expense Ratio
30.00%
Simulate Cap Rate and NOI
Suggested Prices Based on Cap Rates
Cap Rate 5%
$915,920
Cap Rate 7%
$654,229
Cap Rate 9%
$508,844
Alternative Uses
Best Use
Multifamily LT 5
$654.2K
$572.5K – $763.3K
NOI $45,796 @ 7.0% cap · market cap 8.33%
Second Best
Apartment 5plus
$606.7K
$530.9K – $707.8K
NOI $42,469 @ 7.0% cap · market cap 7.72%
Theoretical Best
Office A
$1.31M
$1.15M – $1.53M
NOI $92,031 @ 7.0% cap · market cap 16.73%
Zoning and permitted uses should be independently verified with authorities.
How Realmo checks its estimates
Property Analytics
Unlock full access to Insights
Subscribe to Realmo Intelligence
Open Analytics
Current Use
Location Intelligence
Trade Area within ½ mile
723
Businesses Nearby
Explore this area
Business Placement
Demographics for 20032, DC
38,904
Population
19,708
Households
2
Avg Household Size
33
Median Age
23%
College-Educated
88%
High-School Grad
5.2 sq mi
ZIP Area
7,482
Density / Sq Mi
$48,146
Median Household Income
$44,487
Median Earnings
$1,285
Median Rent
$391,400
Median Home Value
Check the figures for this property
Cap Rate, Value Estimation, Potential NOI and more
View Realmo Analytics
Market
Vacancy Rate% for Multifamily in South region






Frequently Asked Questions
What type of property is this?
Quadplex - Turnkey multifamily property with income potential in Washington, DC.
Where is this quadplex located?
The property is located at 46 FORRESTER STREET SW Washington, DC.
What is the asking price?
The asking price for this property is $550,000.
What are key features of this property?
This property features: High income potential with existing $1,451/month income and total potential approaching $6,000/month.; House‑hacking opportunity: live in one unit and rent out the others to cover mortgage costs.; Versatile property with 4 bedrooms and 2 baths configured across multiple units, suitable for investors or owner‑occupants.


