8-Unit Apartment Property with
For Sale
$2,000,000
4554 Date Ave, La Mesa, CA 91941
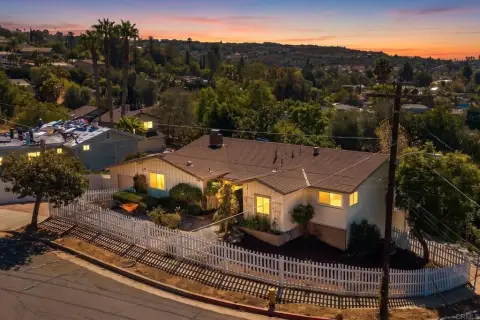
Two structures provide rental and owner-occupant configurations on a double lot one block from La Mesa Village.
Property Size4,943 SF
Price / SF$350.20
Days on Market48
Property Features for 4554 Date Ave
General Information
Standard status
Active
Size
4,943 SF
Total Parking Spaces
10
Property subtype
Investment
Site & Location
Road Access
Yes
Public Transit
Yes
Units
Unit Mix
1 x 3BR/2BA, 2 x 2BR/1BA
Multifamily Units
8
Amenities
rooftop solar system
fruit orchard
Building Details
Building Size
4,943 SF
Year Built
1909
Units
4
Construction
Transitional Victorian
Listed By:
William Scheibner
(619) 813-2415
Source:
Elliman
Added: Aug 28
Changed: Oct 14
Last Checked: Oct 12 at 8:51PM
Displayed information is deemed reliable but is not guaranteed and should be independently verified. All listing content including descriptions, pricing, images are the copyrighted material of William Scheibner
Investment Insights
Based on property information with market context.
This 8-unit apartment property combines a front structure with five rental units and a separate rear duplex. The front building also includes a 3-bedroom, 2-bath owner’s unit, while the rental units contain six bedrooms in total. The duplex at 8208-12 Pasadena Ave offers two 2-bedroom/1-bath units. Combined habitable space is approximately 5,711 square feet.
The property was built in 1909 and includes 10 parking spaces: four garage spaces, four covered carport spaces, including an RV carport, and two open-air spaces. The owner’s unit has an updated kitchen with new cabinetry, oak interior doors, and ceramic tile flooring. An owned 3.0 kW rooftop solar system serves the property, which also features mature landscaping and a fruit orchard.
Located one block from La Mesa Village, the property is within one-half mile of multiple bus lines and the Orange Trolley Line. Walk Score is 94, Bike Score is 30, and Transit Score is 50.
The property was built in 1909 and includes 10 parking spaces: four garage spaces, four covered carport spaces, including an RV carport, and two open-air spaces. The owner’s unit has an updated kitchen with new cabinetry, oak interior doors, and ceramic tile flooring. An owned 3.0 kW rooftop solar system serves the property, which also features mature landscaping and a fruit orchard.
Located one block from La Mesa Village, the property is within one-half mile of multiple bus lines and the Orange Trolley Line. Walk Score is 94, Bike Score is 30, and Transit Score is 50.
Key Highlights
- Eight‑unit configuration with five rental units, an owner’s unit, and a separate rear duplex
- Approximately 5,711 sq ft of combined habitable space
- Front structure includes a 3‑bedroom, 2‑bath owner’s unit and six bedrooms across the rental units
Financial Insights
Estimated NOI and Cap Rate
NOI / Yr
$102,325
Cap Rate
5.12%
Suggested Prices Based on Cap Rates
Cap Rate 5%
$2,046,500
$2.0M
Cap Rate 7%
$1,461,786
$1.5M
Cap Rate 9%
$1,136,944
$1.1M
Market Conditions
NOI Build-Up for 5,711 SF
Gross rent
$154.2K $27.00/SF
− Vacancy
−$8.0K −$1.40/SF
EGI
$146.2K $25.60/SF
− OpEx
−$43.9K −$7.68/SF
NOI
$102.3K $17.92/SF
Area
San Diego County, CA
Vacancy
5.20%
Lease Rate
$27.00 /SF/Yr
Expense Ratio
30.00%
Simulate Cap Rate and NOI
Suggested Prices Based on Cap Rates
Cap Rate 5%
$2,046,500
Cap Rate 7%
$1,461,786
Cap Rate 9%
$1,136,944
Alternative Uses
Best Use
Multifamily LT 5
$1.46M
$1.28M – $1.71M
NOI $102,325 @ 7.0% cap · market cap 5.12%
Second Best
Apartment 5plus
$1.36M
$1.19M – $1.58M
NOI $94,891 @ 7.0% cap · market cap 4.74%
Theoretical Best
Office A
$2.62M
$2.29M – $3.05M
NOI $183,161 @ 7.0% cap · market cap 9.16%
Zoning and permitted uses should be independently verified with authorities.
How Realmo checks its estimates
Property Analytics
Unlock full access to Insights
Subscribe to Realmo Intelligence
Open Analytics
Current Use
Lease Details
8
Residential units
Yes
Paved road access
Location Intelligence
Trade Area within ½ mile
2,219
Businesses Nearby
Explore this area
Business Placement
Demographics for 91941, CA
33,895
Population
13,250
Households
2.6
Avg Household Size
41
Median Age
46%
College-Educated
95%
High-School Grad
8.2 sq mi
ZIP Area
4,134
Density / Sq Mi
$111,607
Median Household Income
$53,995
Median Earnings
$2,067
Median Rent
$884,800
Median Home Value
Check the figures for this property
Cap Rate, Value Estimation, Potential NOI and more
View Realmo Analytics
Market
Vacancy Rate% for Multifamily in West region

Questions? Ask Rey
Realmo’s AI knows this listing — price, zoning, demand, history. Ask anything.




Frequently Asked Questions
What type of property is this?
Apartment building - Two structures provide rental and owner-occupant configurations on a double lot one block from La Mesa Village.
Where is this apartment building located?
The property is located at 4554 Date Ave La Mesa, CA.
What is the asking price?
The asking price for this property is $2,000,000.
What are key features of this property?
This property features: Eight‑unit configuration with five rental units, an owner’s unit, and a separate rear duplex; Approximately 5,711 sq ft of combined habitable space; Front structure includes a 3‑bedroom, 2‑bath owner’s unit and six bedrooms across the rental units


