Duplex with Two One-Bedroom
For Sale
$239,000
4501-4503 East Stephens Drive, Bloomington, IN 47408
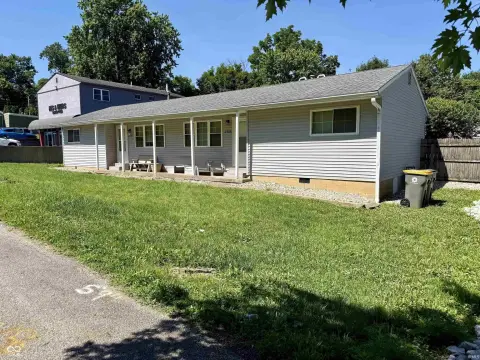
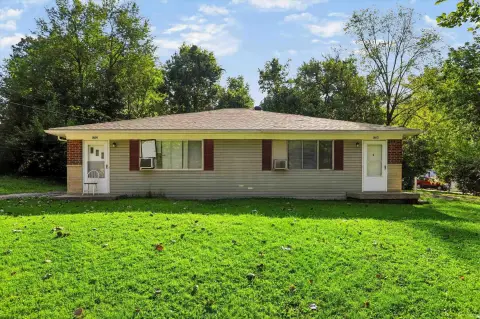
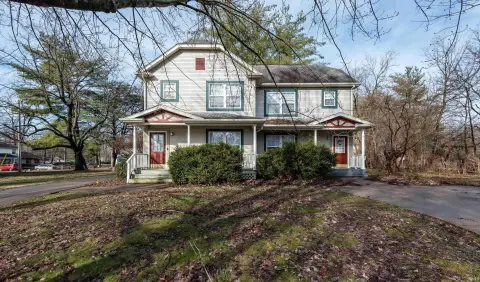
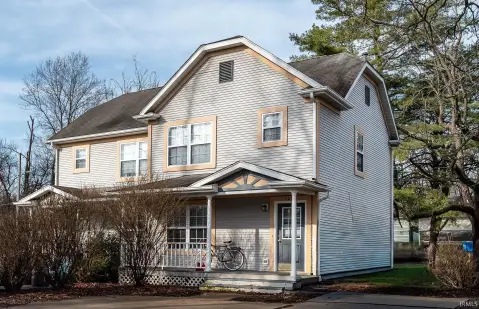
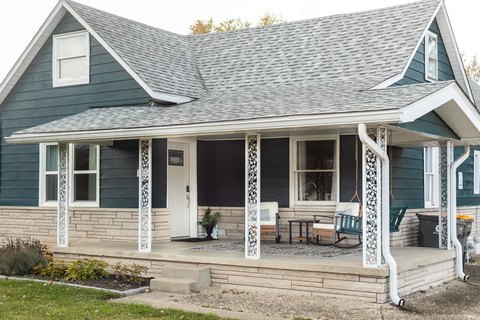
Tenant-occupied duplex with separate kitchens, living areas, bedrooms, bathrooms, and storage.
Property Size1,352 SF
Price / SF$176.78
Days on Market282
Property Features for 4501-4503 East Stephens Drive
General Information
Standard status
Active
Size
1,352 SF
Total Parking Spaces
1
Property subtype
Multi Family / Duplex
Occupancy
100%
Units
Unit Mix
2 x 1BR
Multifamily Units
2
Taxes and HOA fees
Annual Taxes
$5,367
Amenities
Window
1
No
Carpet, Vinyl
2
Conventional, Wall Heater
Slab
Yes
Gravel
Vinyl
Cable Available, Cable Ready, Countertops-Laminate, Water Heater Gas
Asphalt
Building Details
Year Built
1962
Buildings
1
Units
2
Tenancy
Multi
Listing Agency:
Century 21 Scheetz - Bloomington
Listed By:
Melissa Murphy · License #RB14039392
(812) 327-6162
Source:
Compass
Added: Jan 7
Changed: Oct 16
Last Checked: Oct 16 at 10:38AM
Displayed information is deemed reliable but is not guaranteed and should be independently verified. All listing content including descriptions, pricing, images are the copyrighted material of Century 21 Scheetz - Bloomington

Ask AI about this property
Review the available facts, identify missing information and prepare questions for the agent.
Investment Insights
Based on property information with market context.
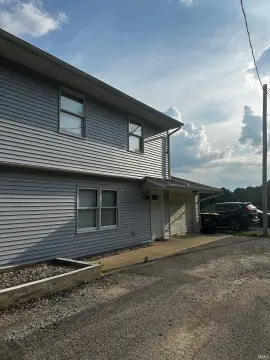
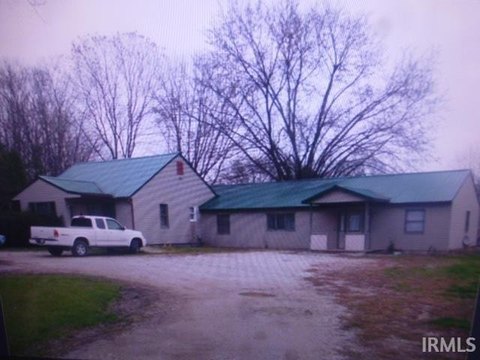
This duplex contains two one-bedroom units, each arranged with a kitchen, living room, dining area, bedroom, bathroom, and storage. Unit 4501 includes an attached one-car garage. The property has a slab foundation, vinyl exterior, asphalt drive and parking surfaces, gas water heaters, and wall heating. Total property size is 1,352 square feet, and the building was constructed in 1962.
A HAND rental occupancy permit allows up to six total occupants and remains valid through July 10, 2029. The roof and gutters were replaced in 2025, and the garage door is new. Action Property Management currently oversees the property, including mowing and trimming. Tenants pay their own utilities and manage snow removal. Unit 4503 is on a month-to-month lease beginning June 1, 2026, with renewal under consideration. Showings require at least 24 hours’ notice.
A HAND rental occupancy permit allows up to six total occupants and remains valid through July 10, 2029. The roof and gutters were replaced in 2025, and the garage door is new. Action Property Management currently oversees the property, including mowing and trimming. Tenants pay their own utilities and manage snow removal. Unit 4503 is on a month-to-month lease beginning June 1, 2026, with renewal under consideration. Showings require at least 24 hours’ notice.
Key Highlights
- HAND rental occupancy permit for six total occupants through July 10, 2029
- Two one‑bedroom units with kitchens, living rooms, dining areas, bathrooms, and storage
- 1,352 square feet; built in 1962
Financial Insights
Estimated NOI and Cap Rate
NOI / Yr
$12,150
Cap Rate
5.08%
Suggested Prices Based on Cap Rates
Cap Rate 5%
$243,000
$243.0K
Cap Rate 7%
$173,571
$173.6K
Cap Rate 9%
$135,000
$135.0K
Market Conditions
NOI Build-Up for 1,352 SF
Gross rent
$18.3K $13.56/SF
− Vacancy
−$975 −$0.72/SF
EGI
$17.4K $12.84/SF
− OpEx
−$5.2K −$3.85/SF
NOI
$12.2K $8.99/SF
Area
Monroe County, IN
Vacancy
5.32%
Lease Rate
$13.56 /SF/Yr
Expense Ratio
30.00%
Simulate Cap Rate and NOI
Suggested Prices Based on Cap Rates
Cap Rate 5%
$243,000
Cap Rate 7%
$173,571
Cap Rate 9%
$135,000
Alternative Uses
Best Use
Multifamily LT 5
$173.6K
$151.9K – $202.5K
NOI $12,150 @ 7.0% cap · market cap 5.08%
Second Best
Apartment 5plus
$157.6K
$137.9K – $183.9K
NOI $11,035 @ 7.0% cap · market cap 4.62%
Theoretical Best
Office A
$264.2K
$231.2K – $308.3K
NOI $18,496 @ 7.0% cap · market cap 7.74%
Zoning and permitted uses should be independently verified with authorities.
How Realmo checks its estimates
Property Analytics
Current Use
Lease Details
2
Residential units
100%
Occupancy
Multi-tenant
Tenancy
Location Intelligence
Trade Area within ½ mile
75
Businesses Nearby
Explore this area
Business Placement
Demographics for 47408, IN
22,917
Population
10,456
Households
2.2
Avg Household Size
28
Median Age
59%
College-Educated
98%
High-School Grad
64.4 sq mi
ZIP Area
356
Density / Sq Mi
$45,584
Median Household Income
$15,819
Median Earnings
$1,177
Median Rent
$304,600
Median Home Value
Market
Vacancy Rate% for Multifamily in Midwest region


Frequently Asked Questions
What type of property is this?
Duplex - Tenant-occupied duplex with separate kitchens, living areas, bedrooms, bathrooms, and storage.
Where is this duplex located?
The property is located at 4501-4503 East Stephens Drive Bloomington, IN.
What is the asking price?
The asking price for this property is $239,000.
What are key features of this property?
This property features: HAND rental occupancy permit for six total occupants through July 10, 2029; Two one‑bedroom units with kitchens, living rooms, dining areas, bathrooms, and storage; 1,352 square feet; built in 1962