Mixed-Use Income Property with Storage
For Sale
$599,000
44618 State Highway 74, Hemet, CA 92544
Two residential units plus a fenced storage lot provide multiple income options and onsite management flexibility.
Property Size1,800 SF
Lot Size0.80 Acres
Price / SF$332.78
Days on Market99
Property Features for 44618 State Highway 74
General Information
Standard status
Active
Size
1,800 SF
Lot size
0.80 Acres
Additional Details
Business Included
Yes
Fenced Yard
Yes
Multifamily Units
2
Building Details
Year Built
1956
Listing Agency:
Coleman and Associates
Listed By:
Matt McPherson · License #01362837
(760) 403-3320
Source:
Myfabuloushome
Added: Jul 5
Changed: Oct 2
Last Checked: Oct 7 at 2:03PM
Displayed information is deemed reliable but is not guaranteed and should be independently verified. All listing content including descriptions, pricing, images are the copyrighted material of Coleman and Associates
Investment Insights
Based on property information with market context.
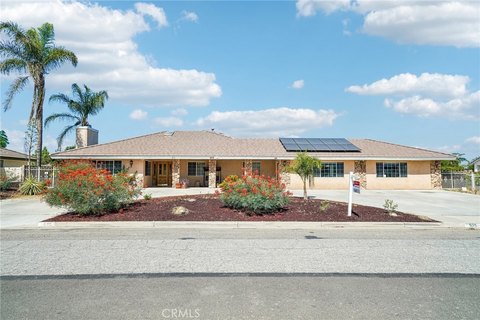
This mixed-use property on approximately 0.80 acres combines two residential units with an expanded, fully fenced storage area. The front unit is a remodeled 2-bedroom, 1-bath home with a separate back studio-style unit that has private access. The grounds also support RV, trailer, and boat storage rentals, with the fully fenced lot currently generating approximately $16,000+ annually through these storage arrangements.
The property is located at 44618 State Highway 74 in Hemet, offering frontage along the highway and visibility from the roadway. An additional side alley provides added access for storage use and convenience for day-to-day operations. The site is described as being in East Hemet’s Valle Vista area, and it is identified as having mixed-use zoning.
For tenants, owners, and buyers seeking a live/work setup, the on-site residences can support onsite management while the storage yard offers another revenue stream. The configuration may also fit contractors and small business operators who want storage on the same property as a home base, with separate access that can help separate residential and storage activities.
The property is located at 44618 State Highway 74 in Hemet, offering frontage along the highway and visibility from the roadway. An additional side alley provides added access for storage use and convenience for day-to-day operations. The site is described as being in East Hemet’s Valle Vista area, and it is identified as having mixed-use zoning.
For tenants, owners, and buyers seeking a live/work setup, the on-site residences can support onsite management while the storage yard offers another revenue stream. The configuration may also fit contractors and small business operators who want storage on the same property as a home base, with separate access that can help separate residential and storage activities.
Key Highlights
- Year built 1956 mixed‑use property with two residential units and highway frontage on Highway 74 in East Hemet’s Valle Vista area.
- Approximately 0.80 acres (34,848 sq ft) with a fully fenced lot currently used for RV, trailer, and boat storage.
- Storage income totals approximately $16,000+ annually from RV, trailer, and boat rentals.
Financial Insights
Estimated NOI and Cap Rate
NOI / Yr
$31,626
Cap Rate
5.28%
Suggested Prices Based on Cap Rates
Cap Rate 5%
$632,520
$632.5K
Cap Rate 7%
$451,800
$451.8K
Cap Rate 9%
$351,400
$351.4K
Market Conditions
NOI Build-Up for 1,800 SF
Gross rent
$46.0K $25.56/SF
− Vacancy
−$828 −$0.46/SF
EGI
$45.2K $25.10/SF
− OpEx
−$13.6K −$7.53/SF
NOI
$31.6K $17.57/SF
Area
Riverside County, CA
Vacancy
1.80%
Lease Rate
$25.56 /SF/Yr
Expense Ratio
30.00%
Simulate Cap Rate and NOI
Suggested Prices Based on Cap Rates
Cap Rate 5%
$632,520
Cap Rate 7%
$451,800
Cap Rate 9%
$351,400
Alternative Uses
Best Use
Multifamily LT 5
$451.8K
$395.3K – $527.1K
NOI $31,626 @ 7.0% cap · market cap 5.28%
Second Best
Apartment 5plus
$416.2K
$364.2K – $485.6K
NOI $29,136 @ 7.0% cap · market cap 4.86%
Theoretical Best
Office A
$539.2K
$471.8K – $629.1K
NOI $37,747 @ 7.0% cap · market cap 6.30%
Zoning and permitted uses should be independently verified with authorities.
Property Analytics
Unlock full access to Insights
Subscribe to Realmo Intelligence
Open Analytics
Current Use
Lease Details
2
Residential units
Turnkey business
Opportunity
Yes
Fenced yard
Location Intelligence
Trade Area within ½ mile
109
Businesses Nearby
Explore this area
Business Placement
Demographics for 92544, CA
50,007
Population
17,568
Households
2.8
Avg Household Size
37
Median Age
14%
College-Educated
81%
High-School Grad
170.8 sq mi
ZIP Area
293
Density / Sq Mi
$67,011
Median Household Income
$37,785
Median Earnings
$1,530
Median Rent
$356,200
Median Home Value
Check the figures for this property
Cap Rate, Value Estimation, Potential NOI and more
View Realmo Analytics
Market
Vacancy Rate% for Industrial in West region

Questions? Ask Rey
Realmo’s AI knows this listing — price, zoning, demand, history. Ask anything.




Frequently Asked Questions
What type of property is this?
Duplex - Two residential units plus a fenced storage lot provide multiple income options and onsite management flexibility.
Where is this duplex located?
The property is located at 44618 State Highway 74 Hemet, CA.
What is the asking price?
The asking price for this property is $599,000.
What are key features of this property?
This property features: Year built 1956 mixed‑use property with two residential units and highway frontage on Highway 74 in East Hemet’s Valle Vista area.; Approximately 0.80 acres (34,848 sq ft) with a fully fenced lot currently used for RV, trailer, and boat storage.; Storage income totals approximately $16,000+ annually from RV, trailer, and boat rentals.


