Adaptive-Reuse Flex
For Sale
Contact for pricing
442 S Raymond Ave, Pasadena, CA 91105
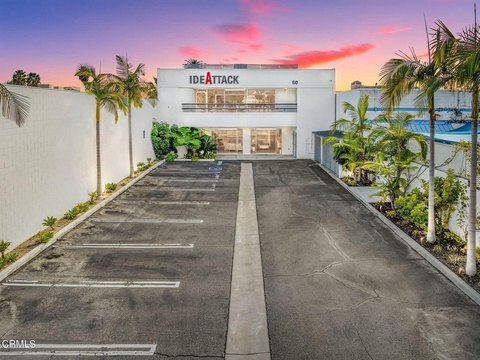
Two-building offering combines a Class A creative office with remodeled industrial space, flexible interiors, and functional workplace amenities.
Property Size16,593 SF
Lot Size0.59 Acres
Price / SF$632.50
Days on Market58
Property Features for 442 S Raymond Ave
General Information
Standard status
Active
Size
16,593 SF
Class
A
Lot size
0.59 Acres
Property subtype
Office, Industrial
Zoning
SFO-MU-N
Warehouse & Industrial
Clear Height
14 ft
Power
400 amps
Amenities
two kitchens
conference rooms
media rooms
flexible collaboration areas
showers
meditation room
podcast studio
kids/gaming room
Building Details
Year Built
1919
Year Renovated
2022
Buildings
2
Tenancy
Single
Listing Agency:
Lee & Associates - Pasadena
Listed By:
Brendon Shoemake · License #DRE #02208366
(626) 240-2776
Source:
Crexi
Added: Aug 18
Changed: Oct 13
Last Checked: Oct 12 at 7:16PM
Displayed information is deemed reliable but is not guaranteed and should be independently verified. All listing content including descriptions, pricing, images are the copyrighted material of Lee & Associates - Pasadena
Investment Insights
Based on property information with market context.
This two-building Pasadena offering totals 16,593 SF across 25,636 SF of land. The 442 S. Raymond Avenue building provides Class A adaptive-reuse office space with two kitchens, conference and media rooms, collaboration areas, showers, a meditation room, podcast studio, and kids/gaming room. The companion property at 450 S. Raymond Avenue is a 6,593-square-foot single-story flex industrial building on approximately 7,341 square feet of land.
Originally built in 1919 and remodeled in 2022, the 450 S. Raymond facility retains brick architectural elements while adding 14-foot clear height, 400 amps of power, north-facing skylights, open production space, drive-in access, office and reception areas, and two restrooms. The property is currently leased to Stone Coyote Ceramics, a membership-based ceramics studio and arts facility. Both buildings are located along South Raymond Avenue in Pasadena and carry SFO-MU-N zoning.
Originally built in 1919 and remodeled in 2022, the 450 S. Raymond facility retains brick architectural elements while adding 14-foot clear height, 400 amps of power, north-facing skylights, open production space, drive-in access, office and reception areas, and two restrooms. The property is currently leased to Stone Coyote Ceramics, a membership-based ceramics studio and arts facility. Both buildings are located along South Raymond Avenue in Pasadena and carry SFO-MU-N zoning.
Key Highlights
- Two adjacent creative buildings total 16,593 SF on 25,636 SF of land
- 442 S. Raymond offers Class A adaptive‑reuse office space with two kitchens and multiple conference and media rooms
- 450 S. Raymond contains 6,593 square feet on approximately 7,341 square feet of land
Financial Insights
Estimated NOI and Cap Rate
NOI / Yr
$355,422
Cap Rate
3.39%
Suggested Prices Based on Cap Rates
Cap Rate 5%
$7,108,440
$7.1M
Cap Rate 7%
$5,077,457
$5.1M
Cap Rate 9%
$3,949,133
$3.9M
Market Conditions
NOI Build-Up for 16,593 SF
Gross rent
$557.5K $33.60/SF
− Vacancy
−$83.6K −$5.04/SF
EGI
$473.9K $28.56/SF
− OpEx
−$118.5K −$7.14/SF
NOI
$355.4K $21.42/SF
Area
Pasadena, CA
Vacancy
15.00%
Lease Rate
$33.60 /SF/Yr
Expense Ratio
25.00%
Simulate Cap Rate and NOI
Suggested Prices Based on Cap Rates
Cap Rate 5%
$7,108,440
Cap Rate 7%
$5,077,457
Cap Rate 9%
$3,949,133
Alternative Uses
Best Use
Office B
$5.08M
$4.44M – $5.92M
NOI $355,422 @ 7.0% cap · market cap 3.39%
Second Best
Industrial
$2.94M
$2.58M – $3.44M
NOI $206,128 @ 7.0% cap · market cap 1.96%
Theoretical Best
Multifamily LT 5
$373.51M
$326.82M – $435.76M
NOI $26,145,644 @ 7.0% cap · market cap 249.12%
Zoning and permitted uses should be independently verified with authorities.
How Realmo checks its estimates
Property Analytics
Unlock full access to Insights
Subscribe to Realmo Intelligence
Open Analytics
Current Use
Lease Details
14 ft
Clear height
Location Intelligence
Trade Area within ½ mile
7,064
Businesses Nearby
Under-served
Demand for This Use
Explore this area
Business Placement
Demographics for 91105, CA
13,869
Population
6,773
Households
2
Avg Household Size
48
Median Age
73%
College-Educated
98%
High-School Grad
4.2 sq mi
ZIP Area
3,302
Density / Sq Mi
$156,835
Median Household Income
$97,402
Median Earnings
$2,988
Median Rent
$1,615,700
Median Home Value
Check the figures for this property
Cap Rate, Value Estimation, Potential NOI and more
View Realmo Analytics
Market
Vacancy Rate% for Office in West region

Questions? Ask Rey
Realmo’s AI knows this listing — price, zoning, demand, history. Ask anything.




Similar Off Market Nearby
- Taste of Pace Catering — 11 W Dayton St, Pasadena, CA 91105
- All India Cafe — 39 S Fair Oaks Ave, Pasadena, CA 91105
- The Romanesque Room — 50 E Green St Ste 105, Pasadena, CA 91105
- Rewind Inc — 790 E Colorado Blvd, Pasadena, CA 91101
- The Taco Guy Catering — 60 N Raymond Ave, Pasadena, CA 91101
Frequently Asked Questions
What type of property is this?
Flex space - Two-building offering combines a Class A creative office with remodeled industrial space, flexible interiors, and functional workplace amenities.
Where is this flex space located?
The property is located at 442 S Raymond Ave Pasadena, CA.
What is the asking price?
The asking price for this property is $10,495,000.
What are key features of this property?
This property features: Two adjacent creative buildings total 16,593 SF on 25,636 SF of land; 442 S. Raymond offers Class A adaptive‑reuse office space with two kitchens and multiple conference and media rooms; 450 S. Raymond contains 6,593 square feet on approximately 7,341 square feet of land


