Newly Built Triplex with
For Sale
$1,048,500
4344 Macnab Drive, Tyler, TX 75707
Residential Income, Tyler, TX
Property SizeContact for details
Days on Market371
Property Features for 4344 Macnab Drive
General Information
Property type
Residential Multi Family
Property subtype
Triplex
Parking features
Garage
Security features
Security
Window features
Blinds
Pets allowed
Yes
Interior features
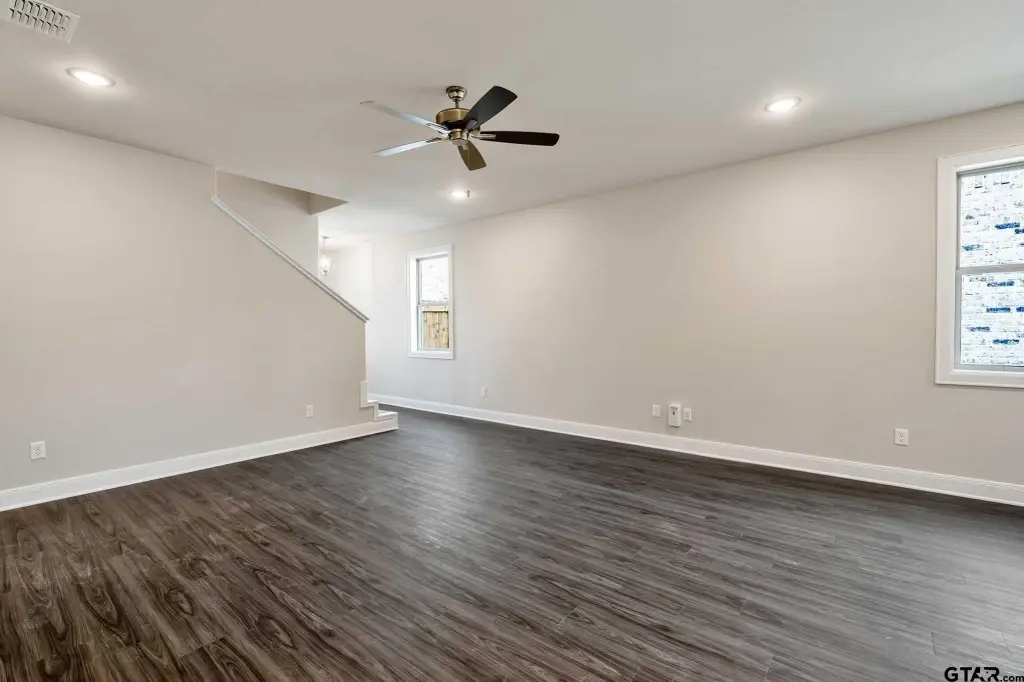
Ceiling Fan, Cable TV
Exterior features
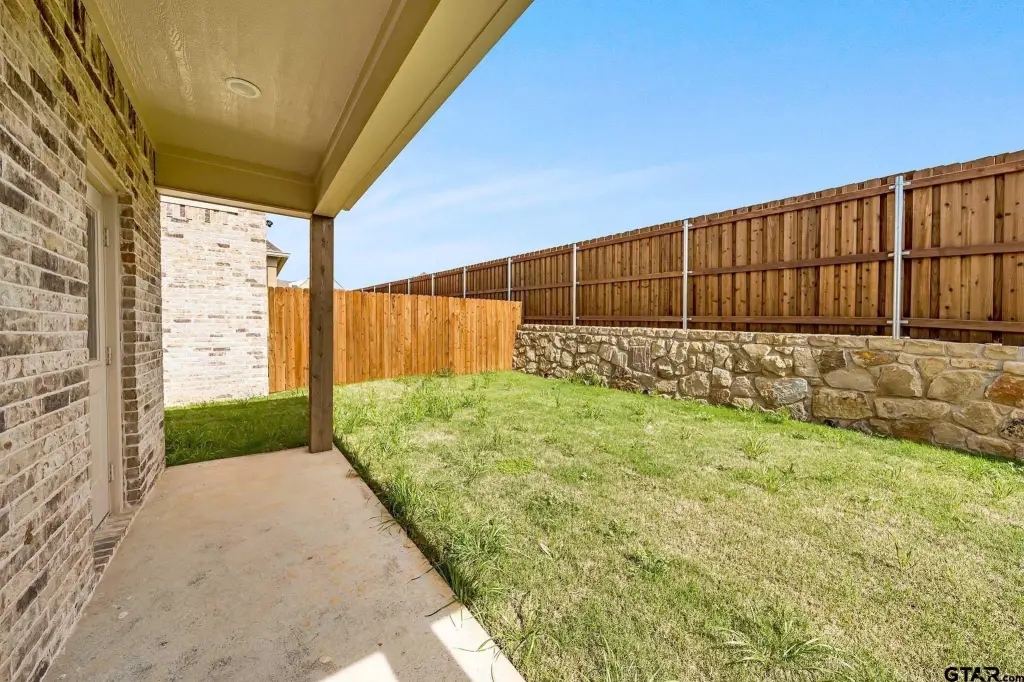
Irrigation System, Rain Gutters
Appliances
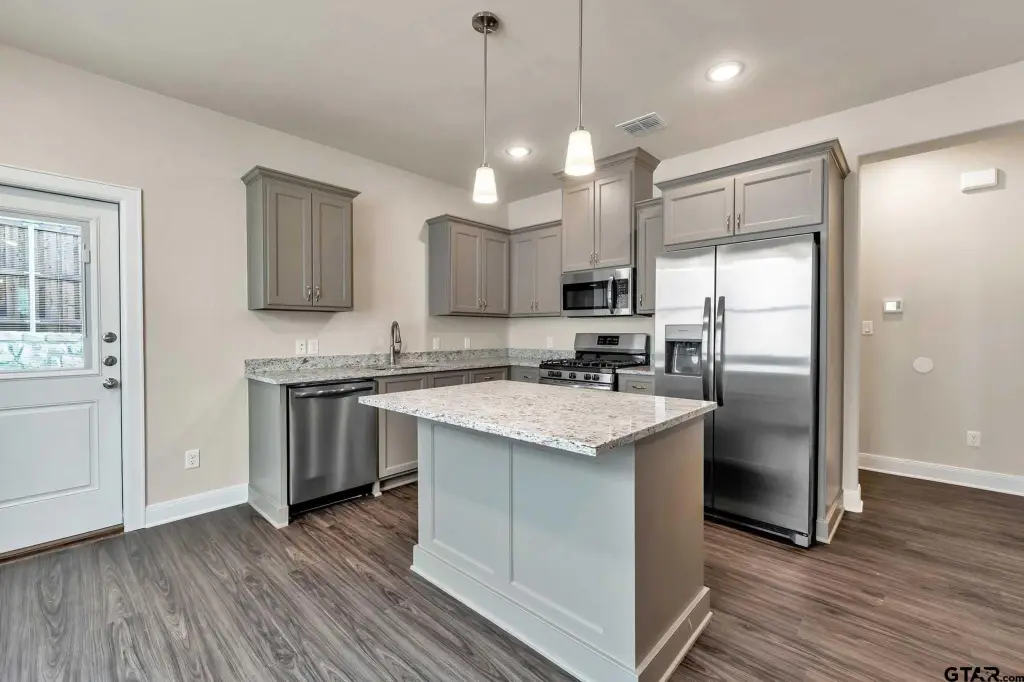
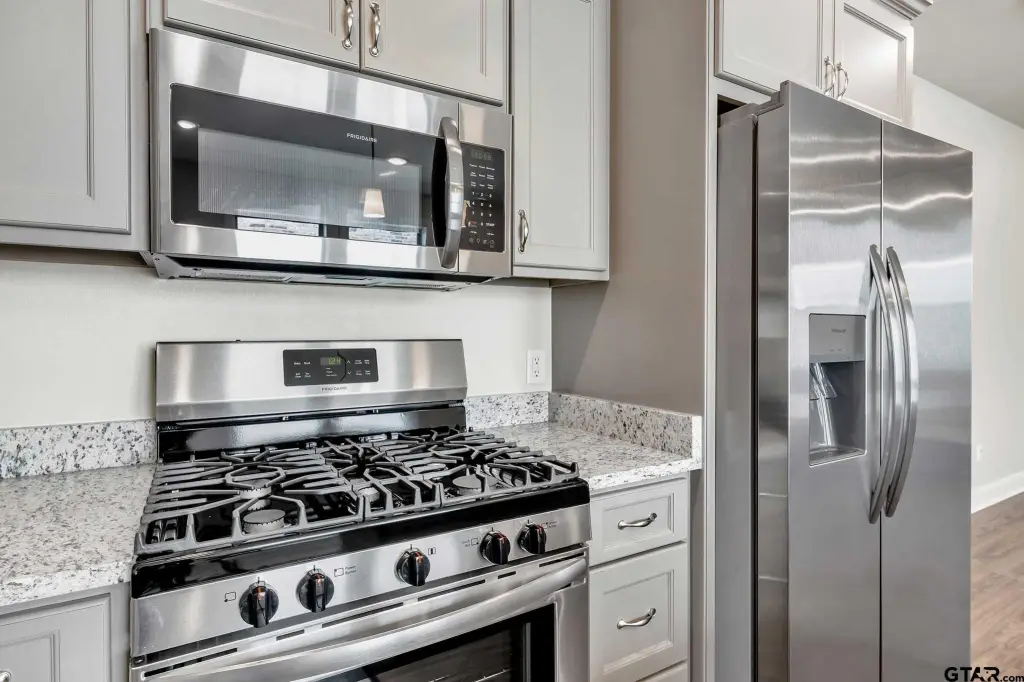
Gas Range, Dishwasher, Disposal, Microwave, Refrigerator, Ice Maker
Subdivision
Huntingtontower
Elementary school
Chapel Hill
Middle school
Chapel Hill
High school
Chapel Hill
Directions
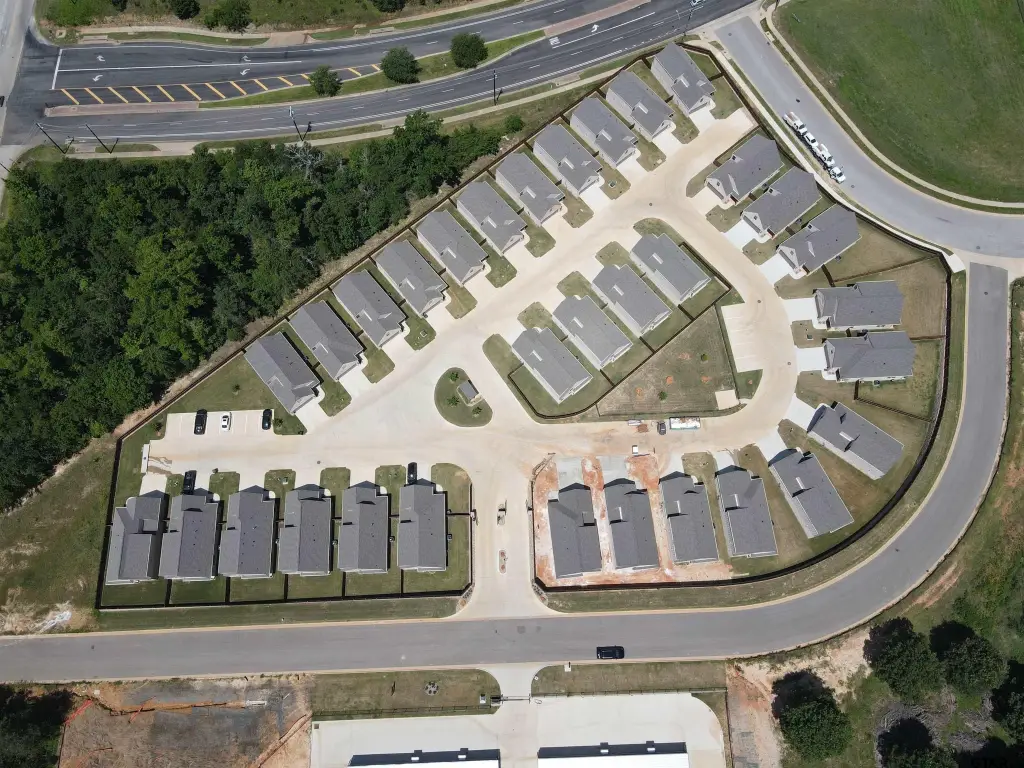
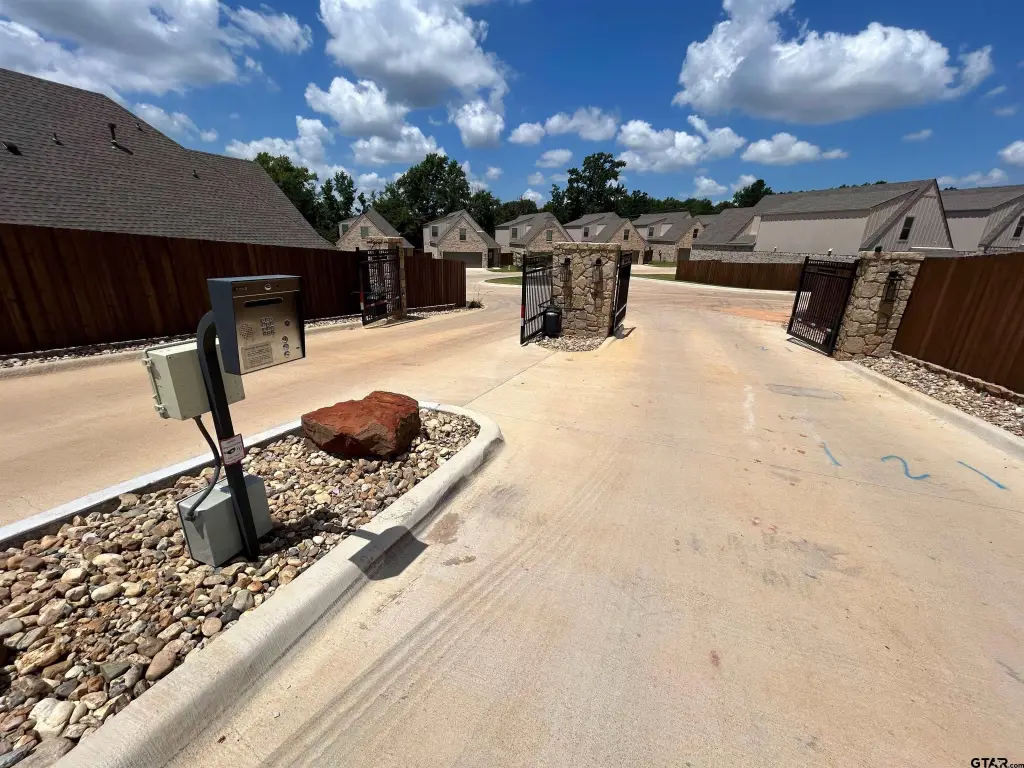
Go East on Shiloh Rd past Wal-Mart and continue until you see CR 2120, turn left and continue East when it turns into Old Omen Rd at the stop sign. Then make a left on MacNab Dr. The community is on the left. Enter through the gate and make a right. Follow the road until the next intersection and make a left. Home #31 will be on your lefthand side.
Standard status
Active
Taxes and HOA fees
Tax Year
2024
Tax Description
LOT 1.1, HUNTINGTOWER, SEC U-2
Legal Description
LOT 1.1, HUNTINGTOWER, SEC U-2
Utilities
Sewer type
Public Sewer
Heating system
Central
Cooling system
Central Air, Electric
Amenities
private dog park
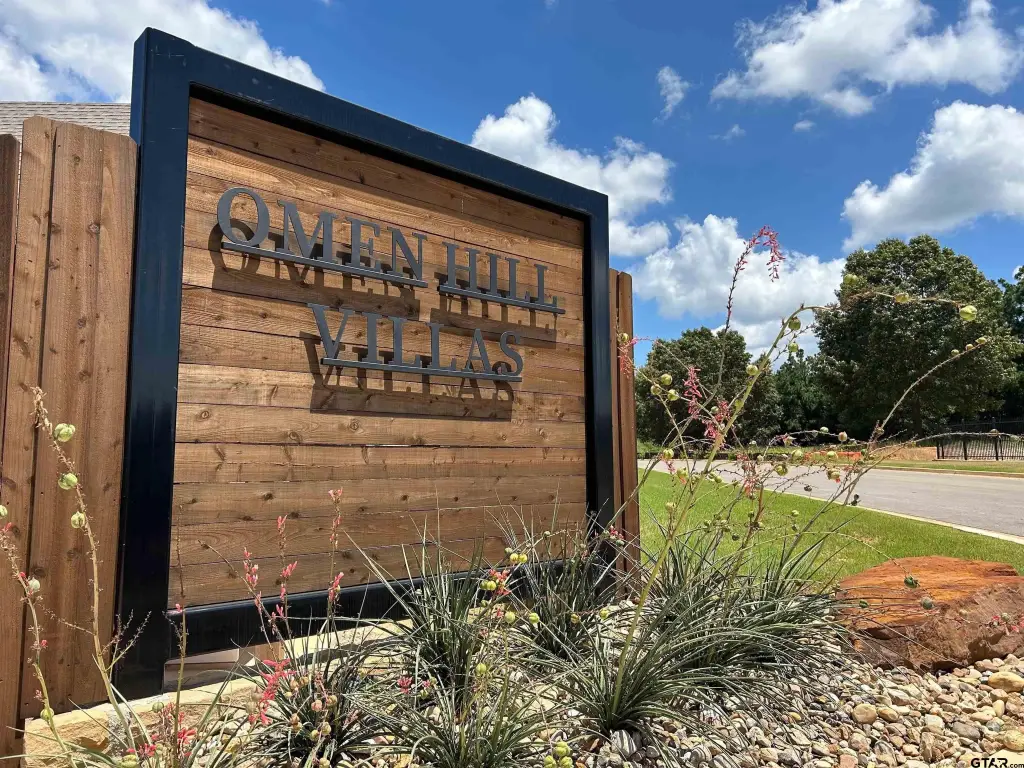
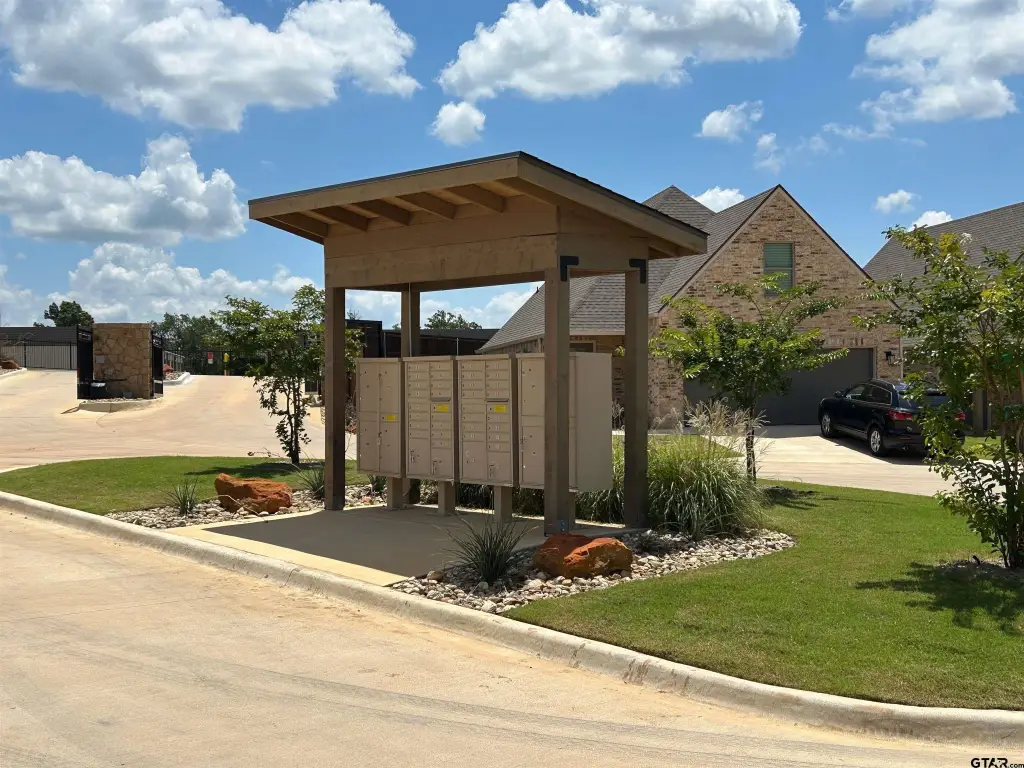
gated community
Building Details
Year built
2024
Floors in Building
2
Number of units
3
Flooring type
Vinyl
Building materials
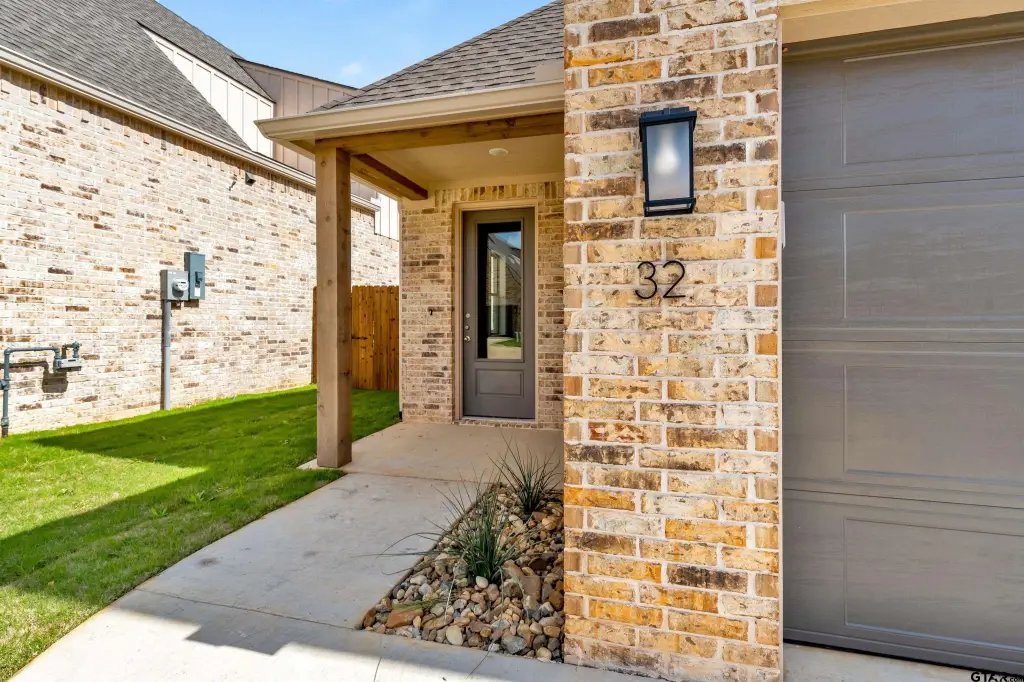
Stone, Brick
Roof type
Composition
Listing Agency:
Drake Real Estate & Investments
(903) 581-3737
Listed By:
Jeremy Caruthers
(903) 630-0582
Added: Oct 20, 2025
Changed: Oct 25
Last Checked: Oct 25 at 5:06PM
MLS# 25015466
Copyright © 2026 Greater Tyler Association of Realtors. All rights reserved. All information provided by the listing agent/broker is deemed reliable but is not guaranteed and should be independently verified.

Ask AI about this property
Review the available facts, identify missing information and prepare questions for the agent.
Investment Insights
Based on property information with market context.
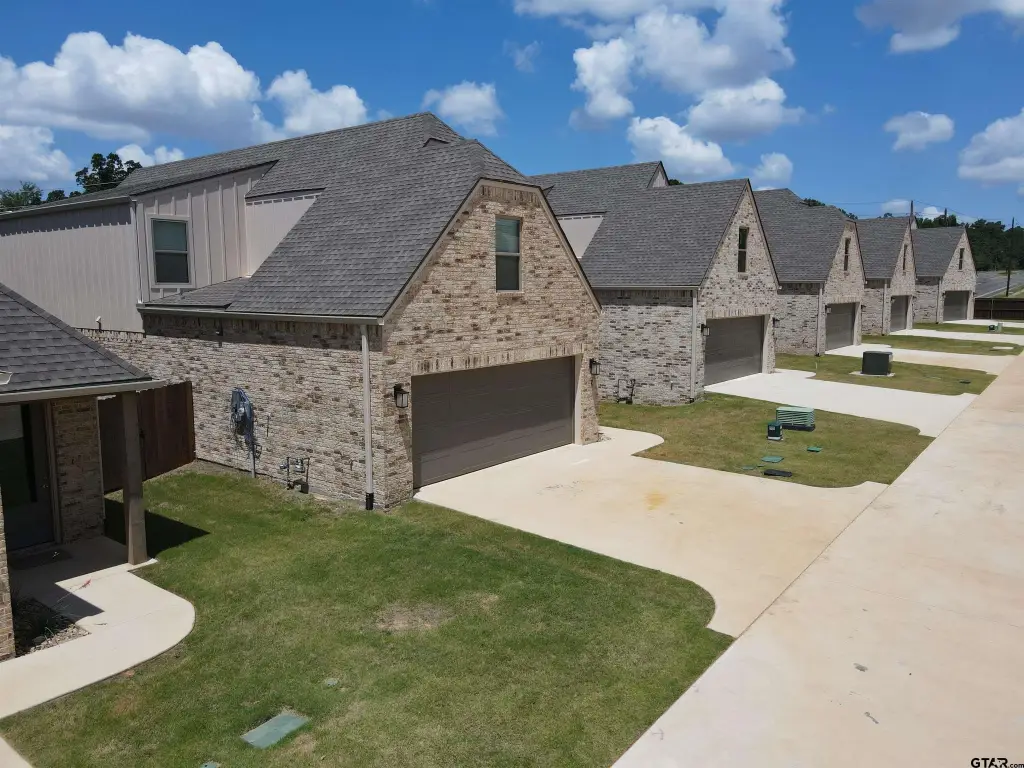
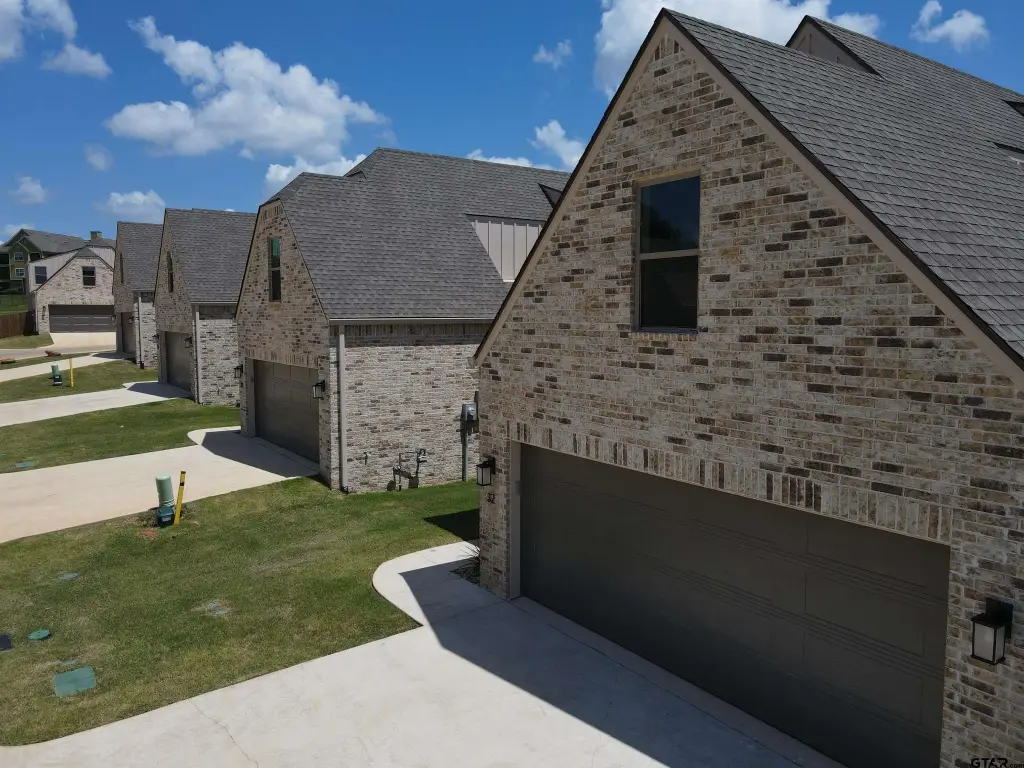
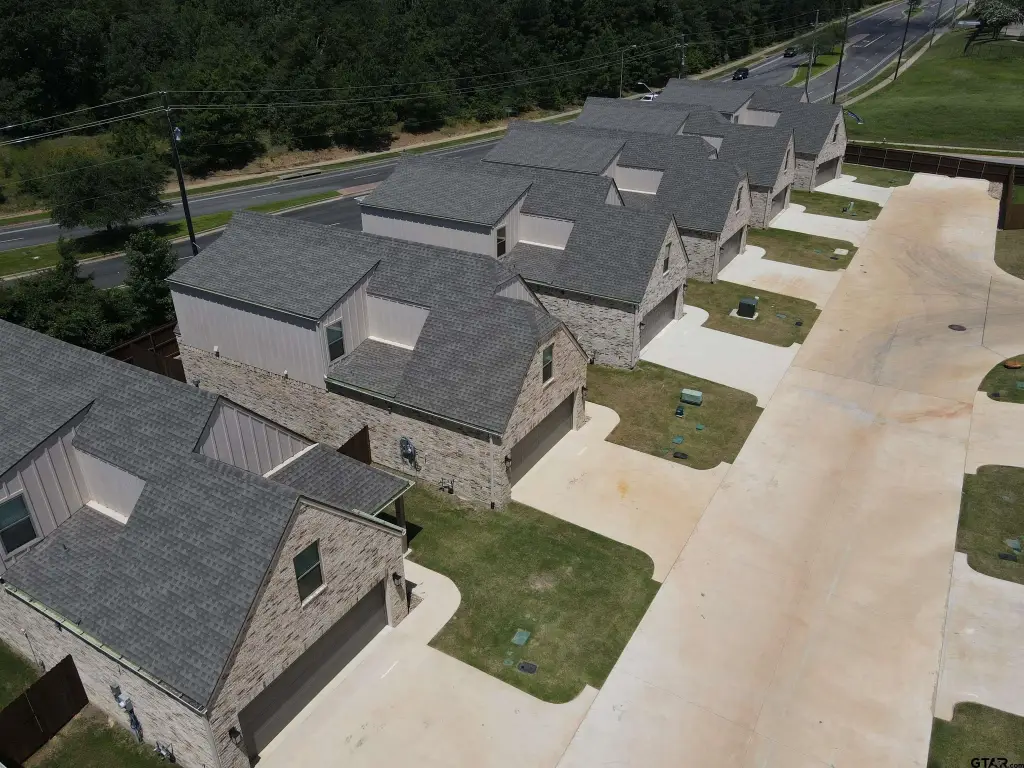
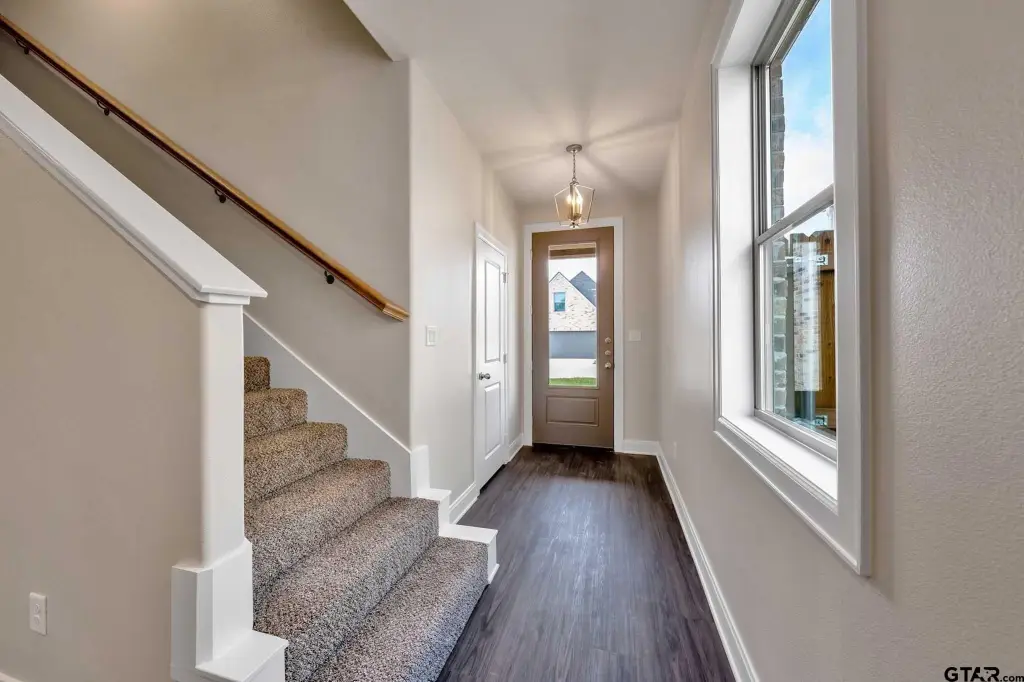
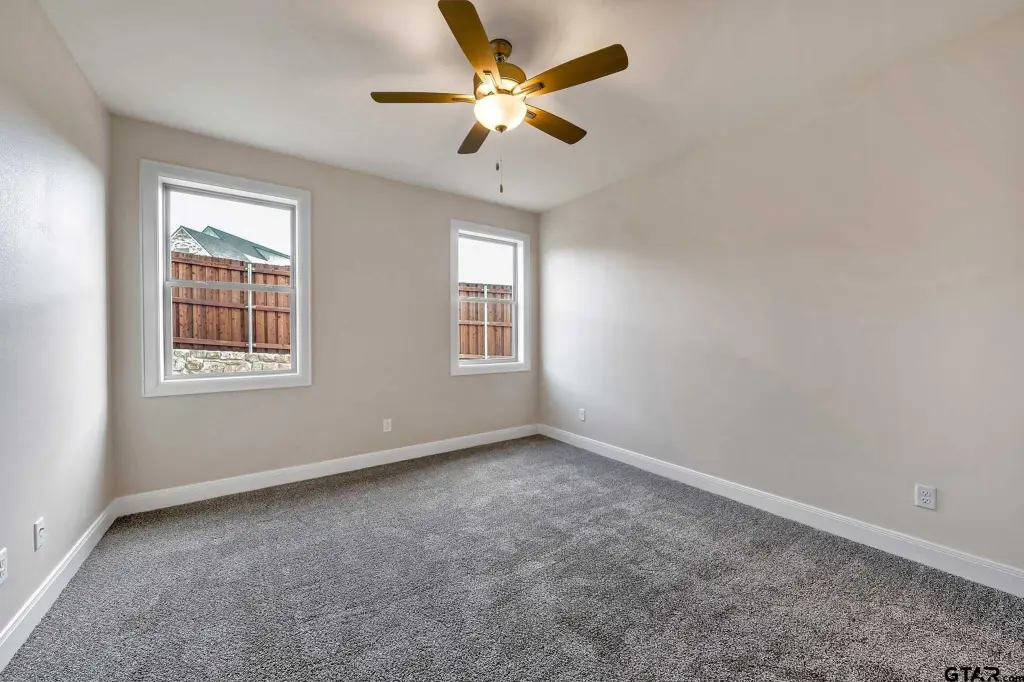
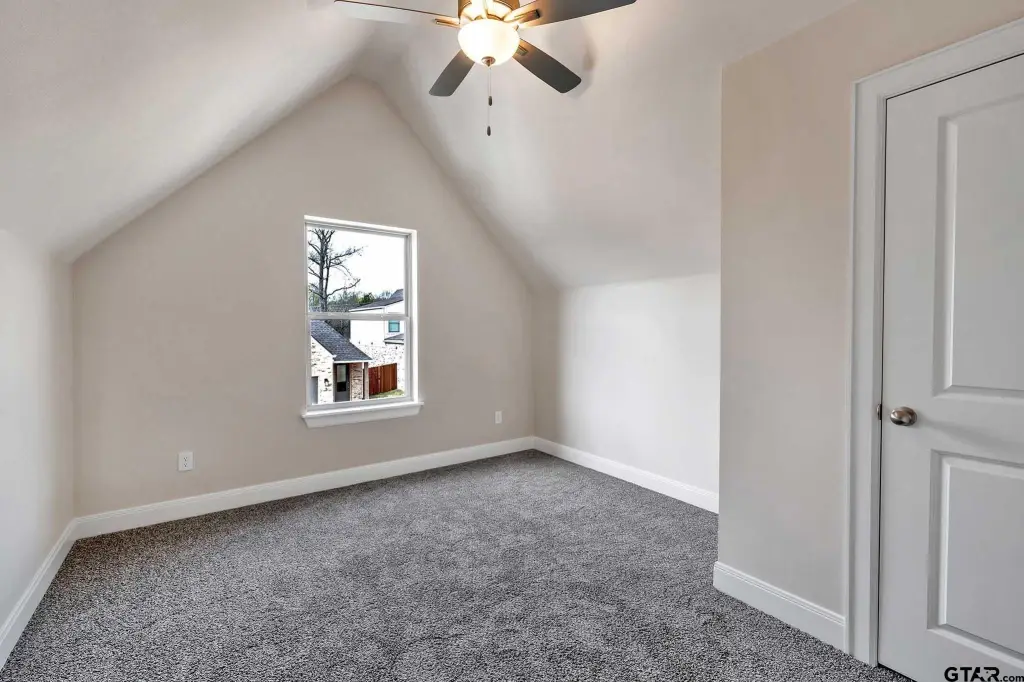
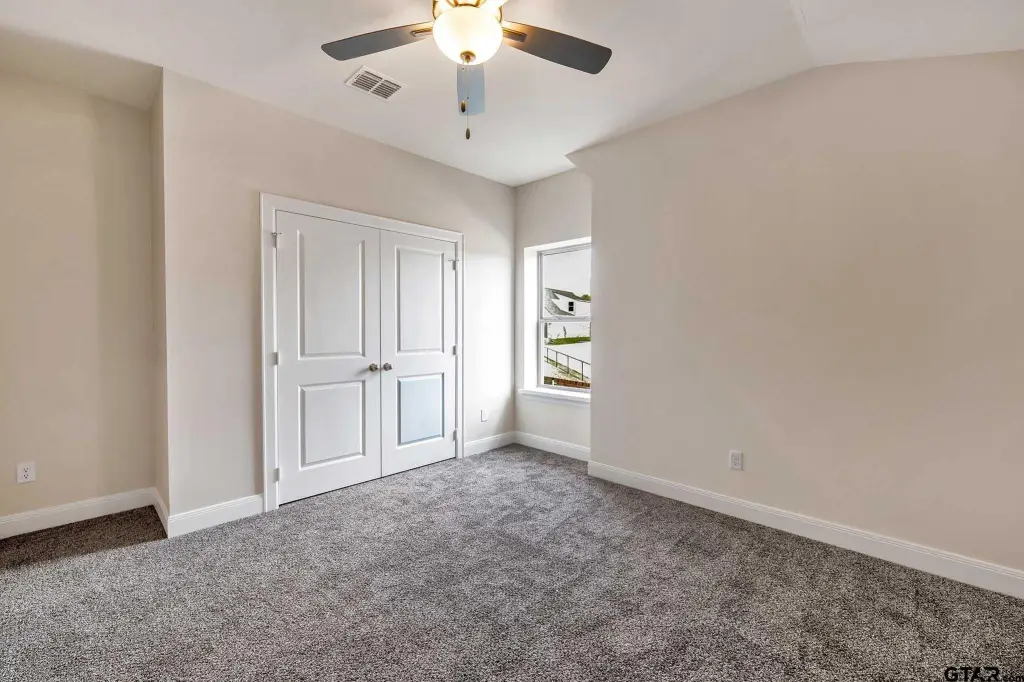
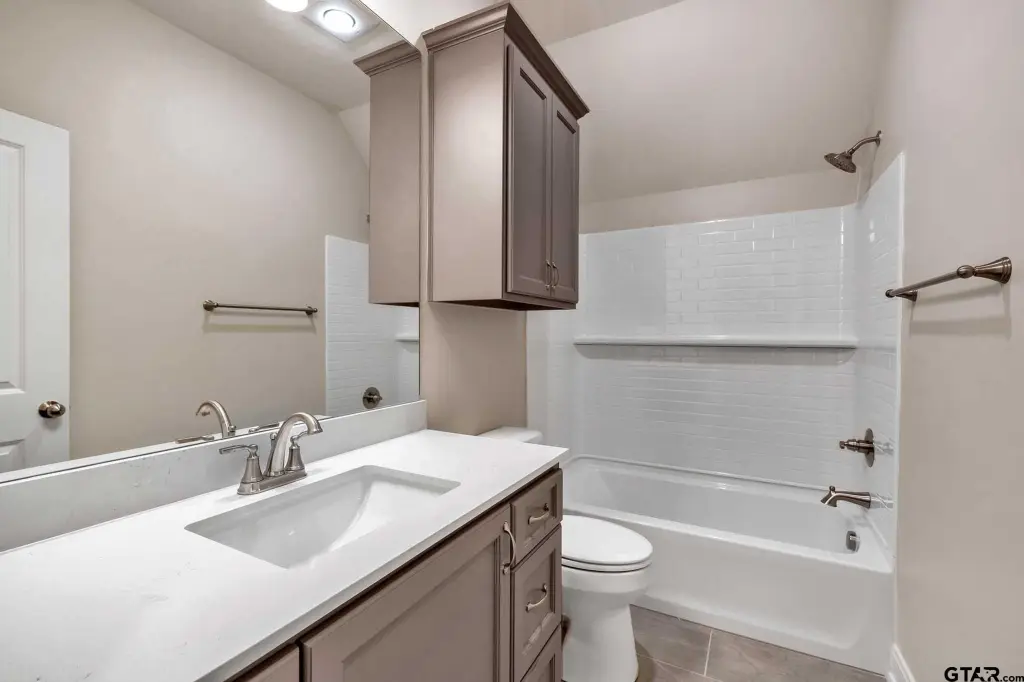
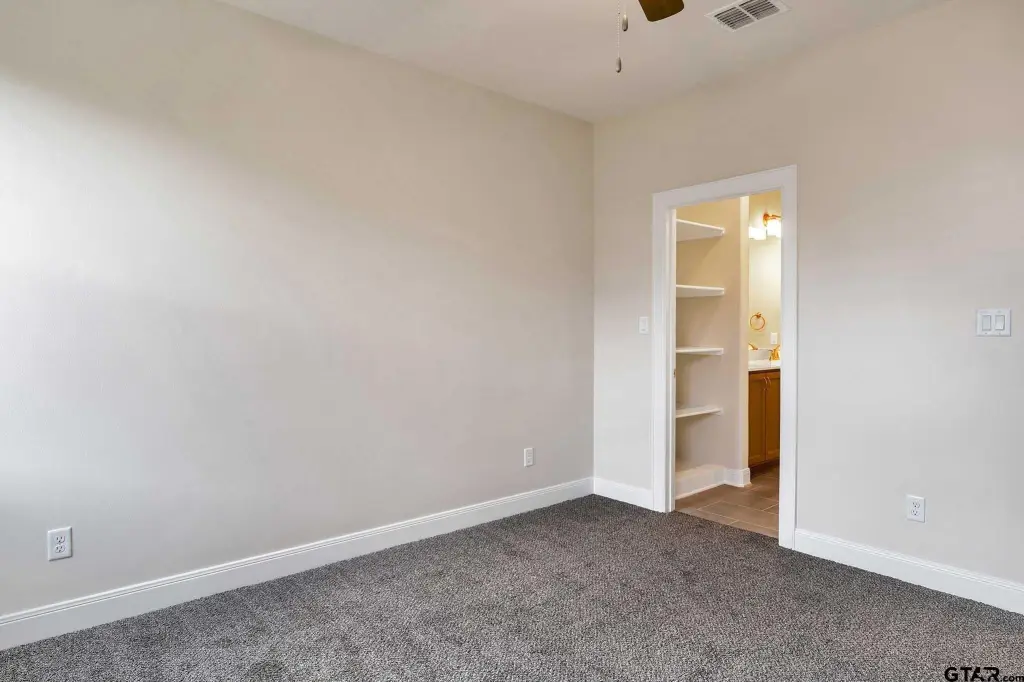
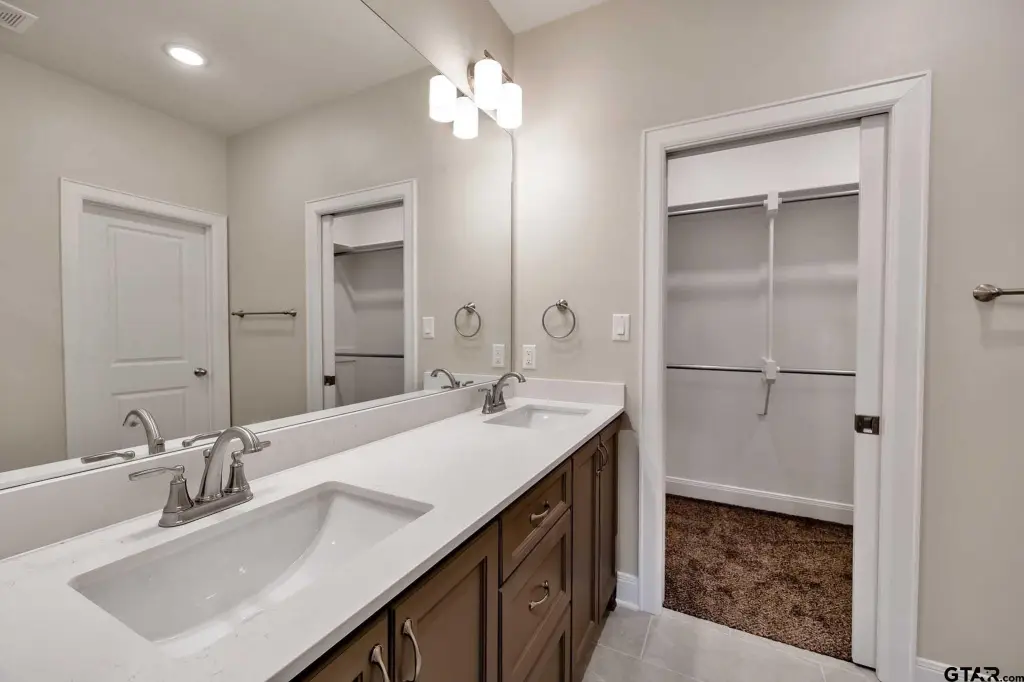
This 2024-built triplex comprises three newly constructed, single-family detached homes totaling 5,700 square feet. Each residence includes 4 bedrooms, 2.5 bathrooms, and a 2-car garage, with an open-concept lower level and contemporary interior finishes. Granite or quartz countertops, stainless steel kitchen appliances, vinyl flooring, central heating, and central air support everyday functionality. Additional improvements include irrigation, rain gutters, brick and stone construction, and composition roofing.
The property is located at 4344 Macnab Drive in Tyler, within a quiet gated community near UT Tyler. Residents have access to a private dog park. Kitchens are equipped with gas ranges, dishwashers, disposals, microwaves, refrigerators, and ice makers, while ceiling fans and cable TV are also included among the interior features.
The property is located at 4344 Macnab Drive in Tyler, within a quiet gated community near UT Tyler. Residents have access to a private dog park. Kitchens are equipped with gas ranges, dishwashers, disposals, microwaves, refrigerators, and ice makers, while ceiling fans and cable TV are also included among the interior features.
Key Highlights
- Three newly constructed single‑family detached homes totaling 5,700 square feet
- Each home includes 4 bedrooms, 2.5 bathrooms, and a 2‑car garage
- Built in 2024 within a quiet, gated Tyler community
Property Analytics
Who owns this building?
See the owner, sales and loan history
Open Analytics
Lease Details
3
Residential units
Location Intelligence
Trade Area within ½ mile
26
Businesses Nearby
Explore this area
Business Placement
Demographics for 75707, TX
16,620
Population
6,858
Households
2.4
Avg Household Size
42
Median Age
34%
College-Educated
92%
High-School Grad
52.4 sq mi
ZIP Area
317
Density / Sq Mi
$85,406
Median Household Income
$44,425
Median Earnings
$1,415
Median Rent
$256,300
Median Home Value
Check the figures for this property
Cap Rate, Value Estimation, Potential NOI and more
View Realmo Analytics







Frequently Asked Questions
What type of property is this?
Single family property - Three detached residences in a gated Tyler community feature contemporary interiors, efficient appliances, and shared dog-park access.
Where is this single family property located?
The property is located at 4344 Macnab Drive Tyler, TX.
What is the asking price?
The asking price for this property is $1,048,500.
What are key features of this property?
This property features: Three newly constructed single‑family detached homes totaling 5,700 square feet; Each home includes 4 bedrooms, 2.5 bathrooms, and a 2‑car garage; Built in 2024 within a quiet, gated Tyler community


