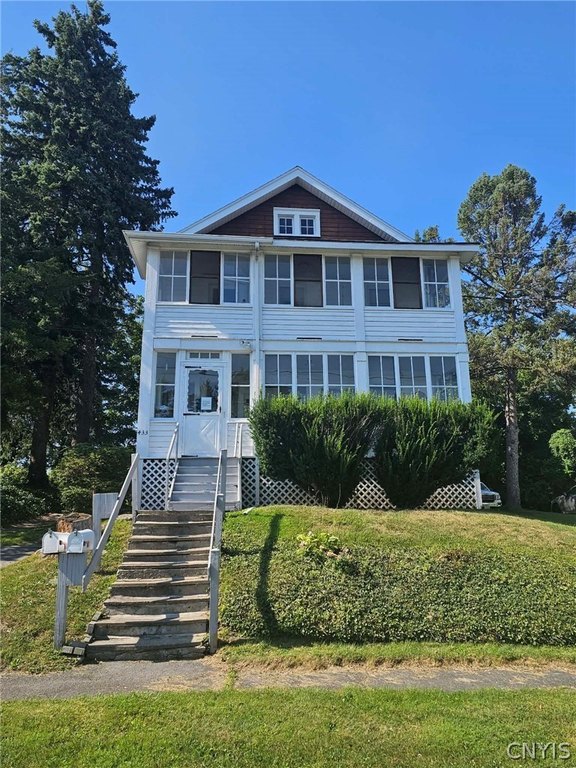
Updated Two-Unit
For Sale
$209,900
Pending
433 Vann Street, Syracuse, NY 13206
Residential, Syracuse, NY
Property Size1,920 SF
Lot Size0.20 Acres
Days on Market52
Property Features for 433 Vann Street
General Information
Property type
Residential Multi Family
Property subtype
Duplex
Bedrooms
4
Bathrooms
2
Full bathrooms
2
Rooms
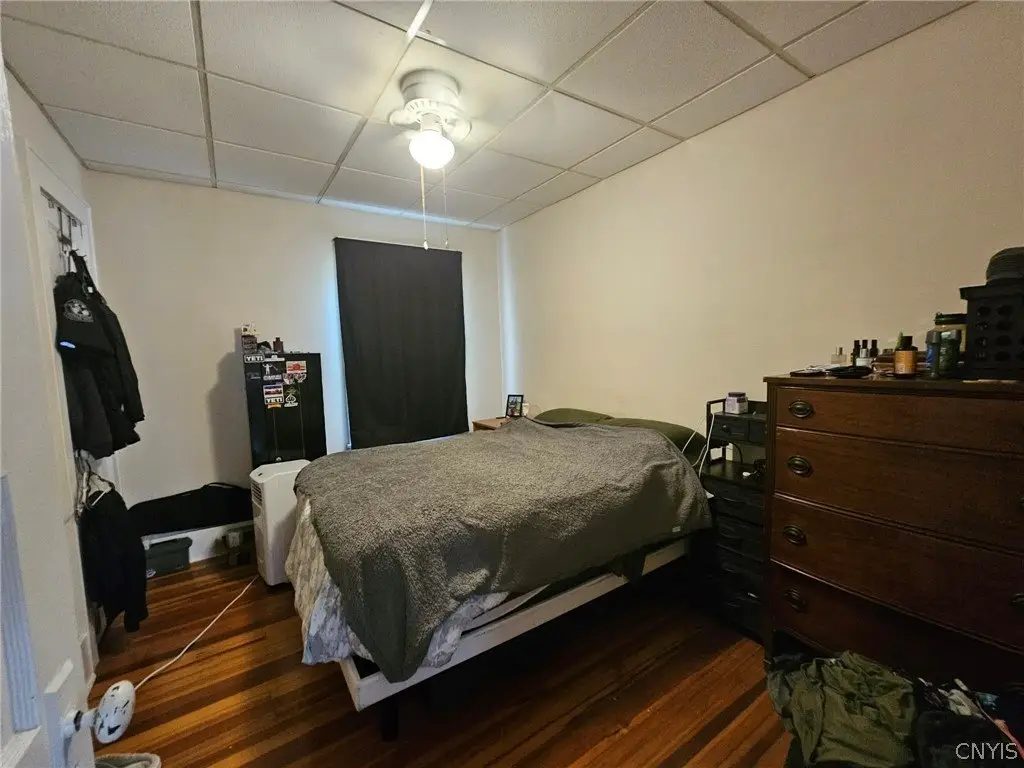
Bathroom 2, Bedroom 2, Bedroom 4, Bedroom 1, Basement, Bathroom 1, Bedroom 3
Parking features
Garage
Patio and Porch features
Porch
Interior features
CeilingFans
Exterior features
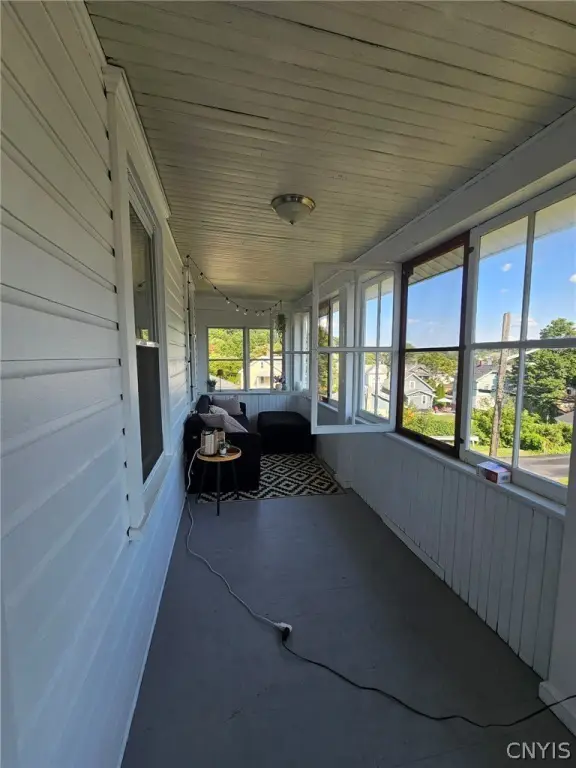
EnclosedPorch, Porch
Appliances
GasWaterHeater
Lot features
Near Public Transit, Rectangular, Rectangular Lot, Residential Lot
Elementary school district
Syracuse
Middle school district
Syracuse
High school district
Syracuse
Directions
Turn onto Dillaye from Burnet Ave, then turn right onto Vann St. Home will be on the left
Subdivision
Syracuse City-311500
Standard status
Pending
APN
311500-028-000-0007-029-000-0000
Size
1,920 SF
Lot size
0.20 Acres
Taxes and HOA fees
Tax Annual Amount
3275
Utilities
Heating system
Natural Gas, Forced Air
Water source
Public
Amenities
laundry units
enclosed sun porches
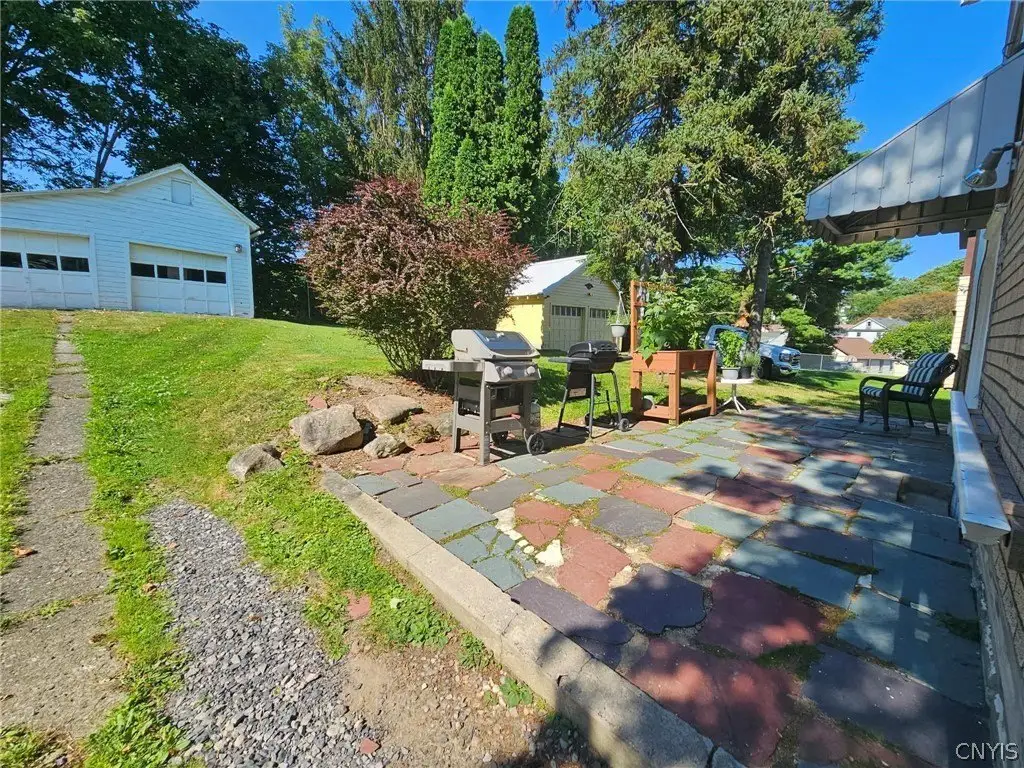
paver patio
Building Details
Year built
1923
Floors in Building
2
Number of units
2
Flooring type
Tile, Hardwood, Vinyl, Varies
Building materials
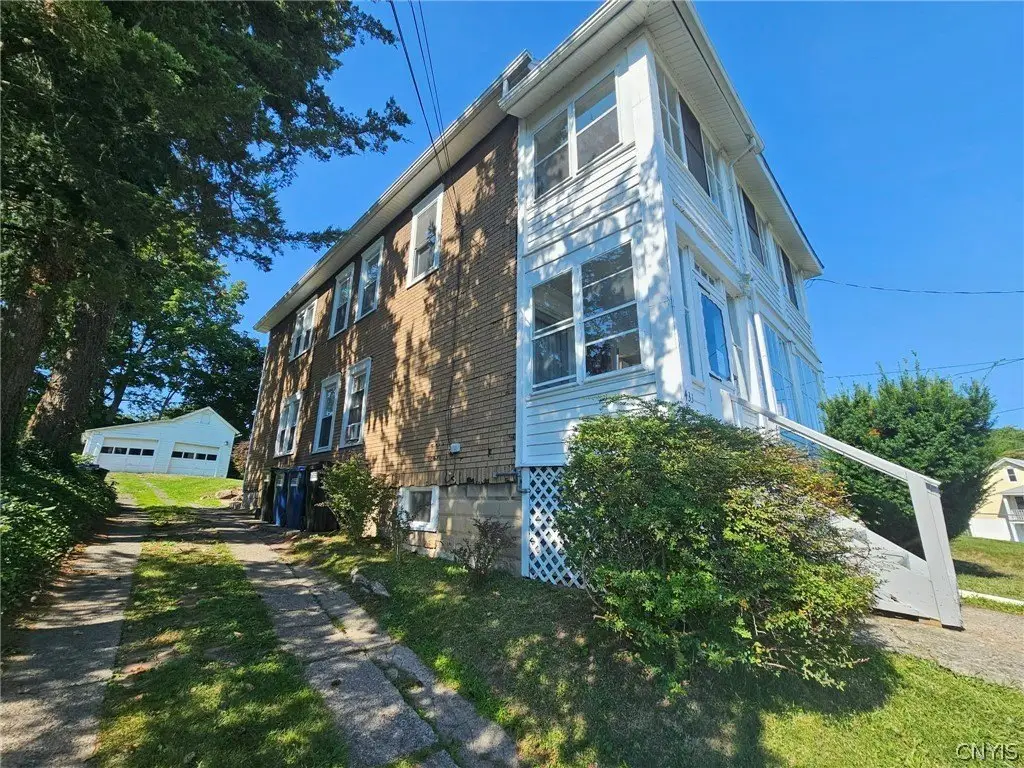
Brick
Roof type
Shingle
Architectural style
Other
Listing Agency:
Candy Costa Real Estate LLC
Listed By:
Christina Dischiave · License #10401345577
(315) 505-6609
Added: Aug 20
Changed: Sep 25
Last Checked: Oct 10 at 12:06AM
MLS# S1708613
Copyright © 2026 New York State Alliance of MLSs, LLC. All rights reserved. All information provided by the listing agent/broker is deemed reliable but is not guaranteed and should be independently verified.
Investment Insights
Based on property information with market context.
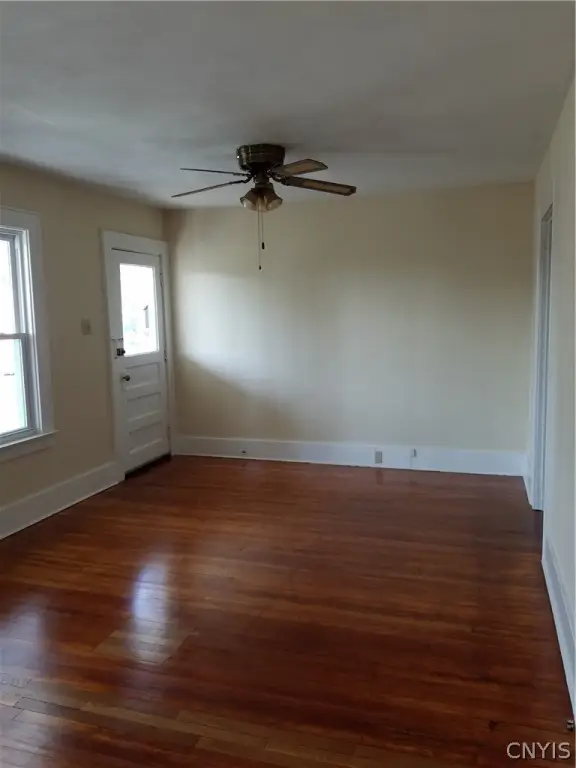
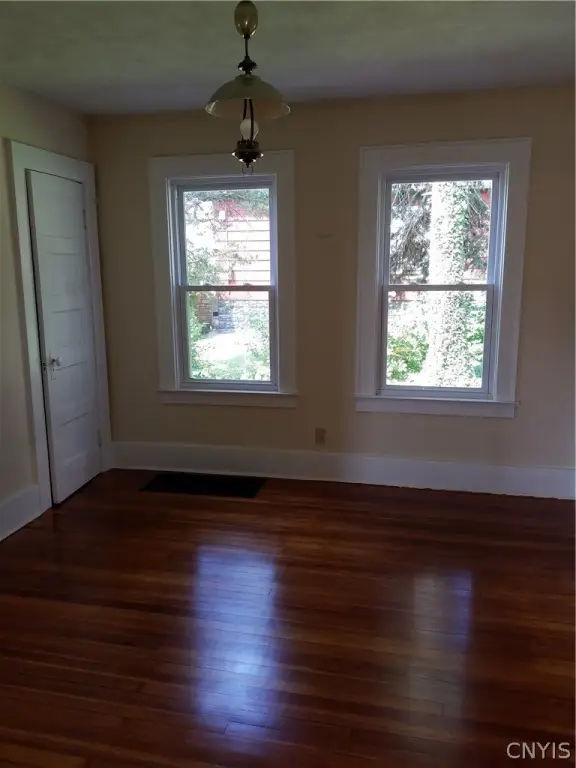
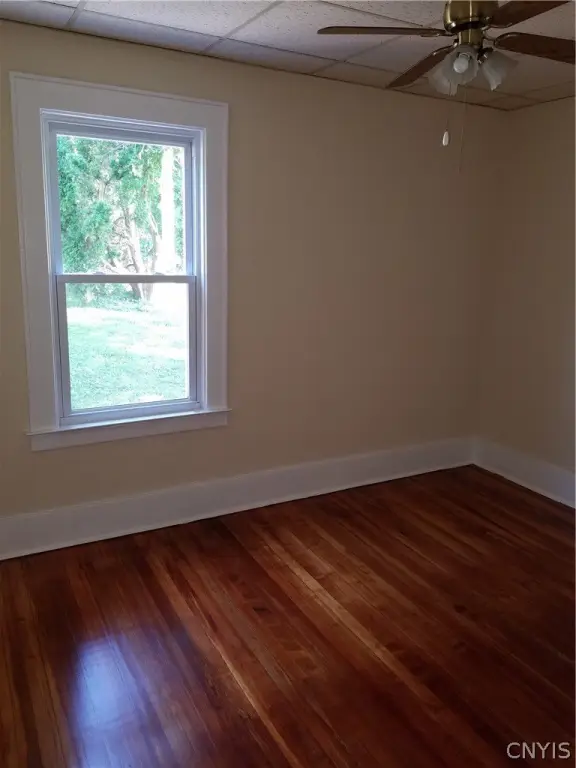
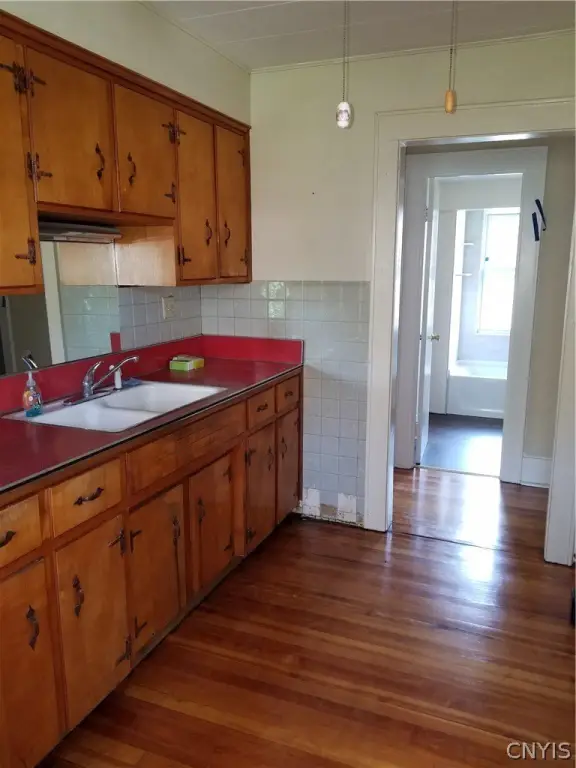
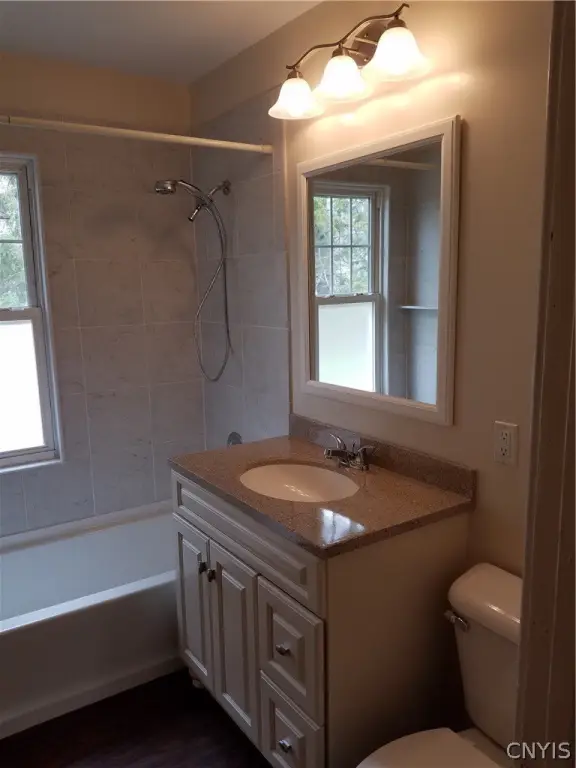
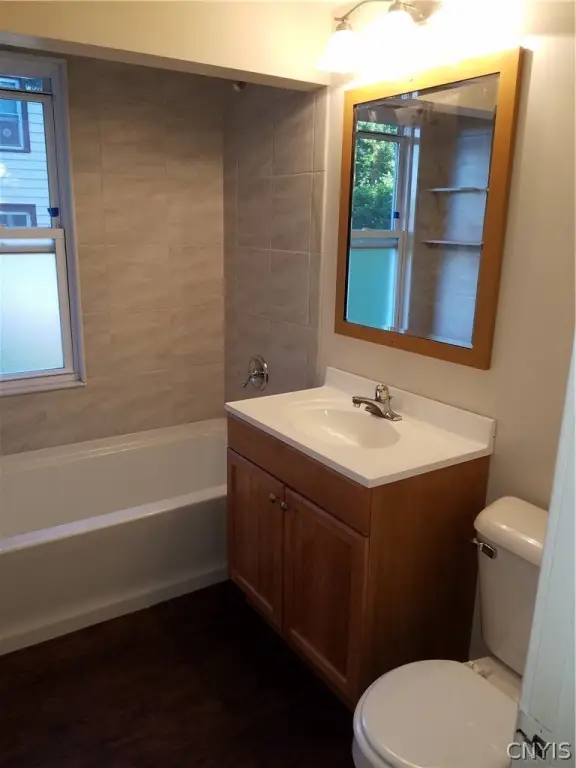
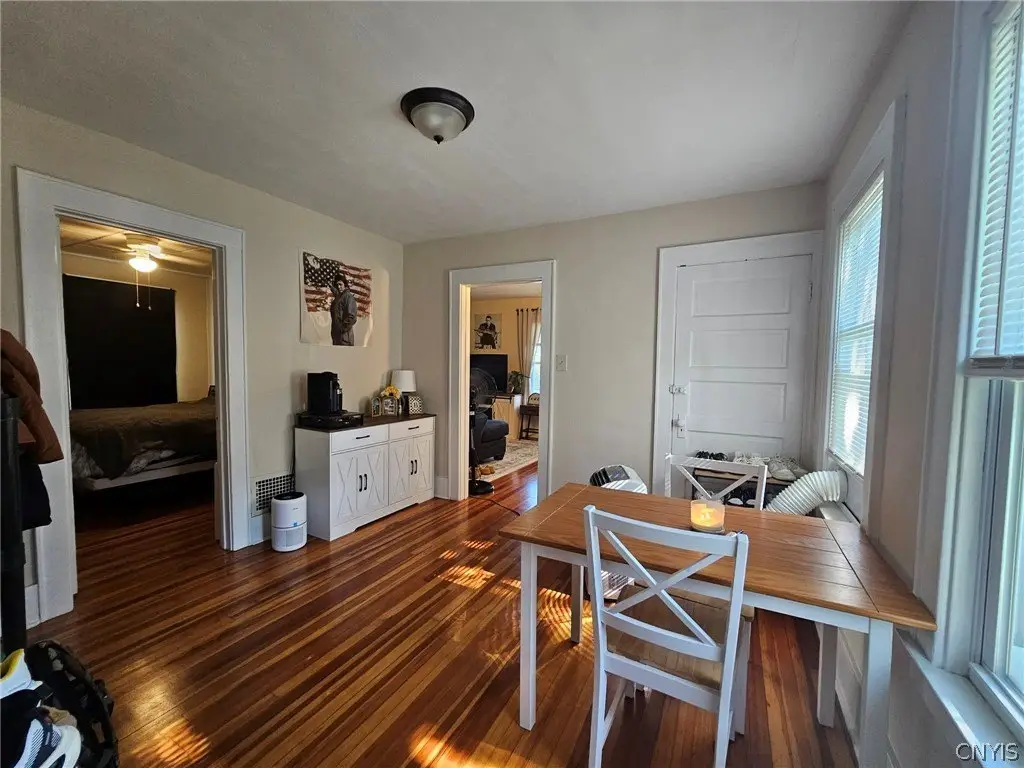
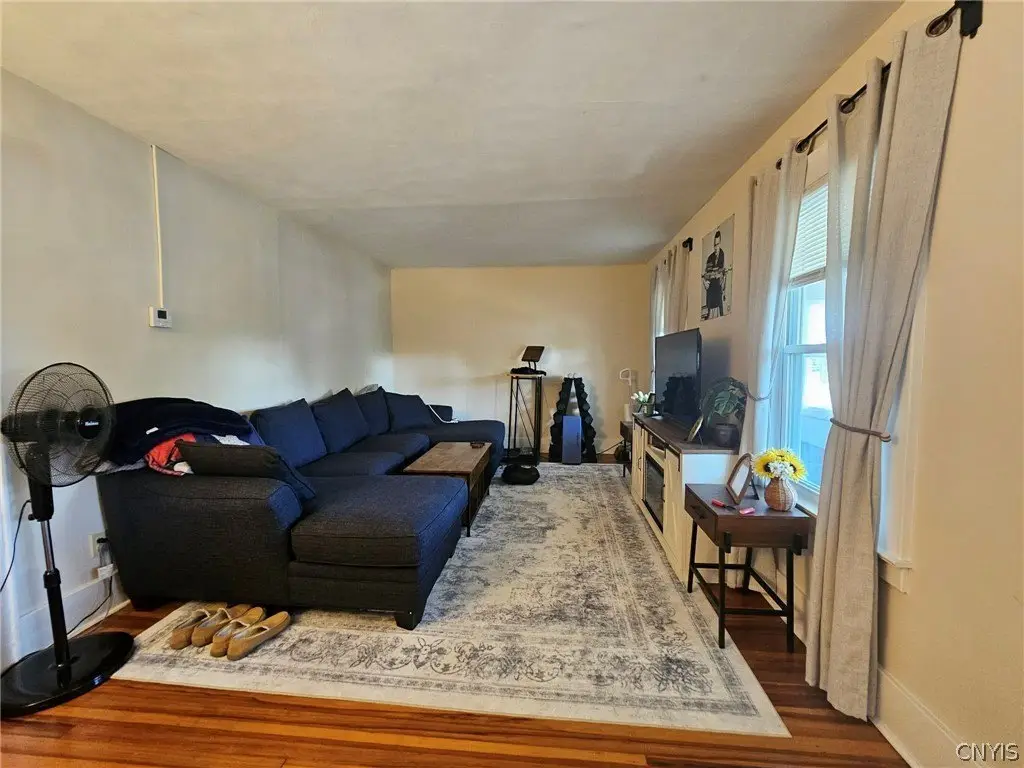
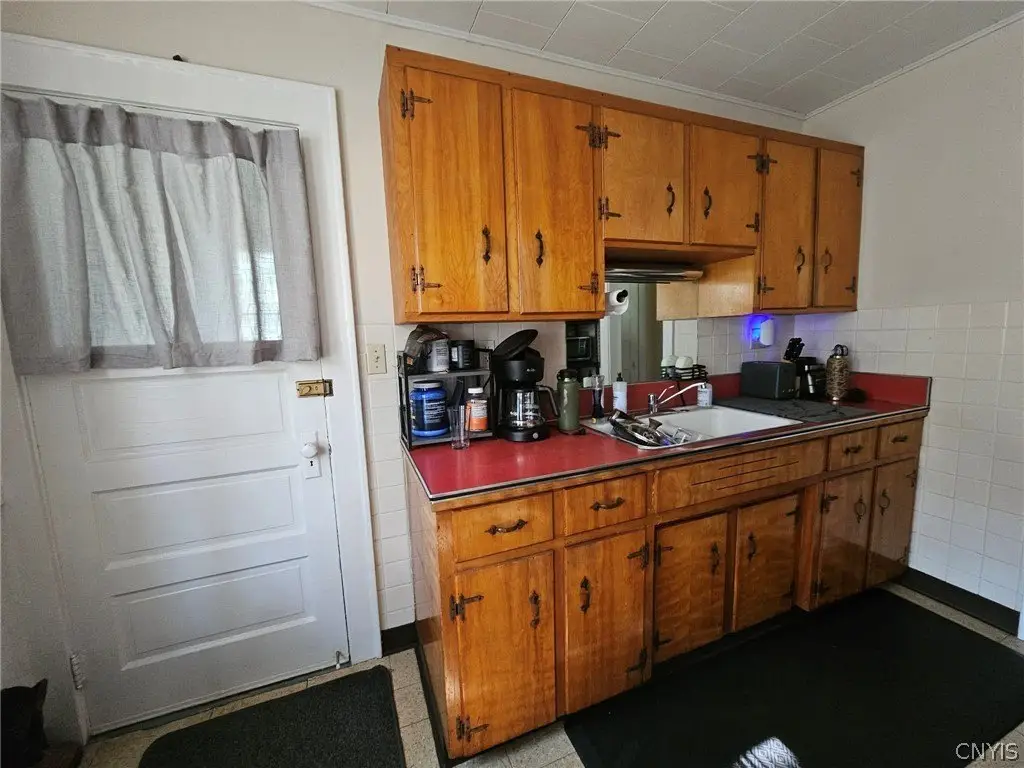
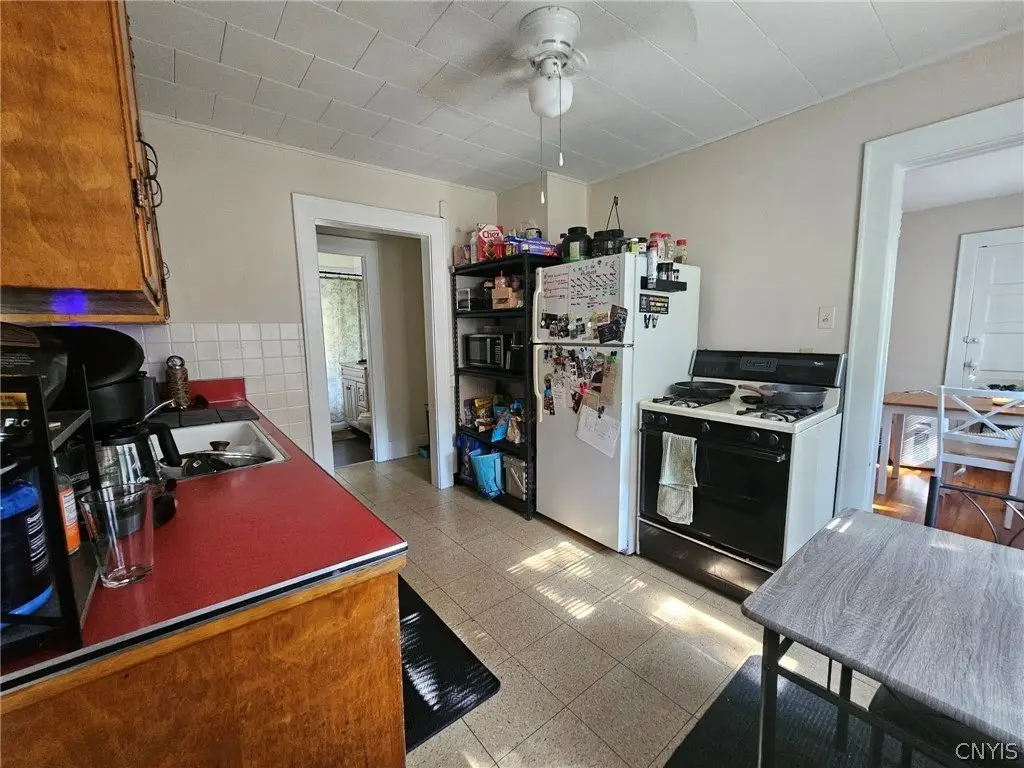
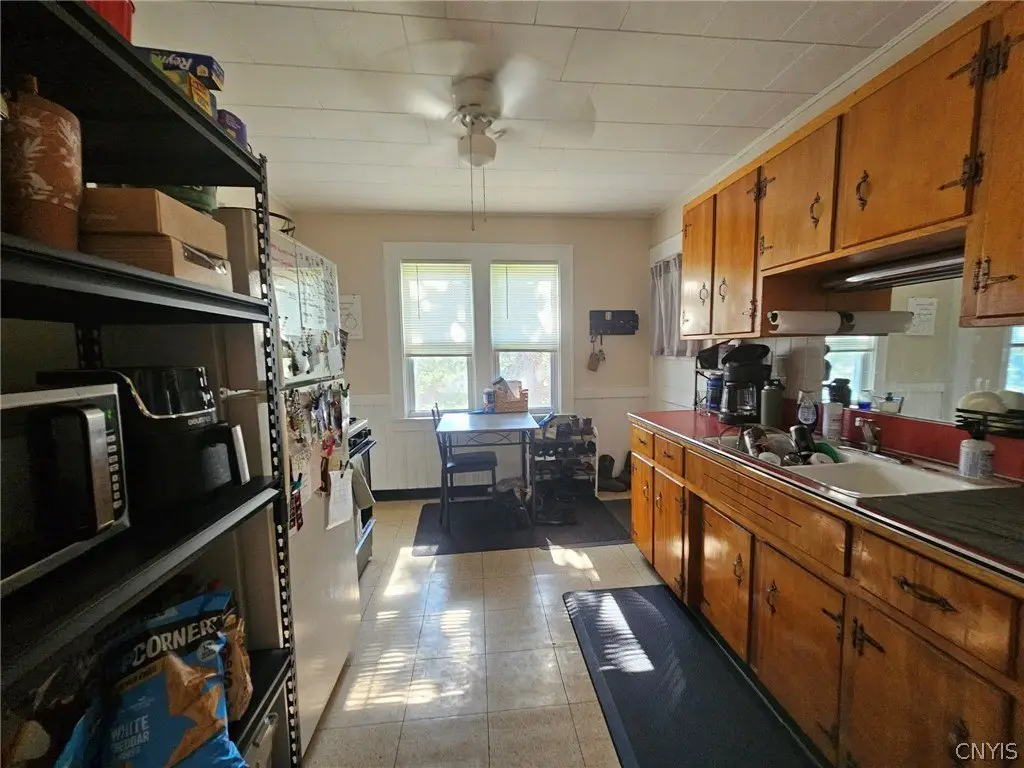
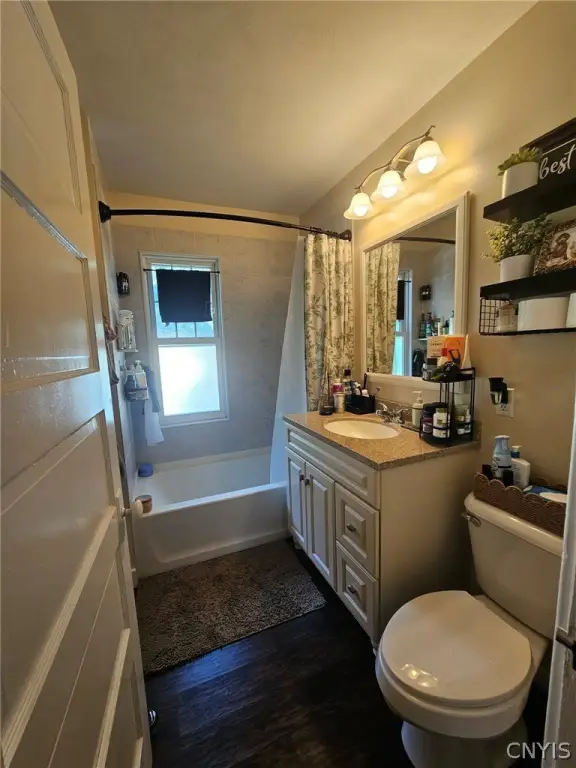
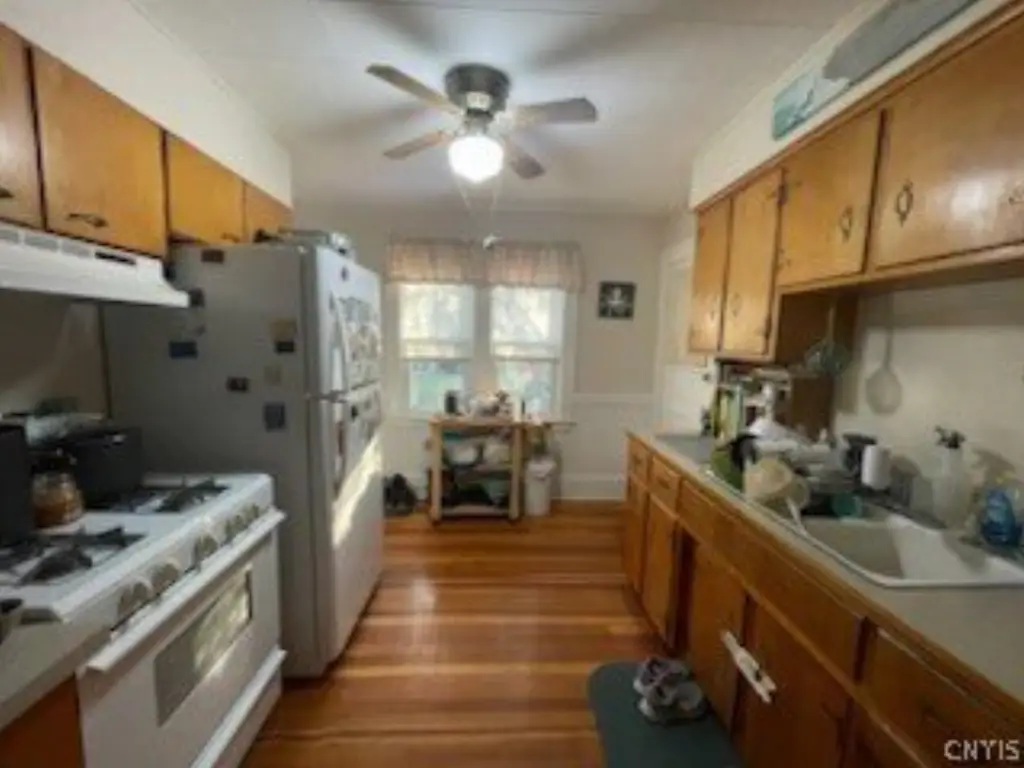
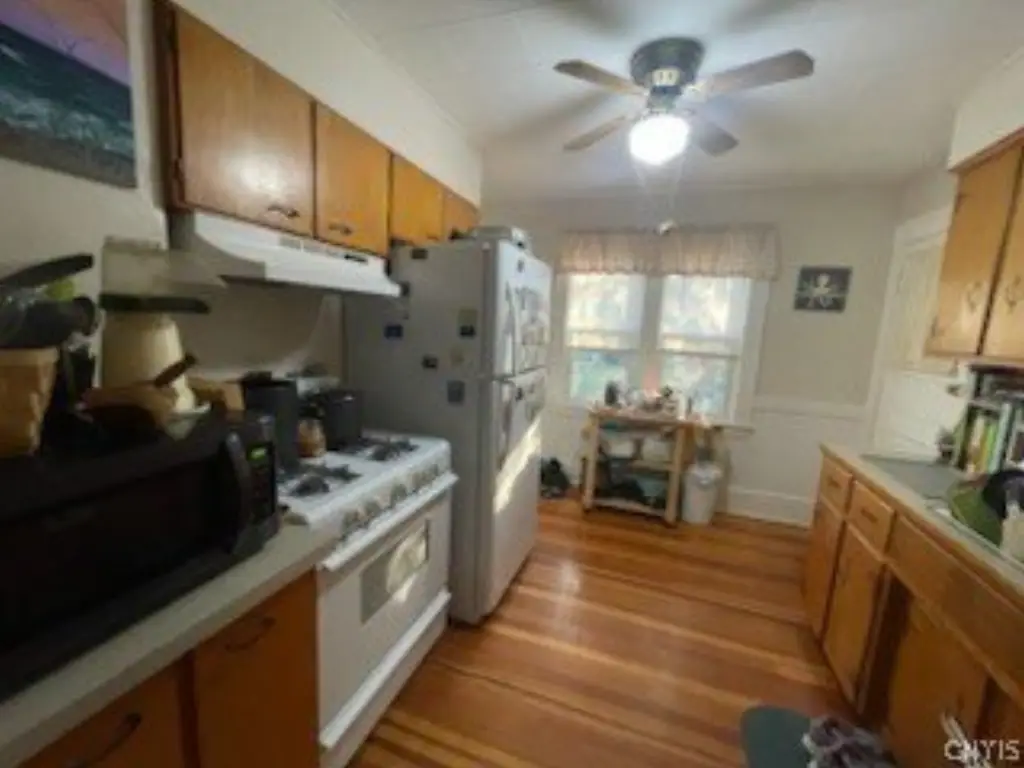
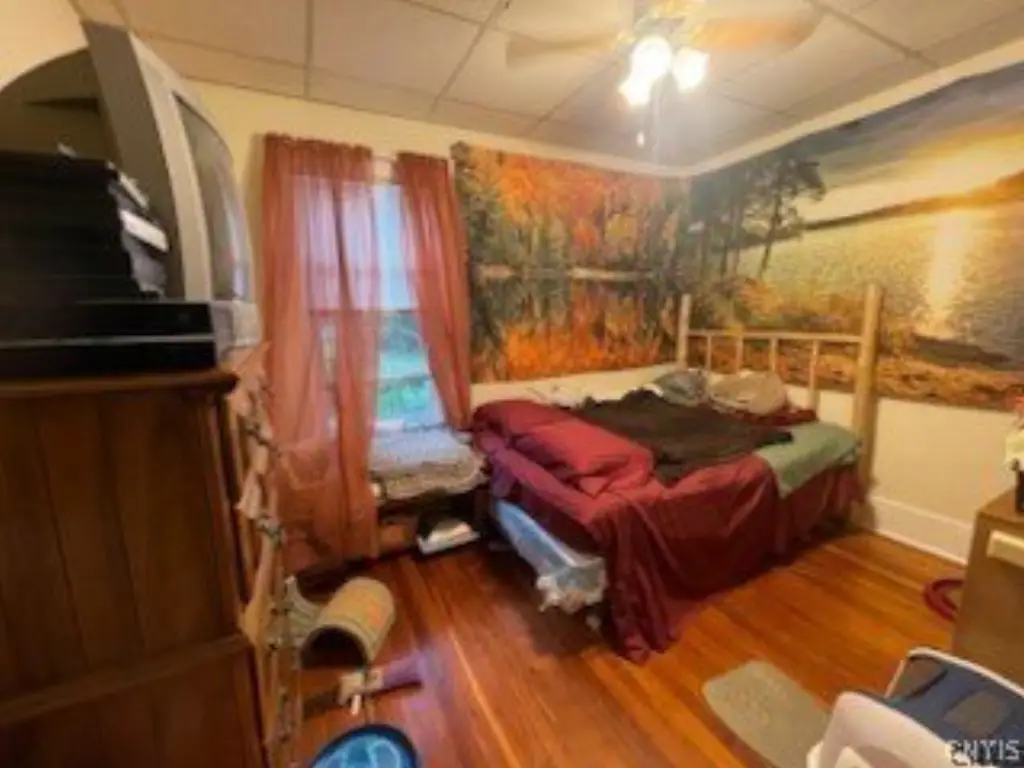
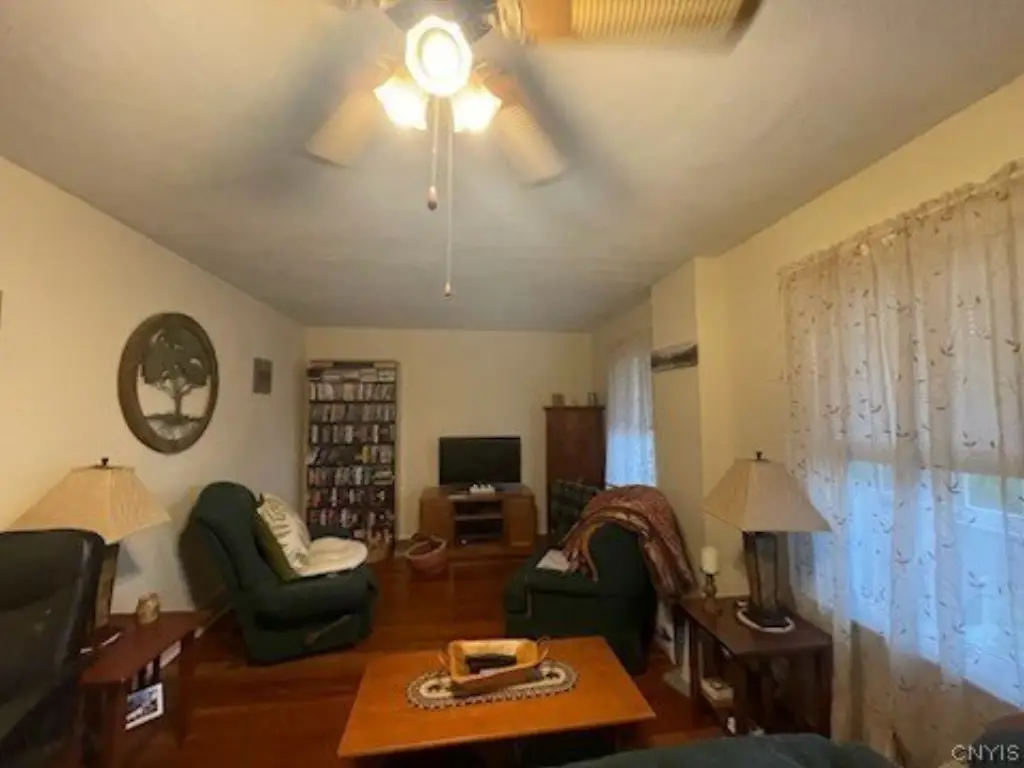
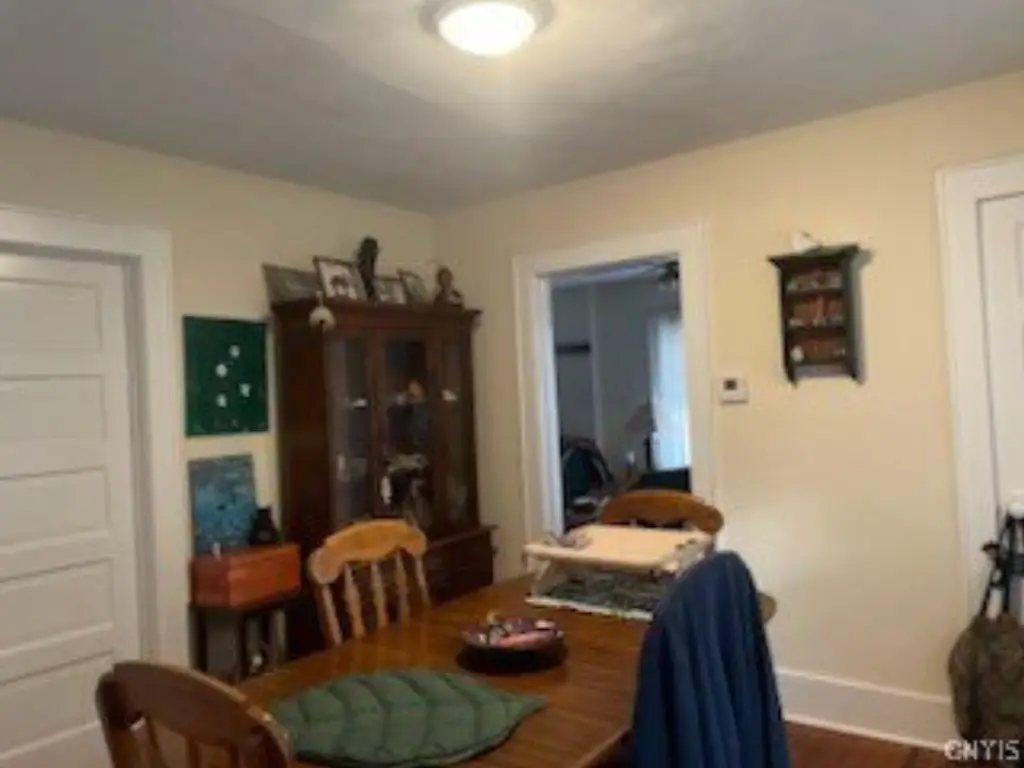
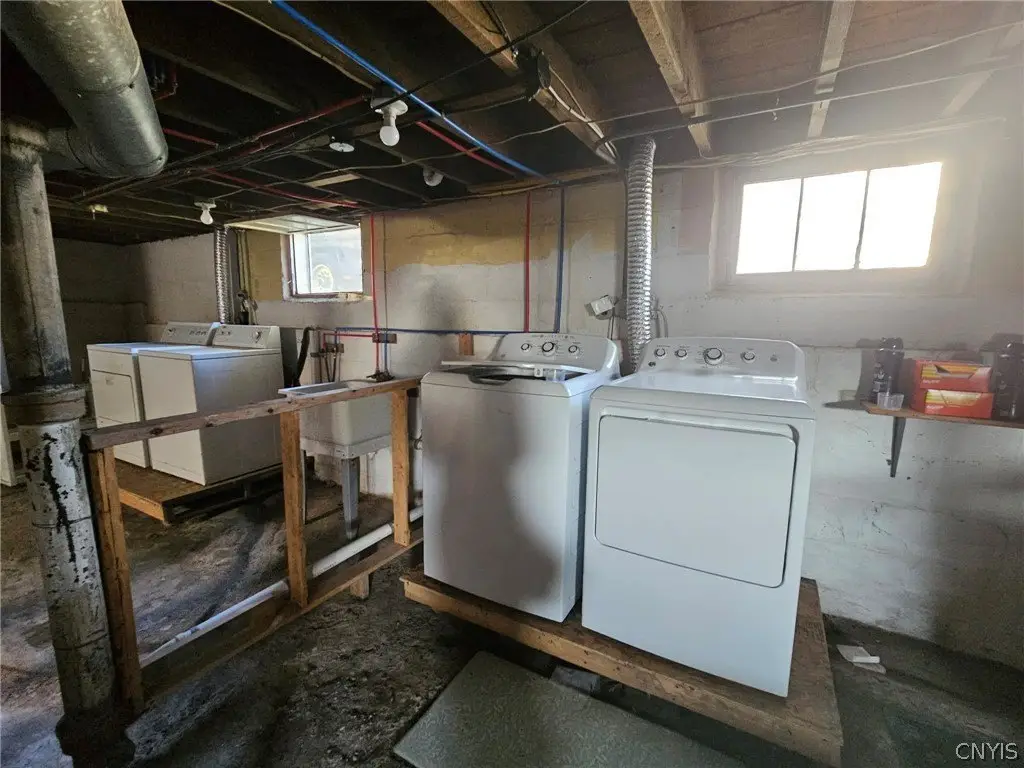
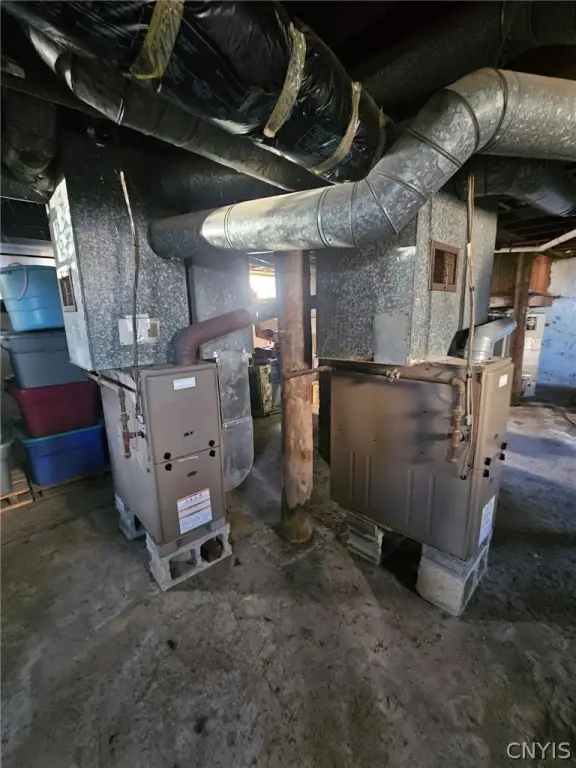
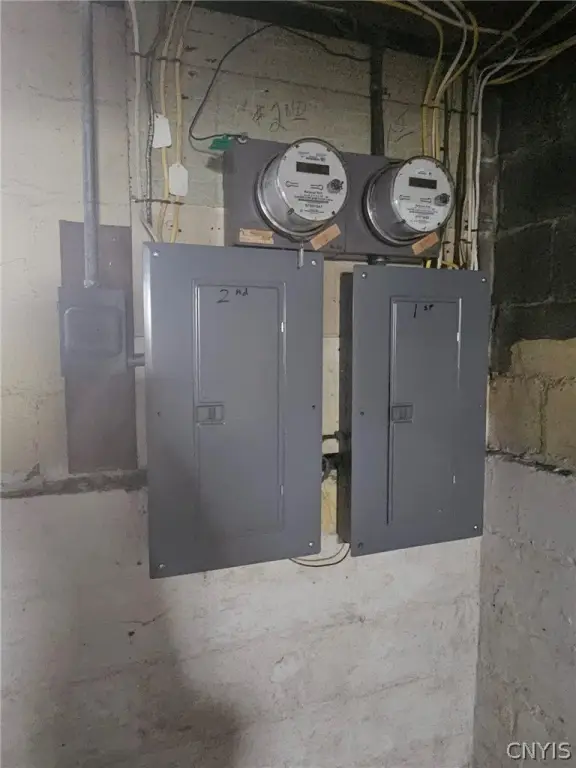
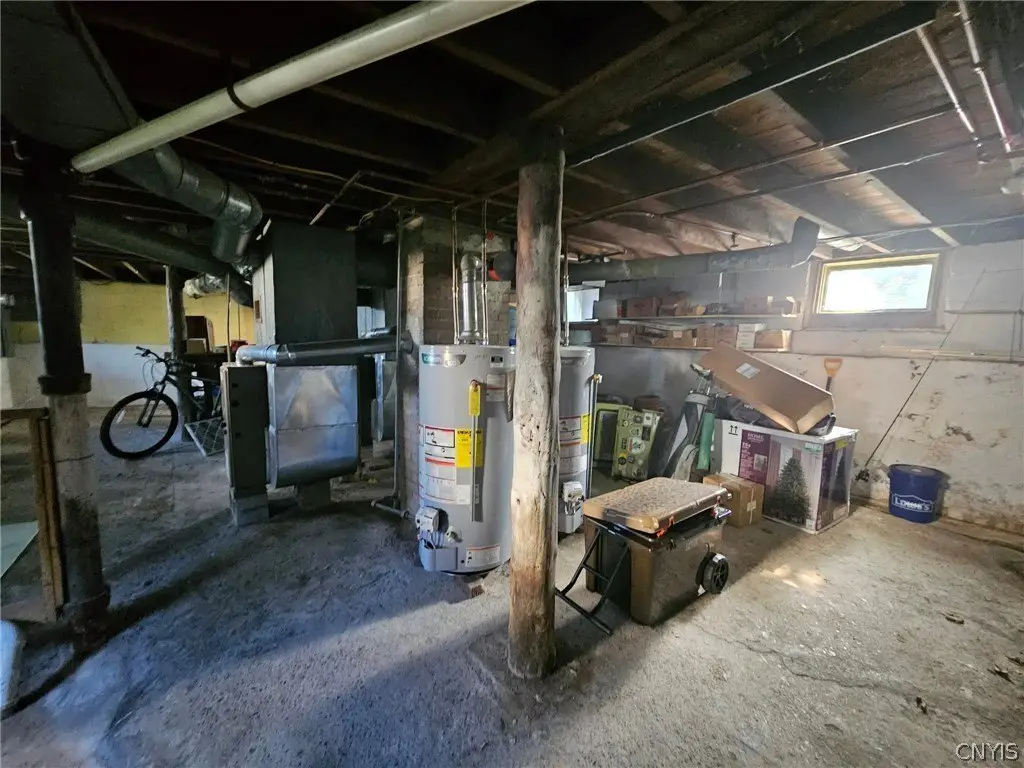
This 1,920-square-foot duplex, built in 1923, contains two matching two-bedroom residences with spacious rooms, original hardwood floors and trim, and enclosed sun porches. Both units are vacant and in turnover-ready condition. Each residence has its own laundry unit in the clean, dry basement. The roof, mechanical systems, plumbing, electrical work, and bathrooms have been replaced.
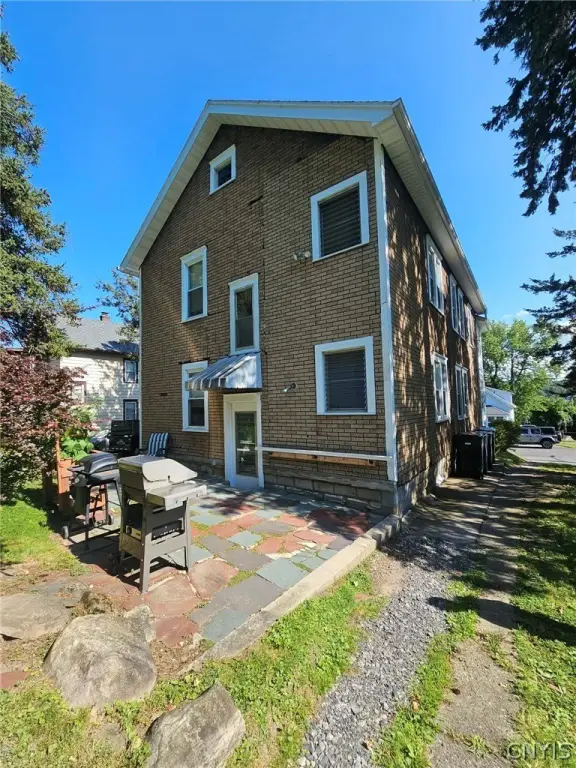
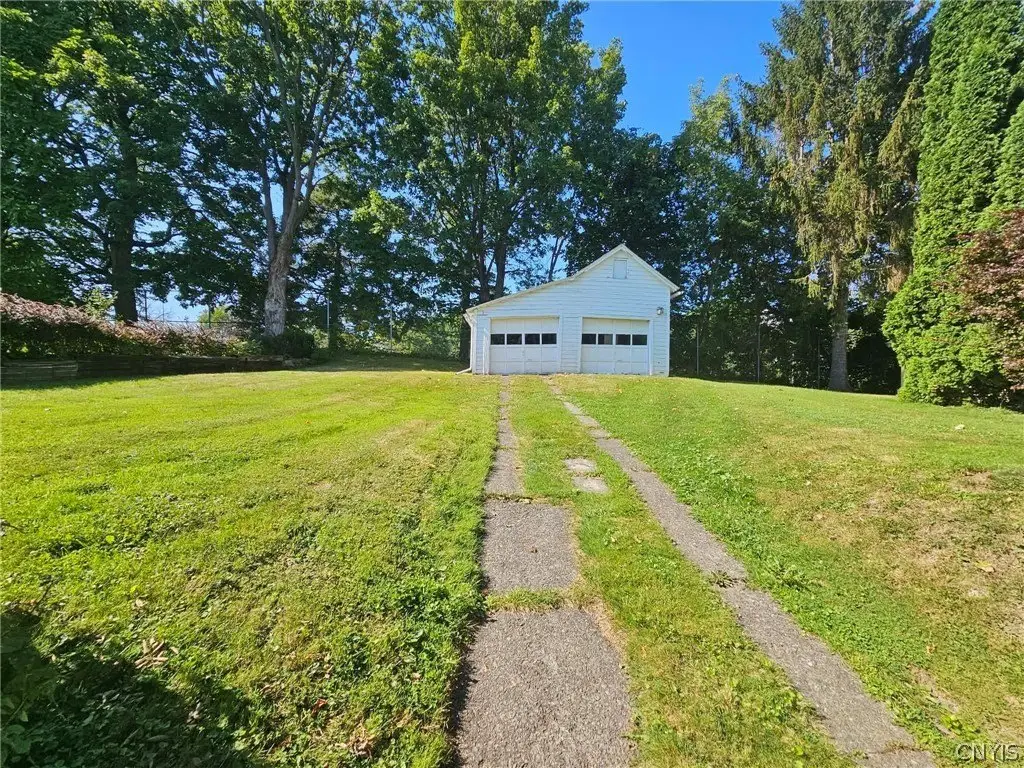
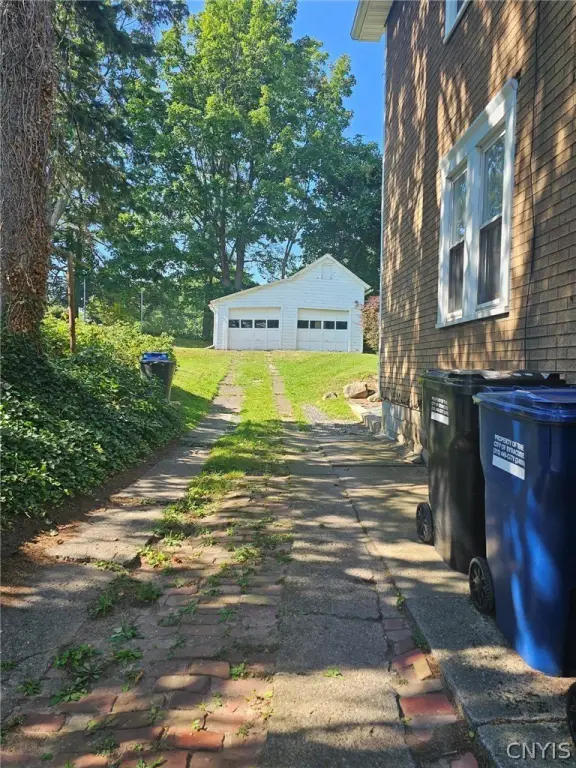
The property occupies a 0.2-acre double lot with an extended driveway, large two-bay garage, grassy yard, and paver patio. A fence separates the rear of the lot from the golf course. Located on a quiet dead-end street, the property provides access to I-690 and downtown Syracuse. Public water serves the building, which is constructed of brick and heated by forced air with natural gas.
The property occupies a 0.2-acre double lot with an extended driveway, large two-bay garage, grassy yard, and paver patio. A fence separates the rear of the lot from the golf course. Located on a quiet dead-end street, the property provides access to I-690 and downtown Syracuse. Public water serves the building, which is constructed of brick and heated by forced air with natural gas.
Key Highlights
- Two‑unit duplex with matching 2‑bedroom layouts
- 1,920 square feet on a 0.2‑acre double lot
- Roof, mechanicals, plumbing, electrical, and bathrooms replaced
Financial Insights
Estimated NOI and Cap Rate
NOI / Yr
$18,128
Cap Rate
8.64%
Suggested Prices Based on Cap Rates
Cap Rate 5%
$362,560
$362.6K
Cap Rate 7%
$258,971
$259.0K
Cap Rate 9%
$201,422
$201.4K
Market Conditions
NOI Build-Up for 1,920 SF
Gross rent
$35.3K $18.36/SF
− Vacancy
−$2.3K −$1.19/SF
EGI
$33.0K $17.17/SF
− OpEx
−$14.8K −$7.72/SF
NOI
$18.1K $9.44/SF
Area
Syracuse, NY
Vacancy
6.50%
Lease Rate
$18.36 /SF/Yr
Expense Ratio
45.00%
Simulate Cap Rate and NOI
Suggested Prices Based on Cap Rates
Cap Rate 5%
$362,560
Cap Rate 7%
$258,971
Cap Rate 9%
$201,422
Alternative Uses
Best Use
Multifamily LT 5
$291.8K
$255.4K – $340.5K
NOI $20,429 @ 7.0% cap · market cap 9.73%
Second Best
Apartment 5plus
$259.0K
$226.6K – $302.1K
NOI $18,128 @ 7.0% cap · market cap 8.64%
Theoretical Best
Office A
$333.7K
$292.0K – $389.3K
NOI $23,357 @ 7.0% cap · market cap 11.13%
Zoning and permitted uses should be independently verified with authorities.
Property Analytics
Unlock full access to Insights
Subscribe to Realmo Intelligence
Open Analytics
Current Use
Lease Details
2
Residential units
Yes
Highway access
Yes
Paved road access
Location Intelligence
Trade Area within ½ mile
560
Businesses Nearby
Explore this area
Business Placement
Demographics for 13206, NY
16,599
Population
8,460
Households
2
Avg Household Size
38
Median Age
27%
College-Educated
90%
High-School Grad
4.1 sq mi
ZIP Area
4,049
Density / Sq Mi
$60,314
Median Household Income
$40,429
Median Earnings
$952
Median Rent
$130,300
Median Home Value
Check the figures for this property
Cap Rate, Value Estimation, Potential NOI and more
View Realmo Analytics
Market
Vacancy Rate% for Multifamily in Northeast region

Questions? Ask Rey
Realmo’s AI knows this listing — price, zoning, demand, history. Ask anything.






Frequently Asked Questions
What type of property is this?
Duplex - Two vacant residences offer hardwood finishes, enclosed sun porches, and separate laundry units in the basement.
Where is this duplex located?
The property is located at 433 Vann Street Syracuse, NY.
What is the asking price?
The asking price for this property is $209,900.
What are key features of this property?
This property features: Two‑unit duplex with matching 2‑bedroom layouts; 1,920 square feet on a 0.2‑acre double lot; Roof, mechanicals, plumbing, electrical, and bathrooms replaced


