Updated Manufactured Home in
For Sale
$150,000
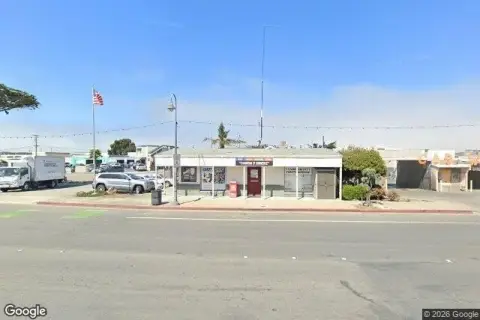
43-835 Kimball Ave, Seaside, CA 93955
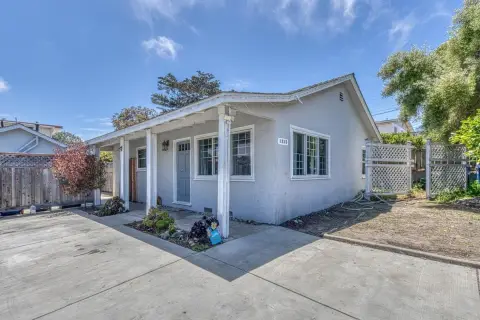
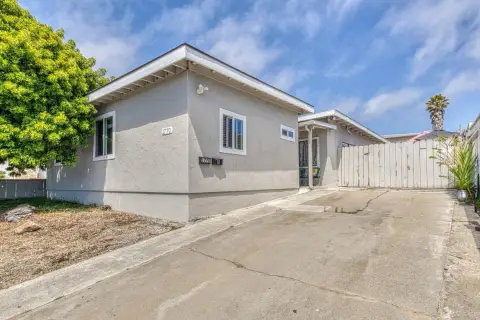
Manufactured home offers extensive interior refreshes, including new flooring, paint, lighting, and double-pane windows.
Property Size444 SF
Price / SF$337.84
Days on Market261
Property Features for 43-835 Kimball Ave
General Information
Standard status
Active
Size
444 SF
Property subtype
Manufactured In Park
Building Details
Year Built
1963
Listing Agency:
Bay Homes and Estates
(831) 521-2099
Listed By:
Ben Ottmar
(831) 601-1370
Source:
Exprealty
Added: Feb 2
Changed: Oct 13
Last Checked: Oct 21 at 1:52AM
Displayed information is deemed reliable but is not guaranteed and should be independently verified. All listing content including descriptions, pricing, images are the copyrighted material of Bay Homes and Estates

Ask AI about this property
Review the available facts, identify missing information and prepare questions for the agent.
Investment Insights
Based on property information with market context.
Unit 43 at 835 Kimball Avenue presents a well-cared-for manufactured home in the Green Parrot Mobile Home Park. Originally built in 1963, the interior has been substantially remodeled and positioned for move-in readiness. Updates include brand new drywall, new flooring throughout, fresh paint inside and out, and recessed lighting.
The kitchen has also been updated with new countertops. Additional improvements include newly added double-pane windows, designed to support improved comfort and energy efficiency.
Set within a quiet, welcoming park setting, this home is described as being close to local amenities, shopping, and the Central Coast shoreline.
The kitchen has also been updated with new countertops. Additional improvements include newly added double-pane windows, designed to support improved comfort and energy efficiency.
Set within a quiet, welcoming park setting, this home is described as being close to local amenities, shopping, and the Central Coast shoreline.
Key Highlights
- Manufactured home in Green Parrot Mobile Home Park in Seaside (Unit 43 at 835 Kimball Avenue)
- Substantially remodeled interior with new drywall, new flooring throughout, and fresh paint inside and out
- Updated lighting package with recessed lighting
Financial Insights
Estimated NOI and Cap Rate
NOI / Yr
$7,143
Cap Rate
4.76%
Suggested Prices Based on Cap Rates
Cap Rate 5%
$142,860
$142.9K
Cap Rate 7%
$102,043
$102.0K
Cap Rate 9%
$79,367
$79.4K
Market Conditions
NOI Build-Up for 444 SF
Gross rent
$13.3K $30.00/SF
− Vacancy
−$333 −$0.75/SF
EGI
$13.0K $29.25/SF
− OpEx
−$5.8K −$13.16/SF
NOI
$7.1K $16.09/SF
Area
Monterey County, CA
Vacancy
2.50%
Lease Rate
$30.00 /SF/Yr
Expense Ratio
45.00%
Simulate Cap Rate and NOI
Suggested Prices Based on Cap Rates
Cap Rate 5%
$142,860
Cap Rate 7%
$102,043
Cap Rate 9%
$79,367
Alternative Uses
Best Use
Apartment 5plus
$102.0K
$89.3K – $119.1K
NOI $7,143 @ 7.0% cap · market cap 4.76%
Second Best
—
—
no second resolved use
Theoretical Best
Specialty Retail
$169.5K
$148.3K – $197.8K
NOI $11,867 @ 7.0% cap · market cap 7.91%
Zoning and permitted uses should be independently verified with authorities.
How Realmo checks its estimates
Location Intelligence
Trade Area within ½ mile
1,049
Businesses Nearby
Explore this area
Business Placement
Demographics for 93955, CA
32,703
Population
11,150
Households
2.9
Avg Household Size
34
Median Age
28%
College-Educated
81%
High-School Grad
26.3 sq mi
ZIP Area
1,243
Density / Sq Mi
$82,331
Median Household Income
$35,488
Median Earnings
$2,312
Median Rent
$693,800
Median Home Value
Market
Vacancy Rate% for Multifamily in West region



Frequently Asked Questions
What type of property is this?
Mobile home & RV park - Manufactured home offers extensive interior refreshes, including new flooring, paint, lighting, and double-pane windows.
Where is this mobile home & rv park located?
The property is located at 43-835 Kimball Ave Seaside, CA.
What is the asking price?
The asking price for this property is $150,000.
What are key features of this property?
This property features: Manufactured home in Green Parrot Mobile Home Park in Seaside (Unit 43 at 835 Kimball Avenue); Substantially remodeled interior with new drywall, new flooring throughout, and fresh paint inside and out; Updated lighting package with recessed lighting


