Turn-Key Commercial Space in
For Sale
Contact for pricing
Pending
425 N Main St, Nixa, MO 65714
Updated commercial space in high-traffic Nixa location with private parking.
Property Size1,190 SF
Days on Market155
Property Features for 425 N Main St
General Information
Standard status
Pending
Size
1,190 SF
Property subtype
Retail, Office
Zoning
NC
Building Details
Year Built
1940
Listing Agency:
Massengale Group - Keller Williams - Nixa
Listed By:
Jason Massengale · License #MO 2015008583
(417) 883-4900
Source:
Crexi
Added: May 12
Changed: Oct 3
Last Checked: Oct 12 at 7:54PM
Displayed information is deemed reliable but is not guaranteed and should be independently verified. All listing content including descriptions, pricing, images are the copyrighted material of Massengale Group - Keller Williams - Nixa
Investment Insights
Based on property information with market context.
Located on North Main Street in Nixa, this updated commercial space is suitable for owners, entrepreneurs, and investors. The property benefits from high traffic, high visibility, and a Main Street address. The interior layout is flexible and can accommodate a professional office, boutique service, wellness practice, or client-facing business. The property includes a private parking lot. The frontage and easy access are designed to attract both foot traffic and drive-by attention. The property is move-in ready and located in a growing community. The property size is 1190 square feet.
Key Highlights
- Prime Main Street location with high traffic and visibility.
- Turn‑key and fully updated commercial space, ready for immediate occupancy.
- Private parking lot, a rare and valuable amenity for Main Street properties.**
Financial Insights
Estimated NOI and Cap Rate
NOI / Yr
$8,856
Cap Rate
2.81%
Suggested Prices Based on Cap Rates
Cap Rate 5%
$177,120
$177.1K
Cap Rate 7%
$126,514
$126.5K
Cap Rate 9%
$98,400
$98.4K
Market Conditions
NOI Build-Up for 1,190 SF
Gross rent
$13.1K $11.04/SF
− Vacancy
−$486 −$0.41/SF
EGI
$12.7K $10.63/SF
− OpEx
−$3.8K −$3.19/SF
NOI
$8.9K $7.44/SF
Area
Christian County, MO
Vacancy
3.70%
Lease Rate
$11.04 /SF/Yr
Expense Ratio
30.00%
Simulate Cap Rate and NOI
Suggested Prices Based on Cap Rates
Cap Rate 5%
$177,120
Cap Rate 7%
$126,514
Cap Rate 9%
$98,400
Alternative Uses
Best Use
Retail
$126.5K
$110.7K – $147.6K
NOI $8,856 @ 7.0% cap · market cap 2.81%
Second Best
—
—
no second resolved use
Theoretical Best
Office A
$179.6K
$157.2K – $209.6K
NOI $12,573 @ 7.0% cap · market cap 3.99%
Zoning and permitted uses should be independently verified with authorities.
How Realmo checks its estimates
Property Analytics
Unlock full access to Insights
Subscribe to Realmo Intelligence
Open Analytics
Current Use
Location Intelligence
Trade Area within ½ mile
571
Businesses Nearby
Balanced
Demand for This Use
Explore this area
Business Placement
Demographics for 65714, MO
35,109
Population
13,459
Households
2.6
Avg Household Size
39
Median Age
37%
College-Educated
94%
High-School Grad
51.1 sq mi
ZIP Area
687
Density / Sq Mi
$82,548
Median Household Income
$46,746
Median Earnings
$985
Median Rent
$261,300
Median Home Value
Check the figures for this property
Cap Rate, Value Estimation, Potential NOI and more
View Realmo Analytics
Market
Vacancy Rate% for Retail in Midwest region

Questions? Ask Rey
Realmo’s AI knows this listing — price, zoning, demand, history. Ask anything.
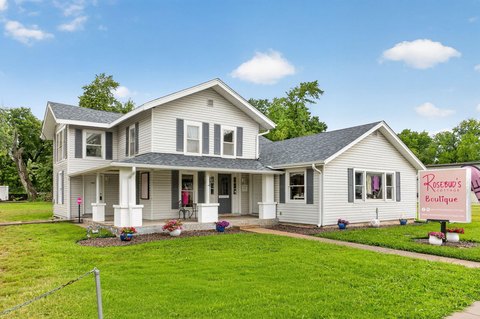


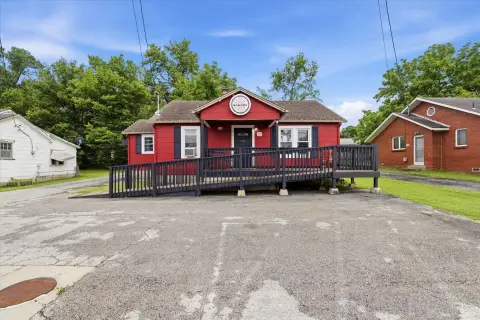

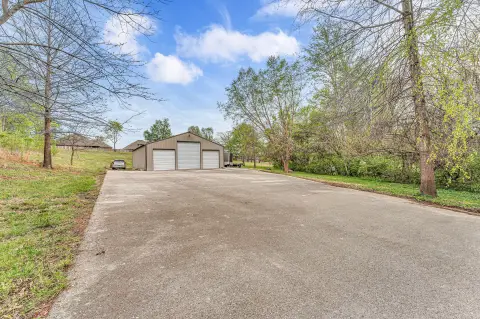

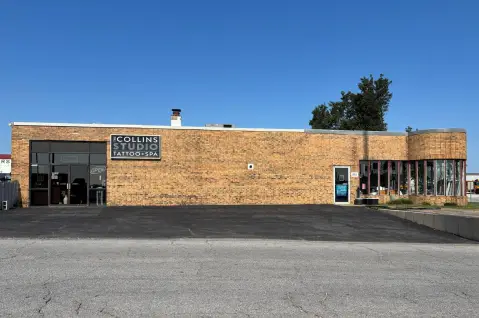

Similar Off Market Nearby
- Ladybug Floral — 123 S Main St, Nixa, MO 65714
- Moxie Flowers & More — 104 E Mt Vernon St, Nixa, MO 65714
- Lilly's Floral — 400 N Massey Blvd, Nixa, MO 65714
Frequently Asked Questions
What type of property is this?
Storefront property - Updated commercial space in high-traffic Nixa location with private parking.
Where is this storefront property located?
The property is located at 425 N Main St Nixa, MO.
What is the asking price?
The asking price for this property is $315,000.
What are key features of this property?
This property features: Prime Main Street location with high traffic and visibility.; Turn‑key and fully updated commercial space, ready for immediate occupancy.; Private parking lot, a rare and valuable amenity for Main Street properties.**


