Remodeled Waterfront
For Sale
$1,200,000
4242 Laguna Shores, Corpus Christi, TX 78418
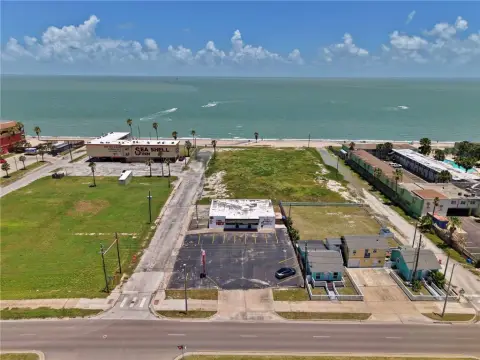
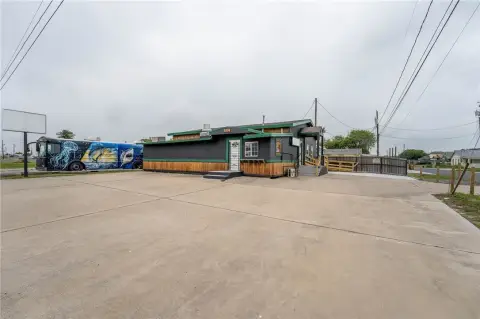
Covered deck overlooks the Intracoastal Waterway and supports outdoor dining.
Property Size3,000 SF
Days on Market224
Property Features for 4242 Laguna Shores
General Information
Standard status
Active
Size
3,000 SF
Property subtype
Business
Additional Details
Patio
Yes
Building Details
Building Size
3,000 SF
Year Built
2005
Listing Agency:
Mirabal Montalvo & Associates
Listed By:
Chris Montalvo · License #0528565
(361) 765-1725
Source:
National-onerealty
Added: Mar 10
Changed: Oct 4
Last Checked: Oct 16 at 4:29PM
Displayed information is deemed reliable but is not guaranteed and should be independently verified. All listing content including descriptions, pricing, images are the copyrighted material of Mirabal Montalvo & Associates

Ask AI about this property
Review the available facts, identify missing information and prepare questions for the agent.
Investment Insights
Based on property information with market context.
This conventional restaurant was built in 2005 and has been remodeled for continued daily service. The interior includes updated dining space, large windows, and multiple seating areas that bring natural light into the operation while maintaining views of the waterfront. A covered outdoor deck extends the seating capacity and provides a separate setting for guests overlooking the Intracoastal Waterway.
The property is located at 4242 Laguna Shores in Corpus Christi, Texas. Its indoor and outdoor configuration supports regular restaurant service as well as private events, parties, and other reserved gatherings. Passing boats and the direct waterfront setting add a distinctive coastal backdrop for dining and functions.
The property is located at 4242 Laguna Shores in Corpus Christi, Texas. Its indoor and outdoor configuration supports regular restaurant service as well as private events, parties, and other reserved gatherings. Passing boats and the direct waterfront setting add a distinctive coastal backdrop for dining and functions.
Key Highlights
- Directly positioned on the Intracoastal Waterway
- Remodeled interior dining area with large windows
- Covered outdoor deck overlooking the water
Financial Insights
Estimated NOI and Cap Rate
NOI / Yr
$39,960
Cap Rate
3.33%
Suggested Prices Based on Cap Rates
Cap Rate 5%
$799,200
$799.2K
Cap Rate 7%
$570,857
$570.9K
Cap Rate 9%
$444,000
$444.0K
Market Conditions
NOI Build-Up for 3,000 SF
Gross rent
$57.6K $19.20/SF
− Vacancy
−$4.3K −$1.44/SF
EGI
$53.3K $17.76/SF
− OpEx
−$13.3K −$4.44/SF
NOI
$40.0K $13.32/SF
Area
ZIP 78418
Vacancy
7.50%
Lease Rate
$19.20 /SF/Yr
Expense Ratio
25.00%
Simulate Cap Rate and NOI
Suggested Prices Based on Cap Rates
Cap Rate 5%
$799,200
Cap Rate 7%
$570,857
Cap Rate 9%
$444,000
Alternative Uses
Best Use
Specialty Retail
$570.9K
$499.5K – $666.0K
NOI $39,960 @ 7.0% cap · market cap 3.33%
Second Best
—
—
no second resolved use
Theoretical Best
Office A
$1.15M
$1.00M – $1.34M
NOI $80,278 @ 7.0% cap · market cap 6.69%
Zoning and permitted uses should be independently verified with authorities.
How Realmo checks its estimates
Property Analytics
Unlock full access to Insights
Subscribe to Realmo Intelligence
Open Analytics
Current Use
Location Intelligence
Trade Area within ½ mile
45
Businesses Nearby
Balanced
Demand for This Use
Explore this area
Business Placement
Demographics for 78418, TX
31,787
Population
16,171
Households
2
Avg Household Size
42
Median Age
33%
College-Educated
91%
High-School Grad
73.3 sq mi
ZIP Area
434
Density / Sq Mi
$91,443
Median Household Income
$51,914
Median Earnings
$1,301
Median Rent
$274,800
Median Home Value
Check the figures for this property
Cap Rate, Value Estimation, Potential NOI and more
View Realmo Analytics
Market
Vacancy Rate% for Retail in South region



Frequently Asked Questions
What type of property is this?
Conventional restaurant - Covered deck overlooks the Intracoastal Waterway and supports outdoor dining.
Where is this conventional restaurant located?
The property is located at 4242 Laguna Shores Corpus Christi, TX.
What is the asking price?
The asking price for this property is $1,200,000.
What are key features of this property?
This property features: Directly positioned on the Intracoastal Waterway; Remodeled interior dining area with large windows; Covered outdoor deck overlooking the water


