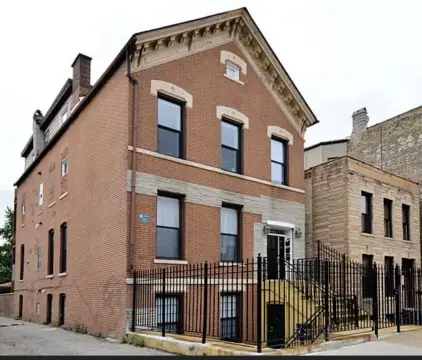
Bronzeville New Construction Triplex
For Sale
Contact for pricing
4153 S Prairie Ave, Chicago, IL 60653
Three fully leased, new construction triplexes in Bronzeville.
Property Size4,500 SF
Price / SF$216.67
Days on Market220
Property Features for 4153 S Prairie Ave
General Information
Standard status
Active
Size
4,500 SF
Class
A
Property subtype
Multifamily
Occupancy
100%
Investment Type
Stabilized
Net Operating Income
$196,454
Building Details
Year Built
2024
Buildings
3
Stories
3
Units
3
Listing Agency:
KWILL RE LLC
Listed By:
John Coleman · License #471006619
Source:
Crexi
Added: Feb 27
Changed: Sep 25
Last Checked: Oct 5 at 5:33PM
Displayed information is deemed reliable but is not guaranteed and should be independently verified. All listing content including descriptions, pricing, images are the copyrighted material of KWILL RE LLC
Investment Insights
Based on property information with market context.
Three newly constructed triplexes are located at 4153, 4155, and 4157 S Prairie Avenue, offering a stabilized investment opportunity in Bronzeville. Each building, constructed between 2023 and 2024, features three modern 3-bedroom, 2-bathroom units. Units include in-unit laundry, enclosed parking, and contemporary finishes. The properties are fully leased and performing, providing immediate cash flow. In-place rents are at or below comparable properties. Bronzeville is a rapidly appreciating neighborhood ten minutes south of Downtown, situated along Chicago’s Lakefront and blocks away from Washington Park, cultural landmarks, and public transportation. It is bordered by Kenwood and Hyde Park, home to the University of Chicago. The property size is 4500 square feet.
Key Highlights
- Immediate cash flow from 100% occupied units.
- New construction (2023‑2024) minimizes capital requirements.
- In‑place rents are below market, offering immediate rent growth potential.
Financial Insights
Estimated NOI and Cap Rate
NOI / Yr
$75,014
Cap Rate
7.69%
Suggested Prices Based on Cap Rates
Cap Rate 5%
$1,500,280
$1.5M
Cap Rate 7%
$1,071,629
$1.1M
Cap Rate 9%
$833,489
$833.5K
Market Conditions
NOI Build-Up for 4,500 SF
Gross rent
$113.4K $25.20/SF
− Vacancy
−$6.2K −$1.39/SF
EGI
$107.2K $23.81/SF
− OpEx
−$32.1K −$7.14/SF
NOI
$75.0K $16.67/SF
Area
Chicago, IL
Vacancy
5.50%
Lease Rate
$25.20 /SF/Yr
Expense Ratio
30.00%
Simulate Cap Rate and NOI
Suggested Prices Based on Cap Rates
Cap Rate 5%
$1,500,280
Cap Rate 7%
$1,071,629
Cap Rate 9%
$833,489
Alternative Uses
Best Use
Multifamily LT 5
$1.07M
$937.7K – $1.25M
NOI $75,014 @ 7.0% cap · market cap 7.69%
Second Best
Apartment 5plus
$985.4K
$862.3K – $1.15M
NOI $68,981 @ 7.0% cap · market cap 7.07%
Theoretical Best
Office A
$2.12M
$1.86M – $2.48M
NOI $148,522 @ 7.0% cap · market cap 15.23%
Zoning and permitted uses should be independently verified with authorities.
Property Analytics
Unlock full access to Insights
Subscribe to Realmo Intelligence
Open Analytics
Current Use
Location Intelligence
Trade Area within ½ mile
972
Businesses Nearby
Explore this area
Business Placement
Demographics for 60653, IL
33,146
Population
18,279
Households
1.8
Avg Household Size
37
Median Age
38%
College-Educated
90%
High-School Grad
2.4 sq mi
ZIP Area
13,811
Density / Sq Mi
$39,565
Median Household Income
$49,335
Median Earnings
$856
Median Rent
$347,800
Median Home Value
Check the figures for this property
Cap Rate, Value Estimation, Potential NOI and more
View Realmo Analytics
Market
Vacancy Rate% for Multifamily in Midwest region

Questions? Ask Rey
Realmo’s AI knows this listing — price, zoning, demand, history. Ask anything.




Frequently Asked Questions
What type of property is this?
Triplex - Three fully leased, new construction triplexes in Bronzeville.
Where is this triplex located?
The property is located at 4153 S Prairie Ave Chicago, IL.
What is the asking price?
The asking price for this property is $975,000.
What are key features of this property?
This property features: Immediate cash flow from 100% occupied units.; New construction (2023‑2024) minimizes capital requirements.; In‑place rents are below market, offering immediate rent growth potential.



