Historic Four-Unit
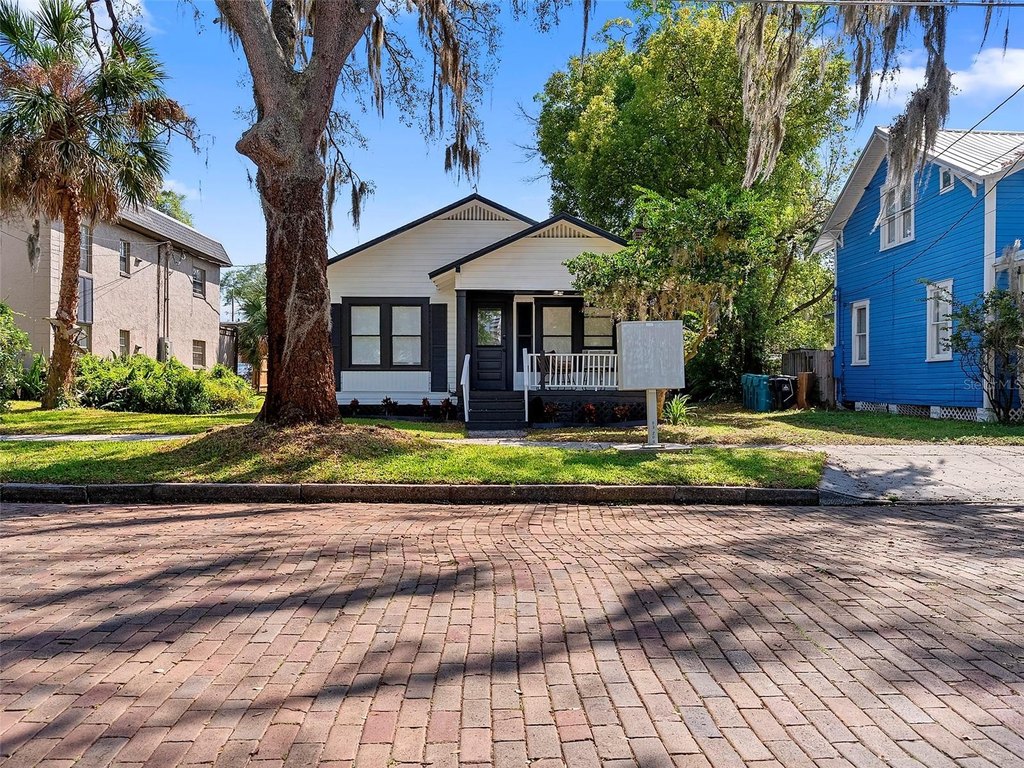
For Sale
$899,900
412 E HARWOOD Street, Orlando, FL 32803
Residential Income, ORLANDO, FL
Property Size1,886 SF
Lot Size0.18 Acres
Price / SF$477.15
Days on Market235
Property Features for 412 E HARWOOD Street
General Information
Property type
Residential Multi Family
Property subtype
Quadruplex
Zoning
R2
Parking features
Driveway
Pets allowed
Cats OK, Dogs OK
Interior features
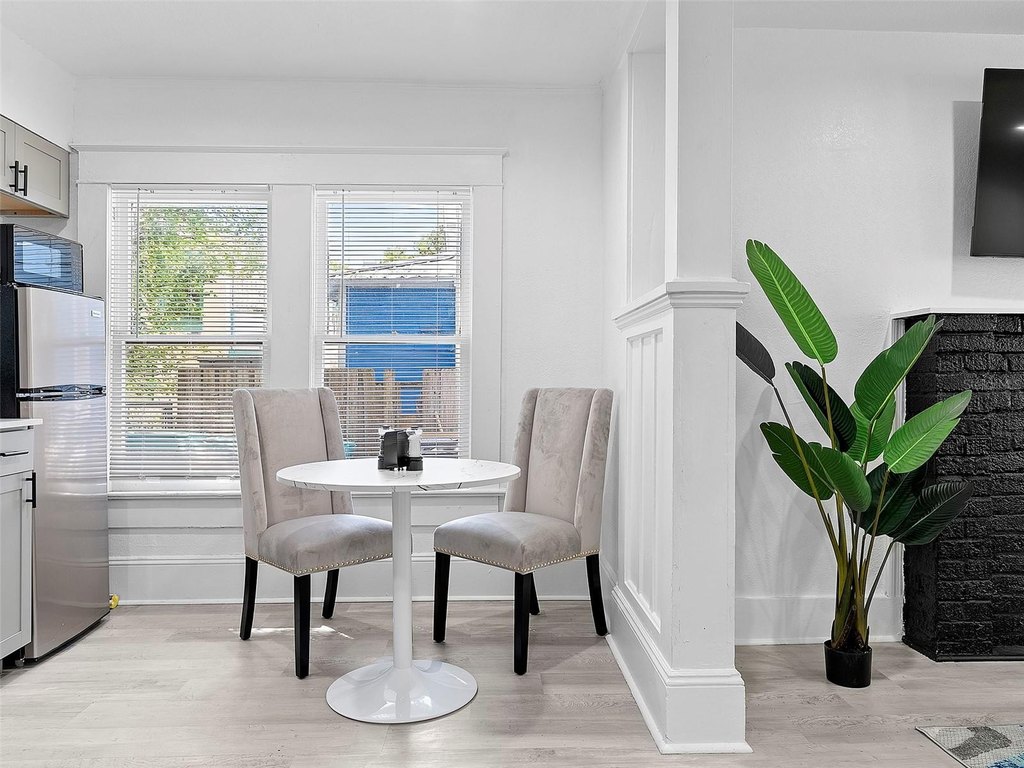
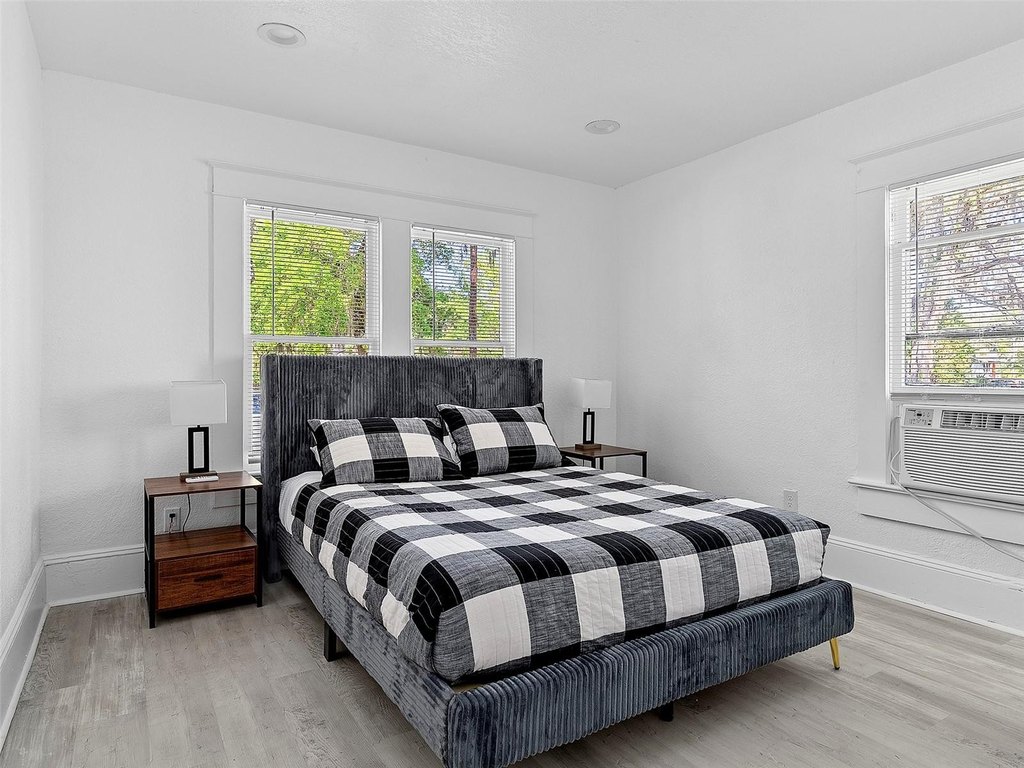
Open Floorplan, Primary Bedroom Main Floor
Exterior features
Courtyard
Fireplace
1
Appliances
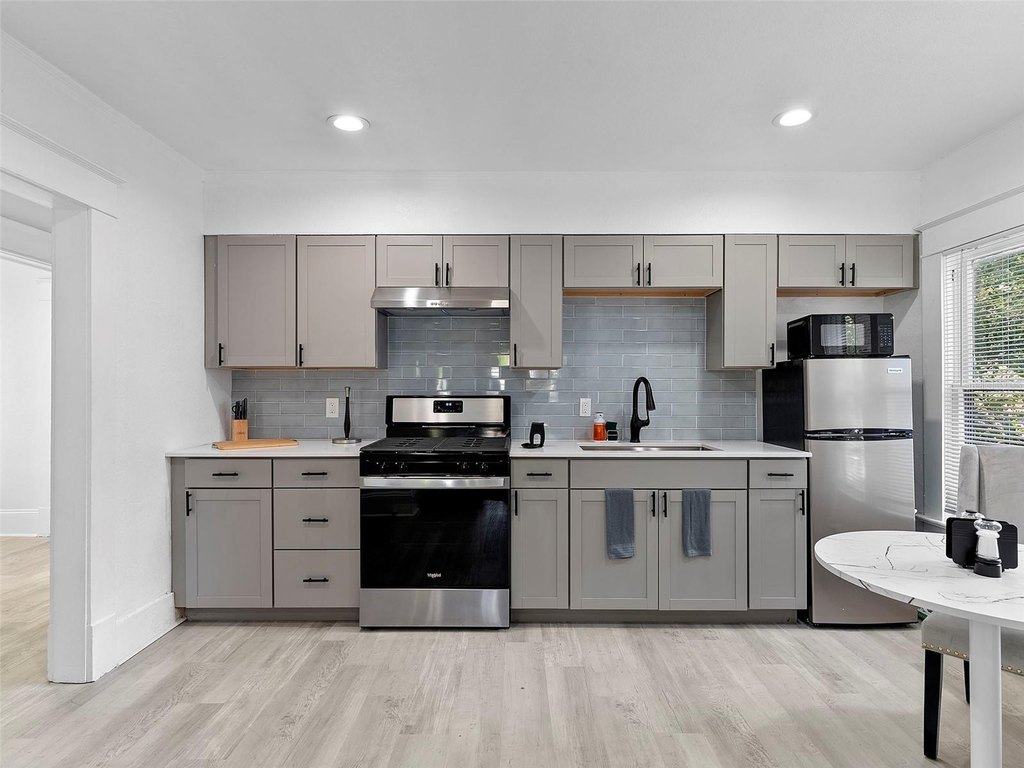
Microwave, Refrigerator
Subdivision
BEG 138 FT E OF SE COR BROADWAY & HARWOOD RUN E 62
Elementary school
Lake Como Elem
Middle school
Howard Middle
High school
Edgewater High
Directions
Turn right onto FL-436/S Semoran Blvd, Slight right to merge onto FL-408 W toward Downtown/Orlando, Keep left to stay on FL-408 W, Use the right 2 lanes to take exit 11A for FL-15 toward Rosalind Avenue, Use the right lane to turn left onto E South St, Turn right onto S Rosalind Ave, Turn right onto E Robinson St, Continue on Broadway Ave. Drive to Harwood St, Turn left onto Broadway Ave, Turn right at the 3rd cross street onto Harwood St.
Standard status
Active
APN
25-22-29-0000-00-047
Size
1,886 SF
Lot size
0.18 Acres
Taxes and HOA fees
Tax Year
2024
Tax Description
BEG 138 FT E OF SE COR BROADWAY & HARWOOD RUN E 62 FT S 126 FT W 62 FT N 126 FT TO POB IN SEC 25-22-29
Tax Annual Amount
10217
Legal Description
BEG 138 FT E OF SE COR BROADWAY & HARWOOD RUN E 62 FT S 126 FT W 62 FT N 126 FT TO POB IN SEC 25-22-29
Utilities
Sewer type
Public Sewer
Heating system
Central
Cooling system
Central Air
Water source
Public
Building Details
Year built
1920
Floors in Building
1
Number of units
4
Flooring type
Vinyl
Building materials
Stucco
Roof type
Shake
Listing Agency:
LPT REALTY, LLC
(877) 366-2213
Listed By:
Andres Ospina Rivera · License #3293879
(321) 821-8446
Added: Feb 21
Changed: Oct 1
Last Checked: Oct 14 at 4:06PM
MLS# O6384540
Copyright © 2026 Stellar MLS. All rights reserved. All information provided by the listing agent/broker is deemed reliable but is not guaranteed and should be independently verified.
Investment Insights
Based on property information with market context.
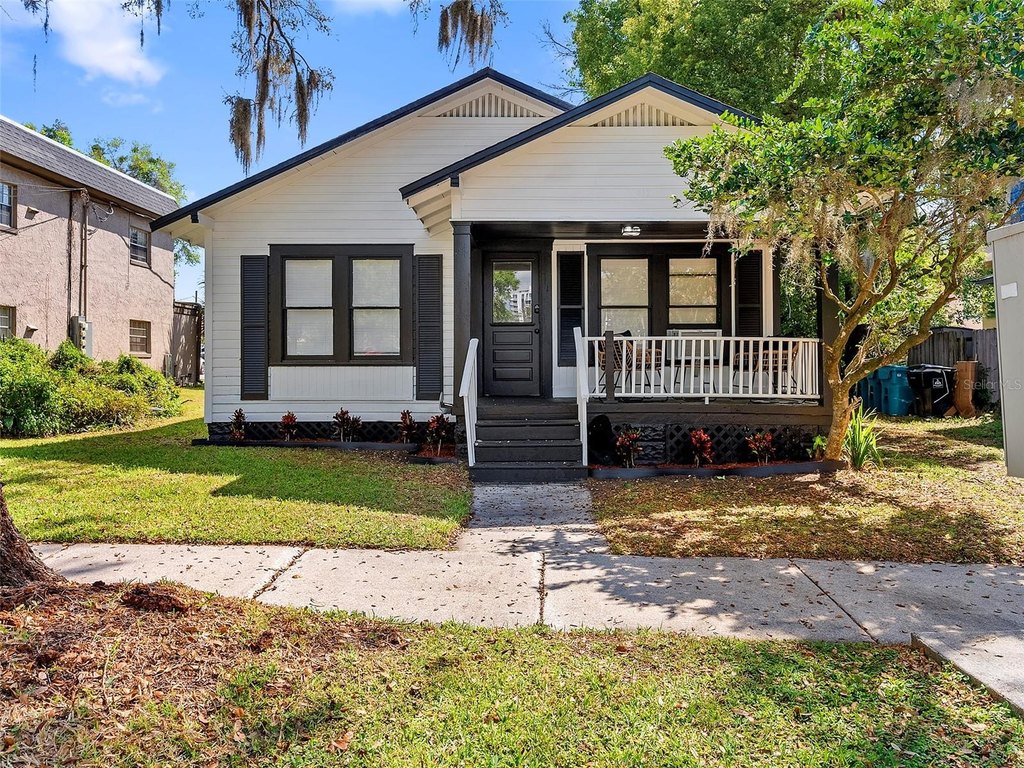
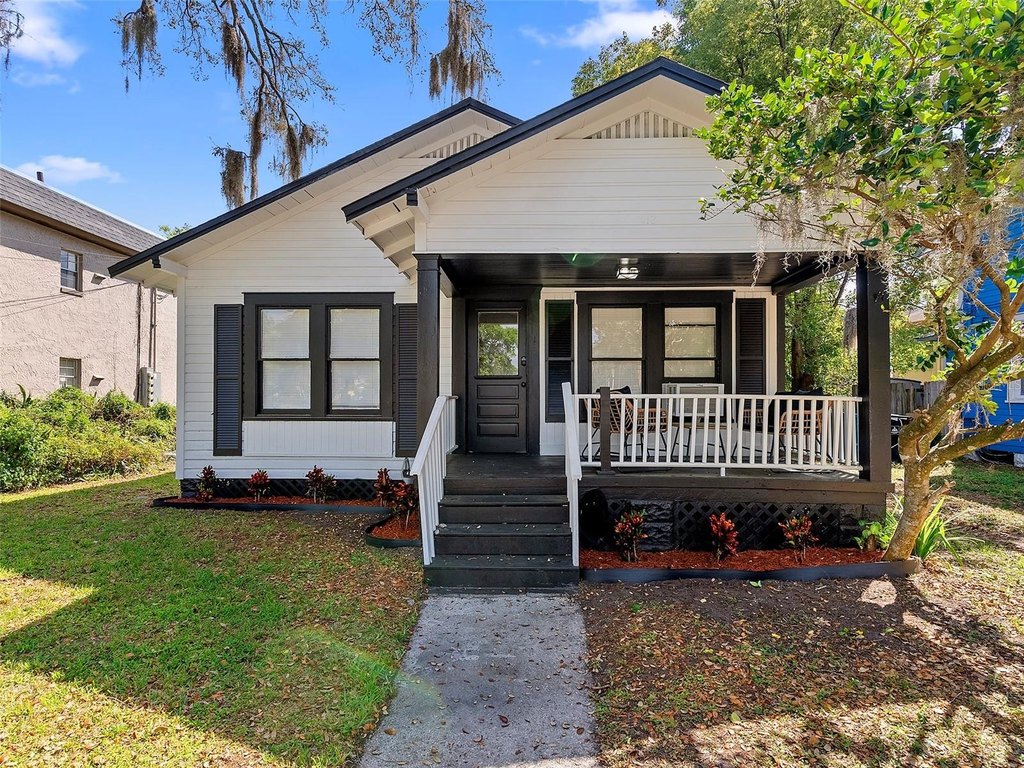
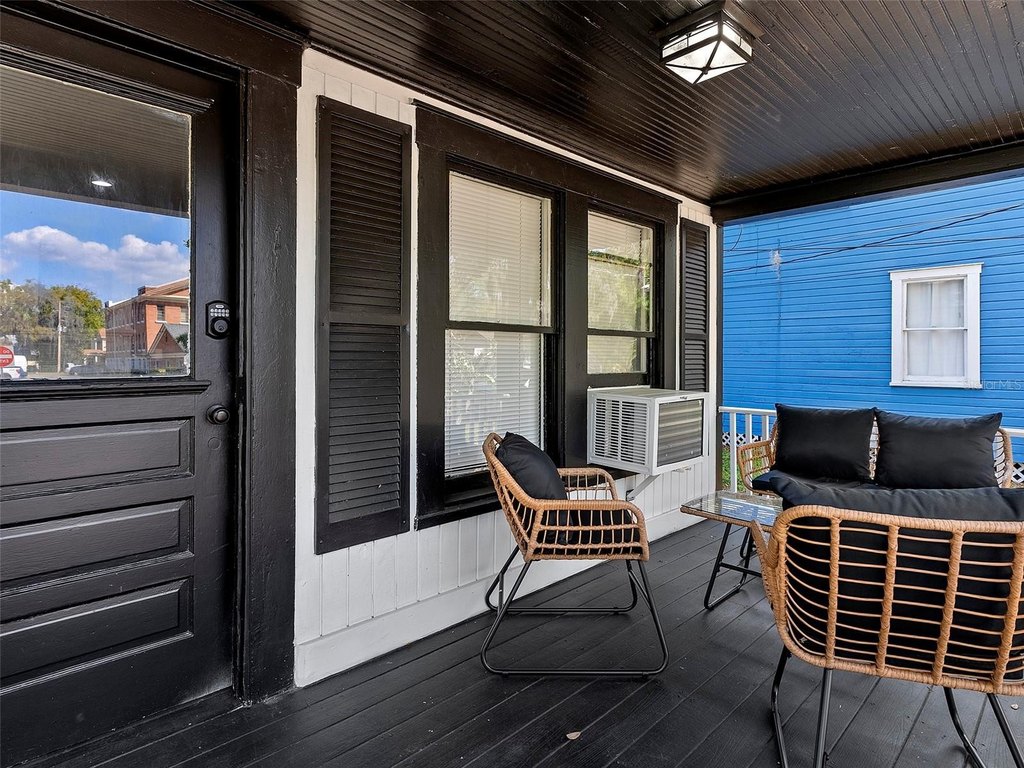
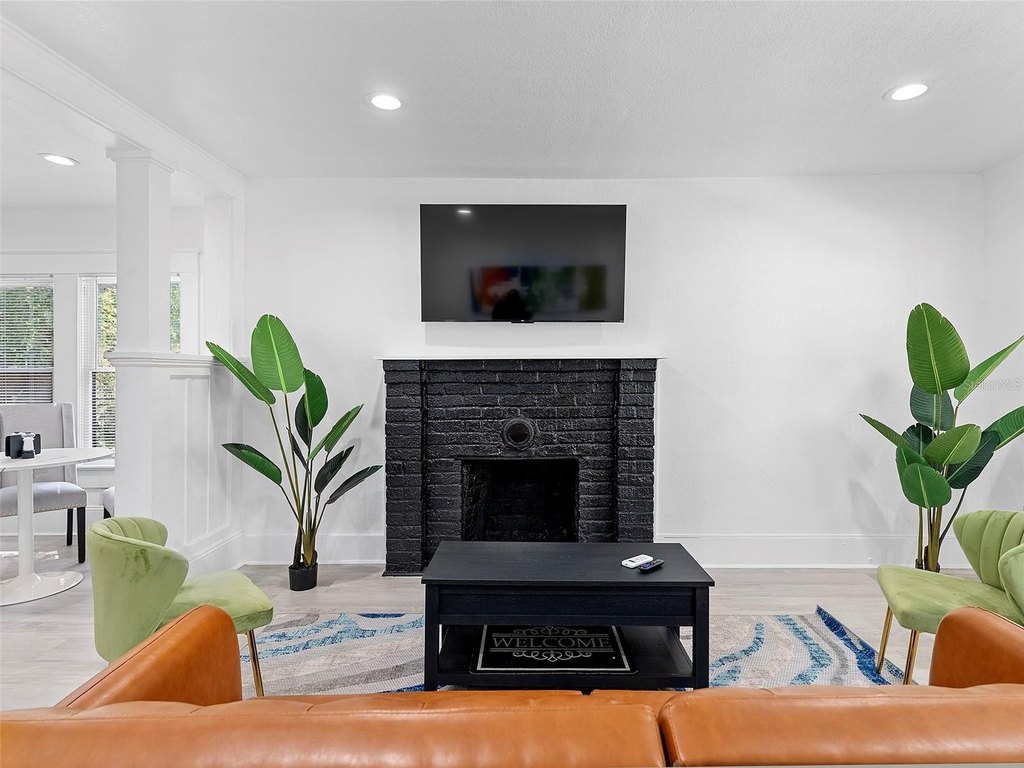
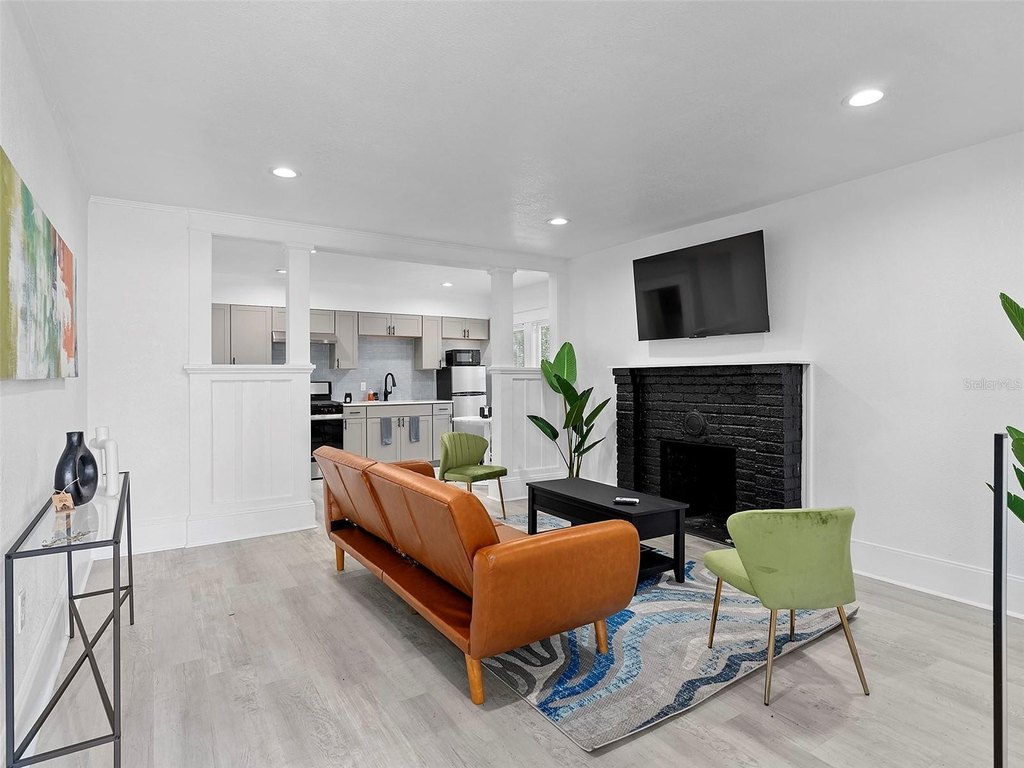
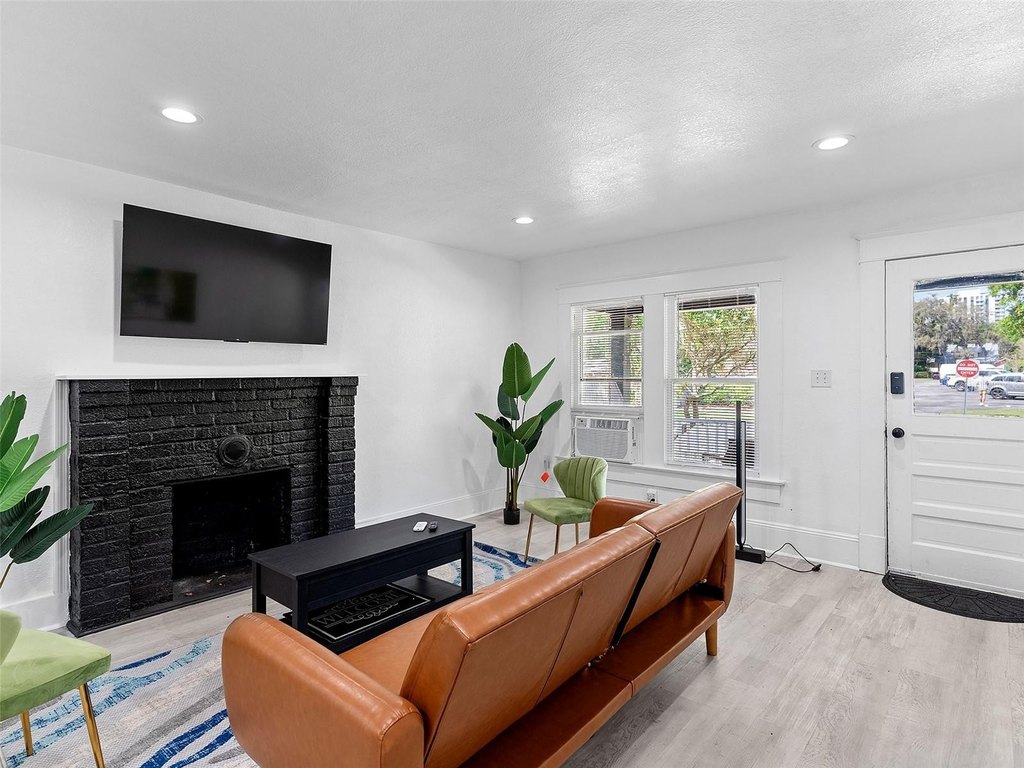
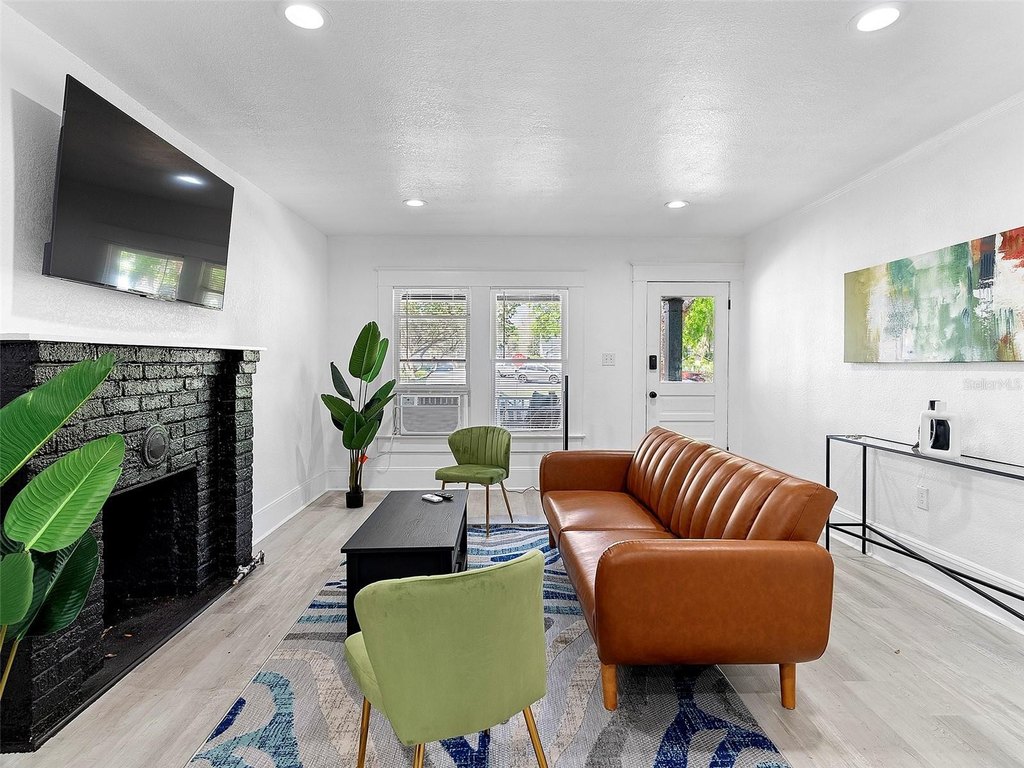
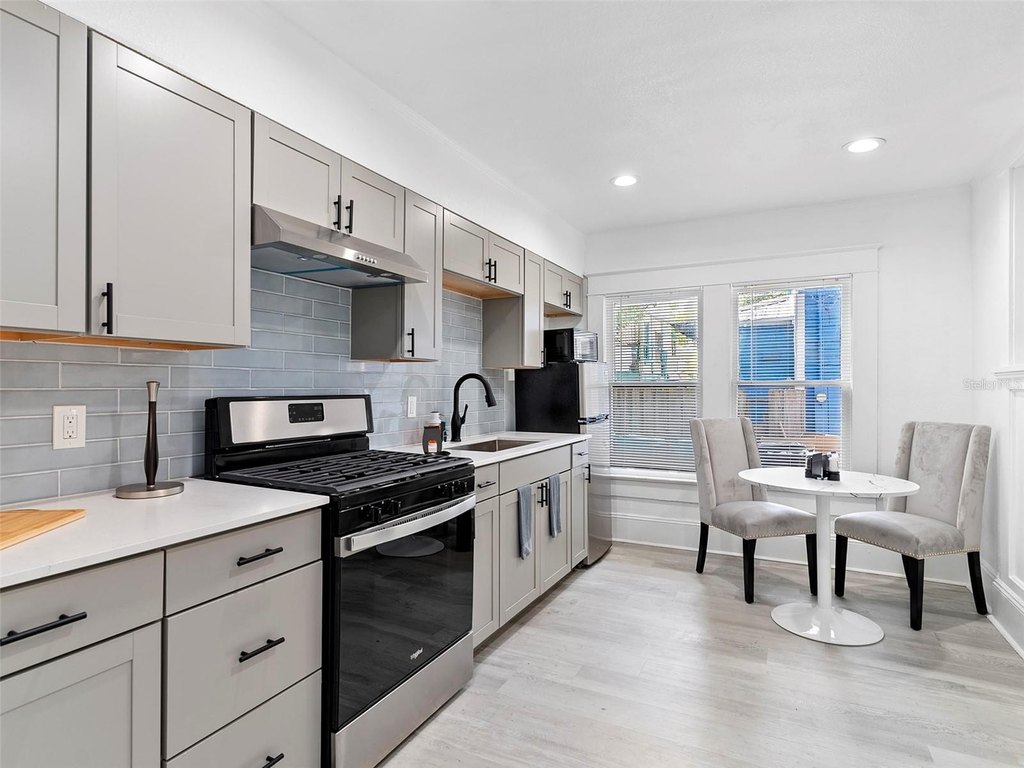
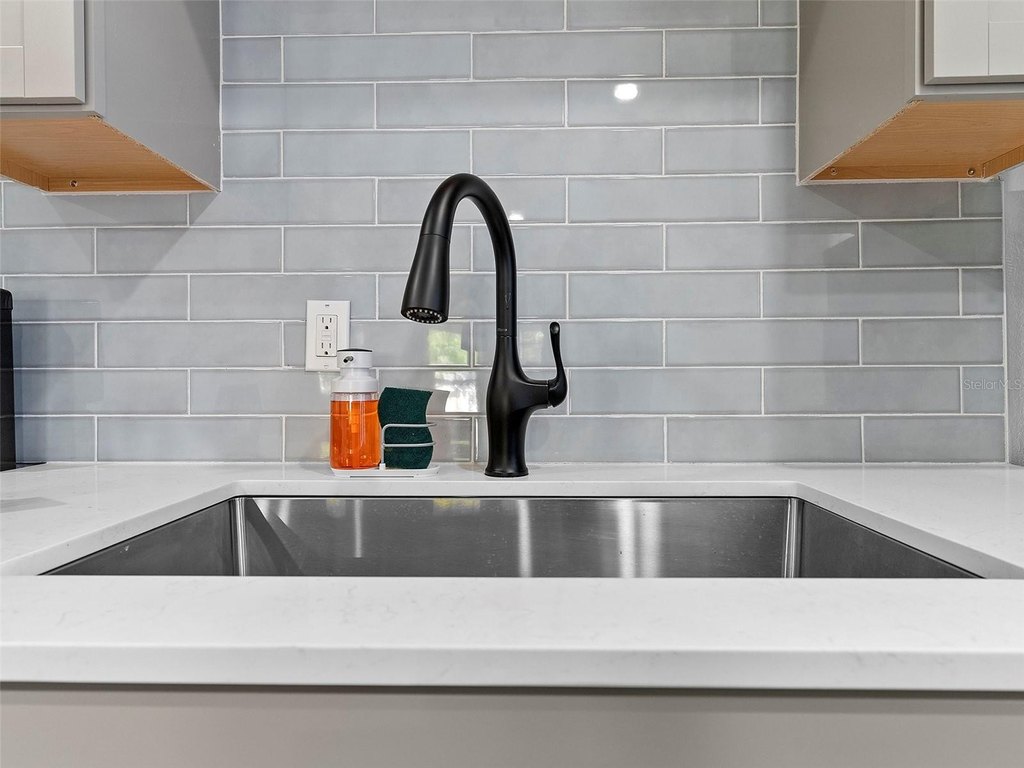
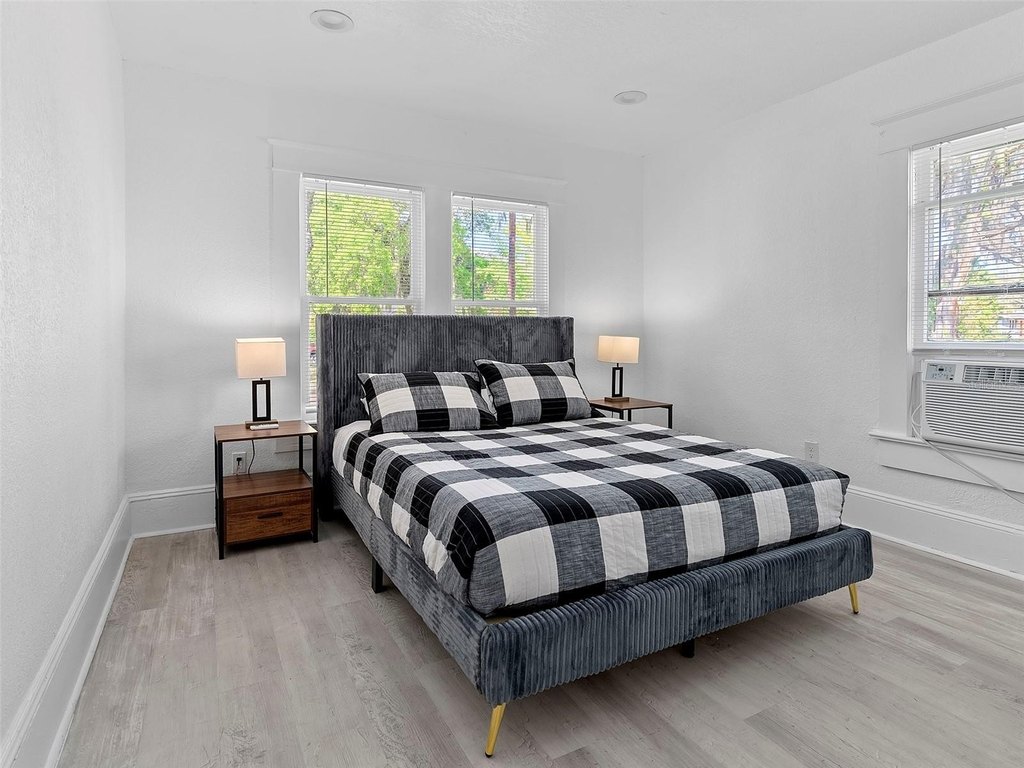
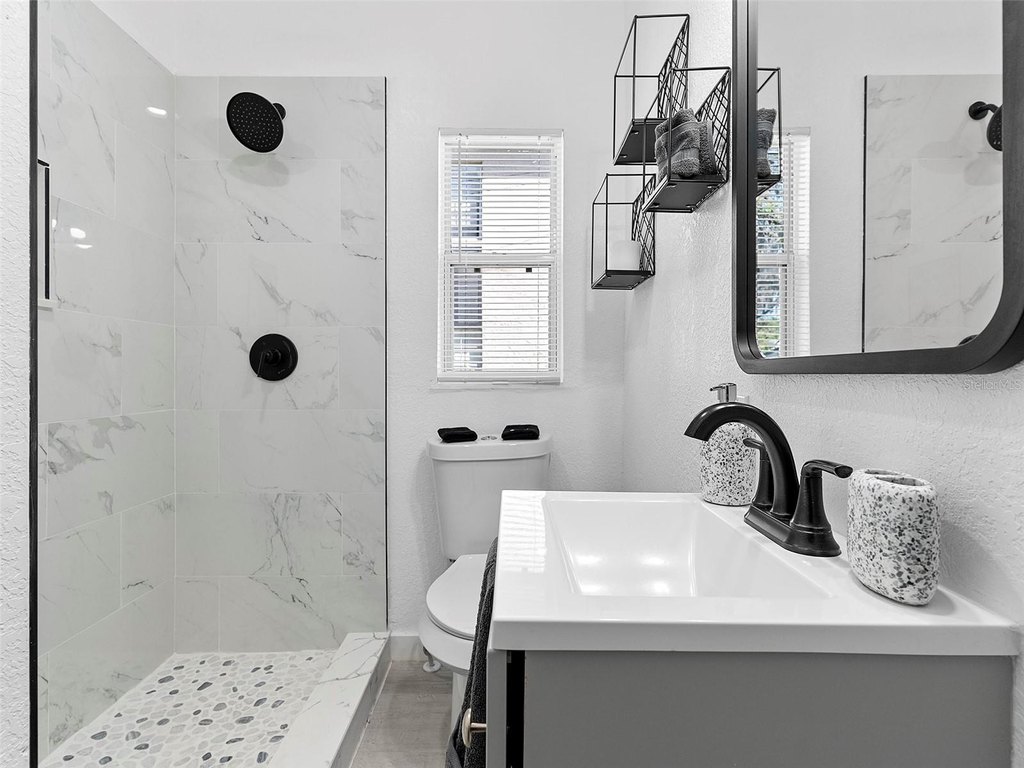
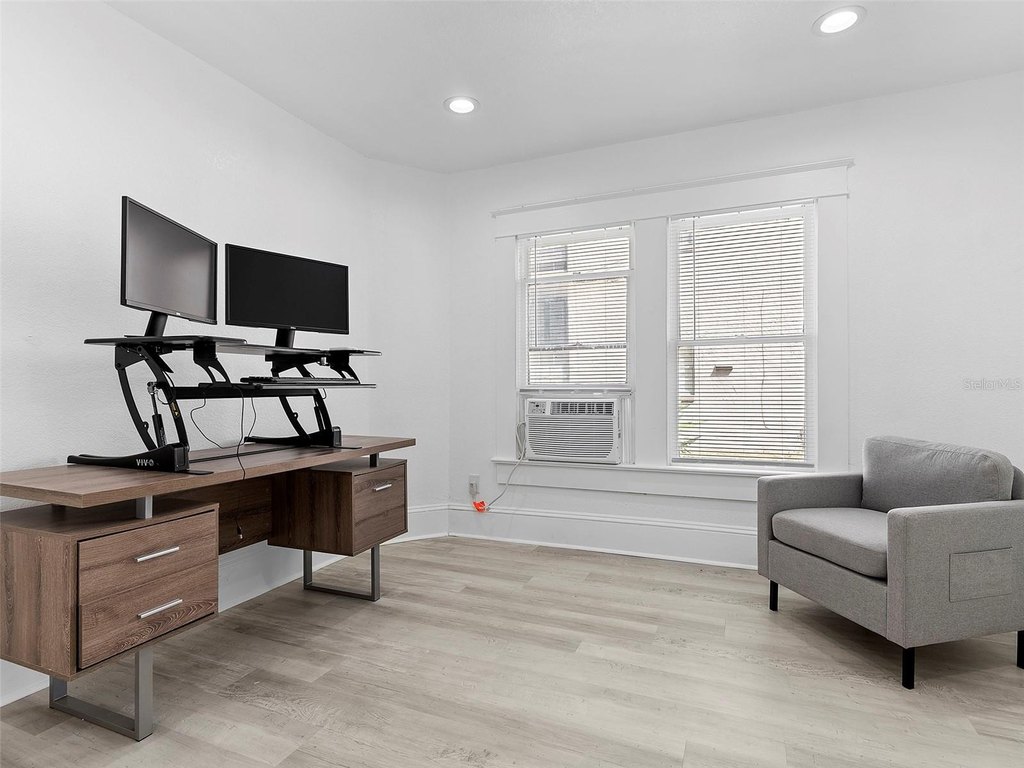
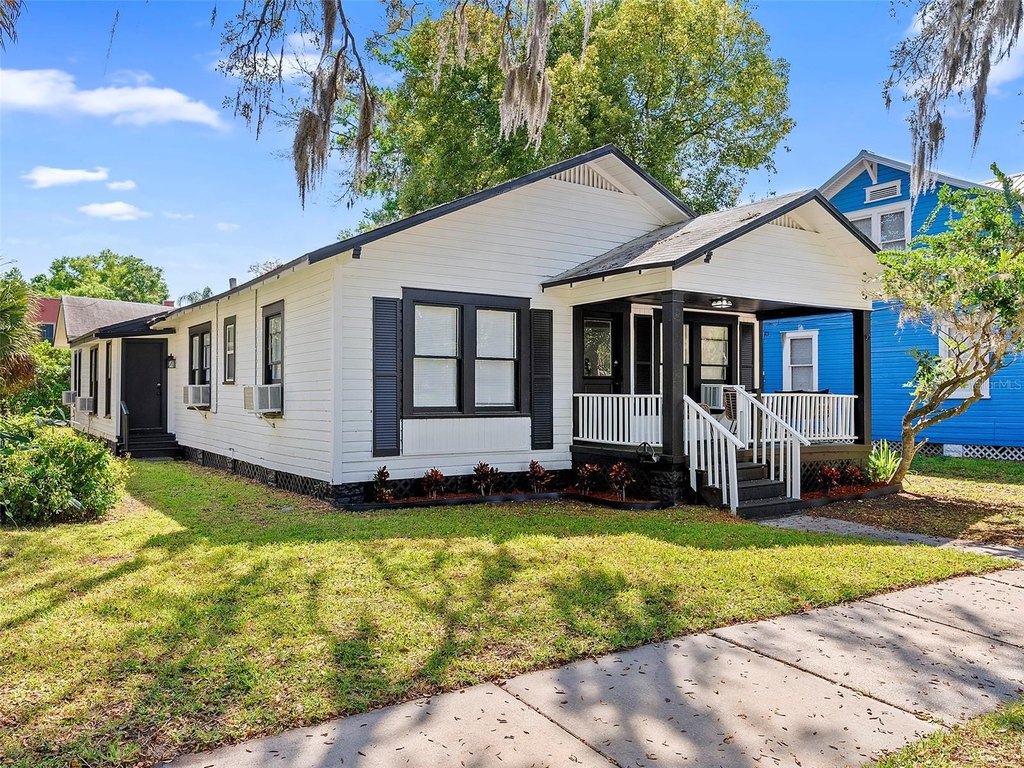
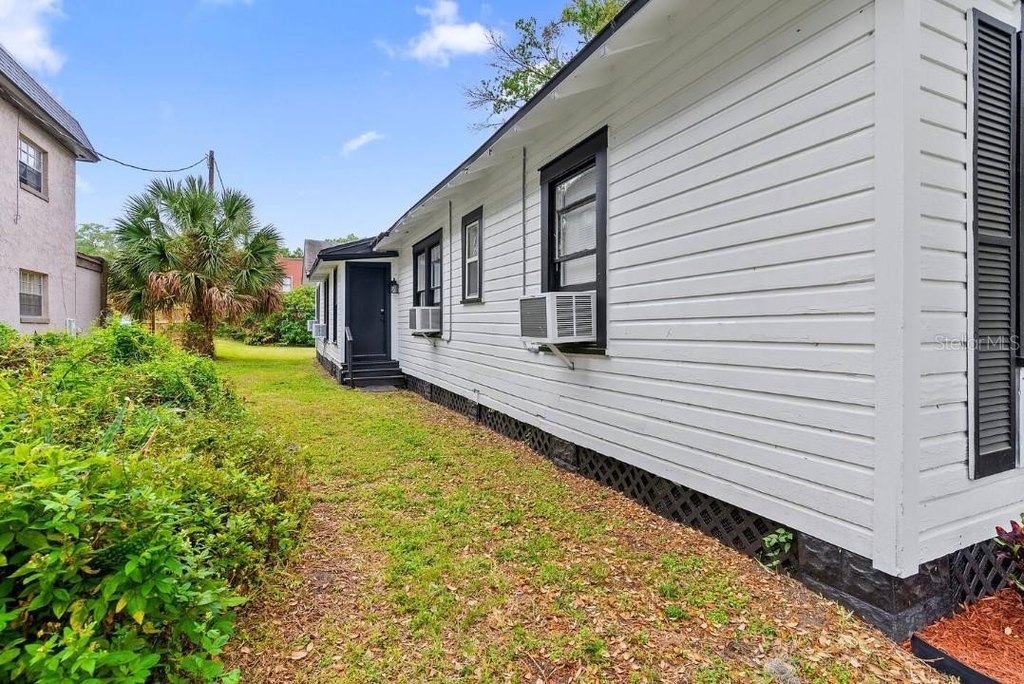
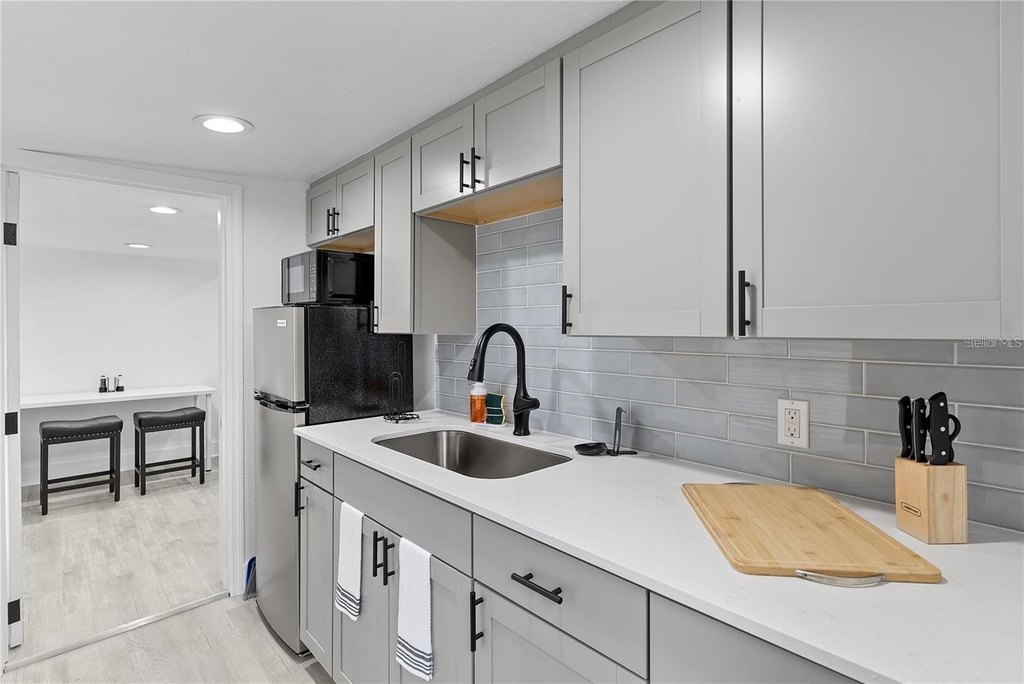
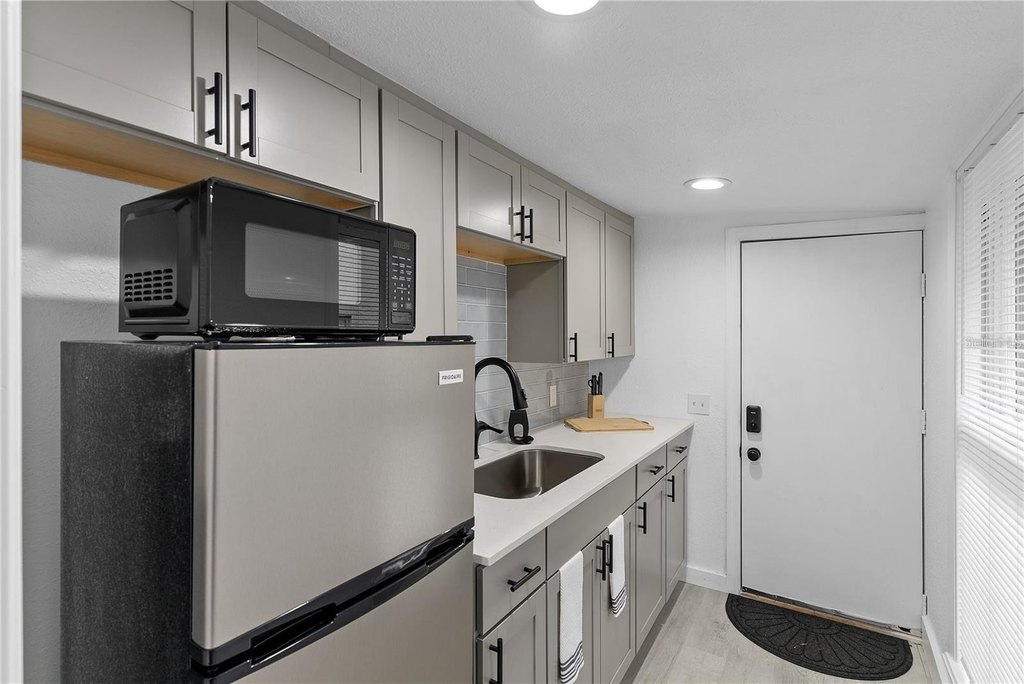
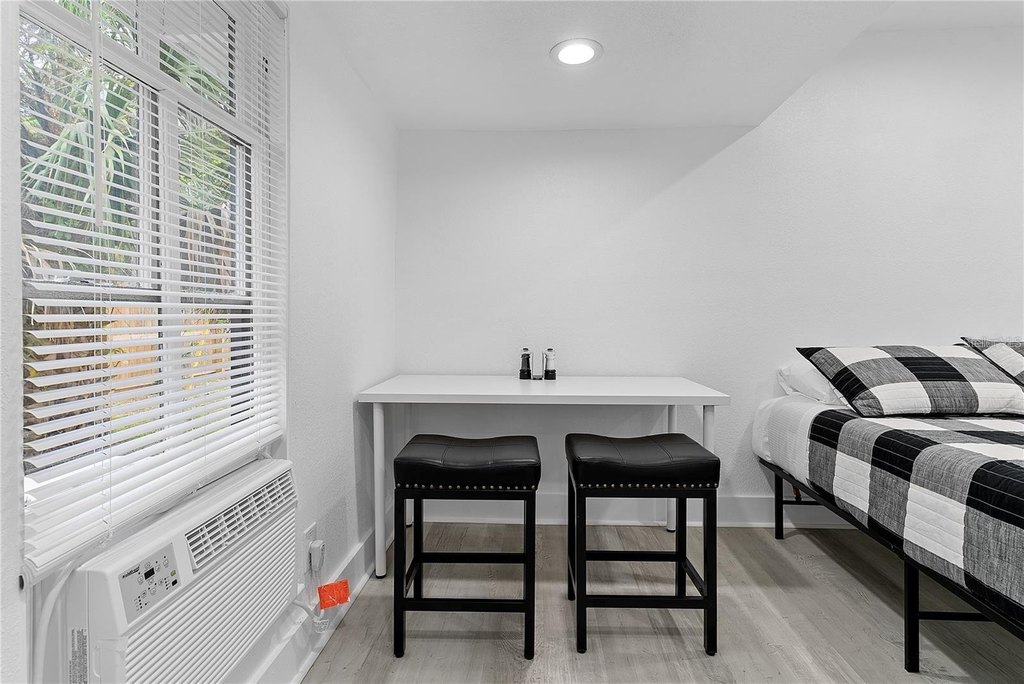
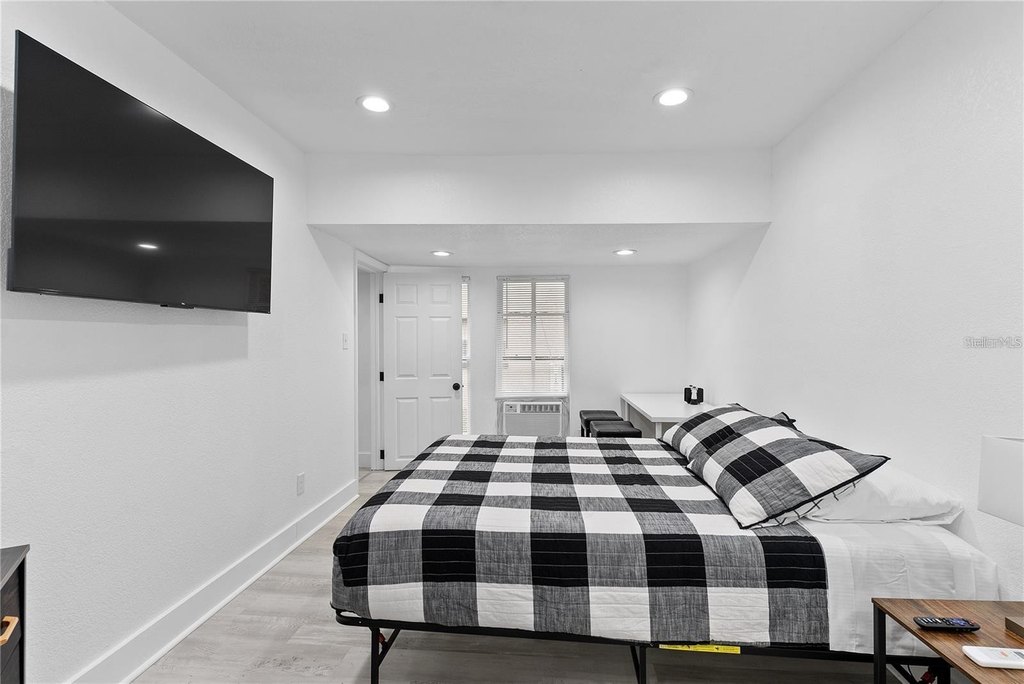
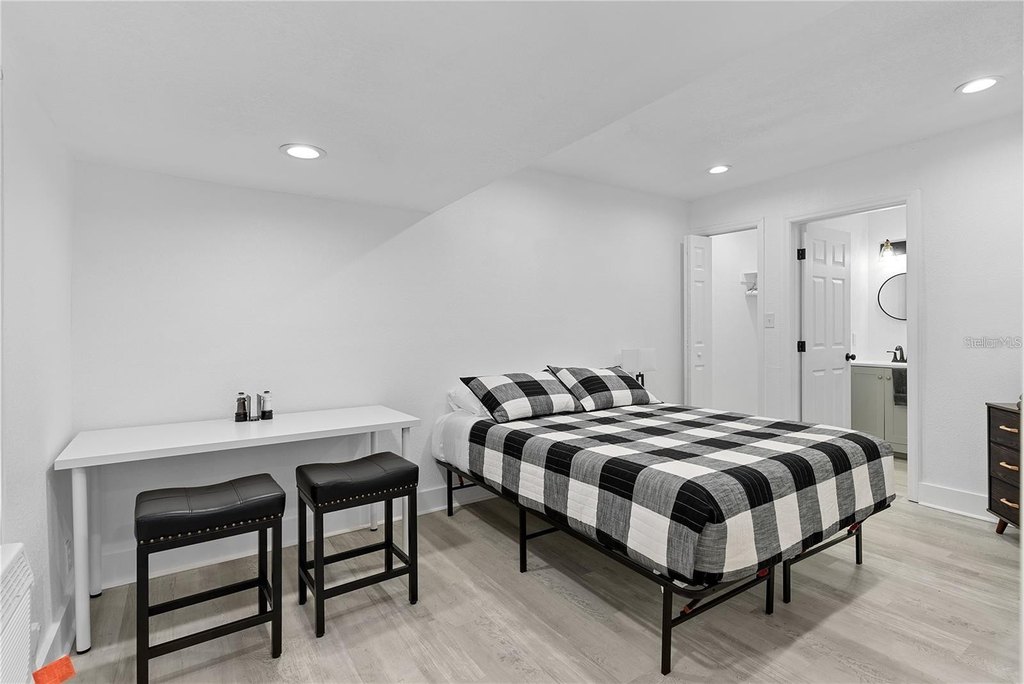
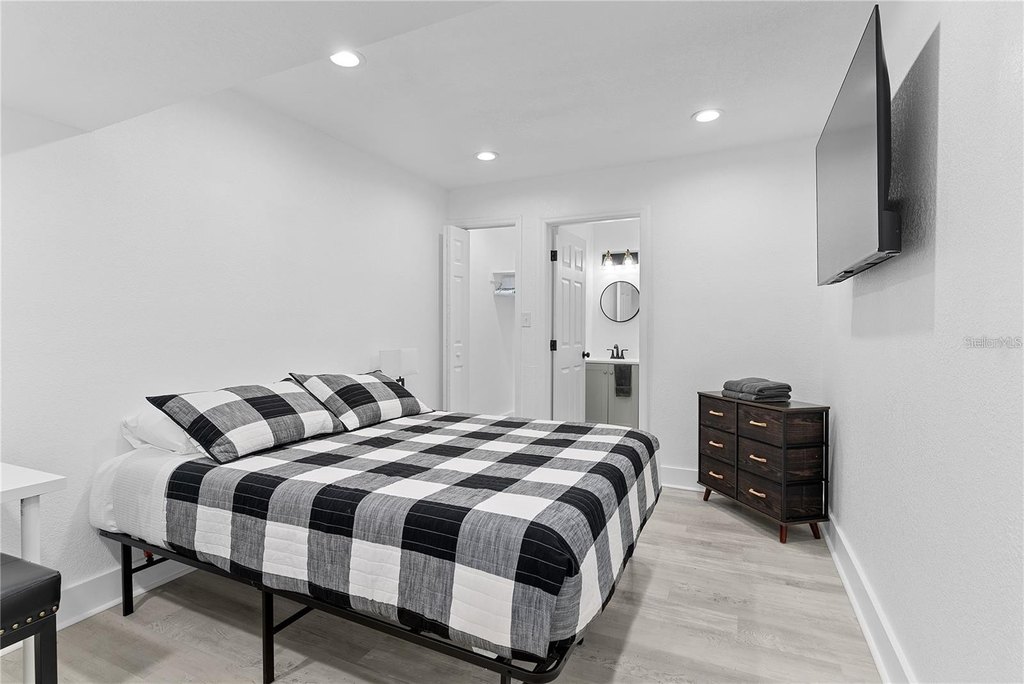
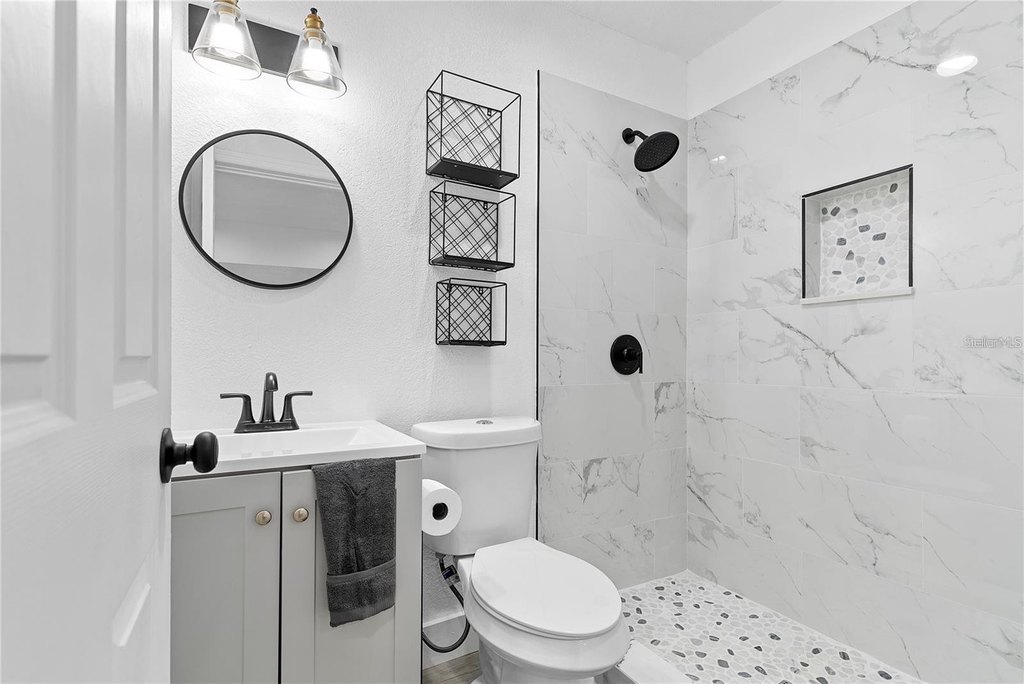
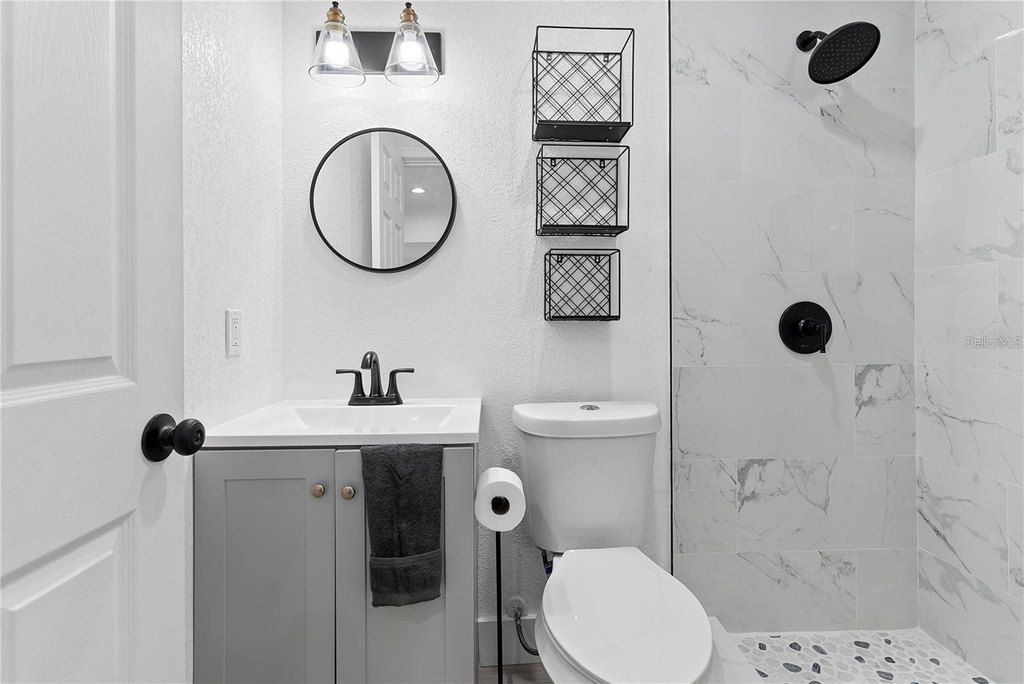
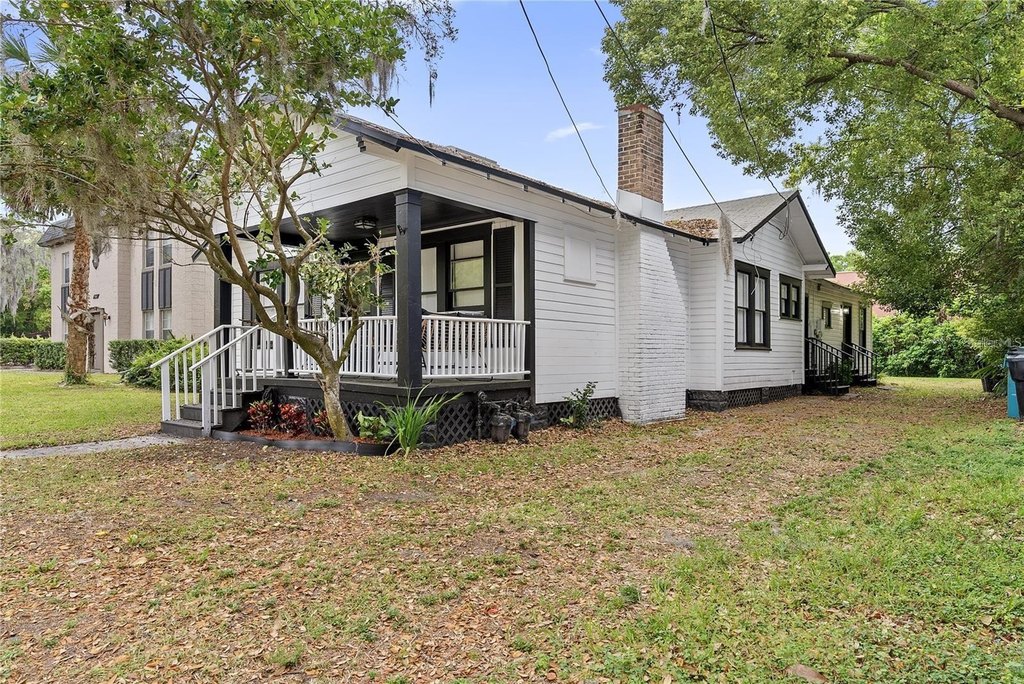
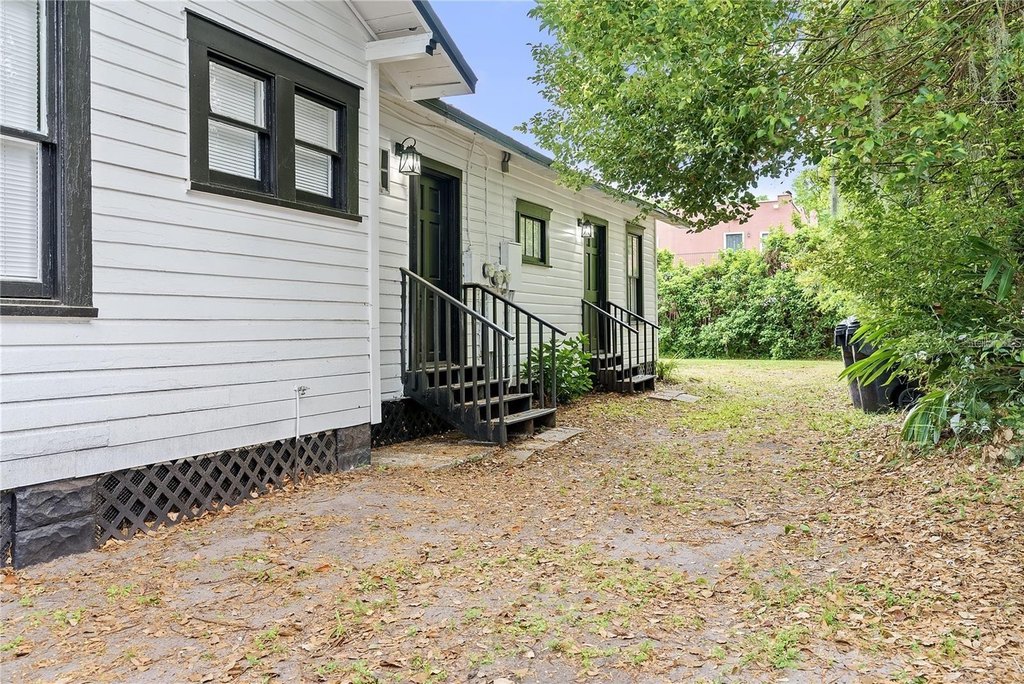
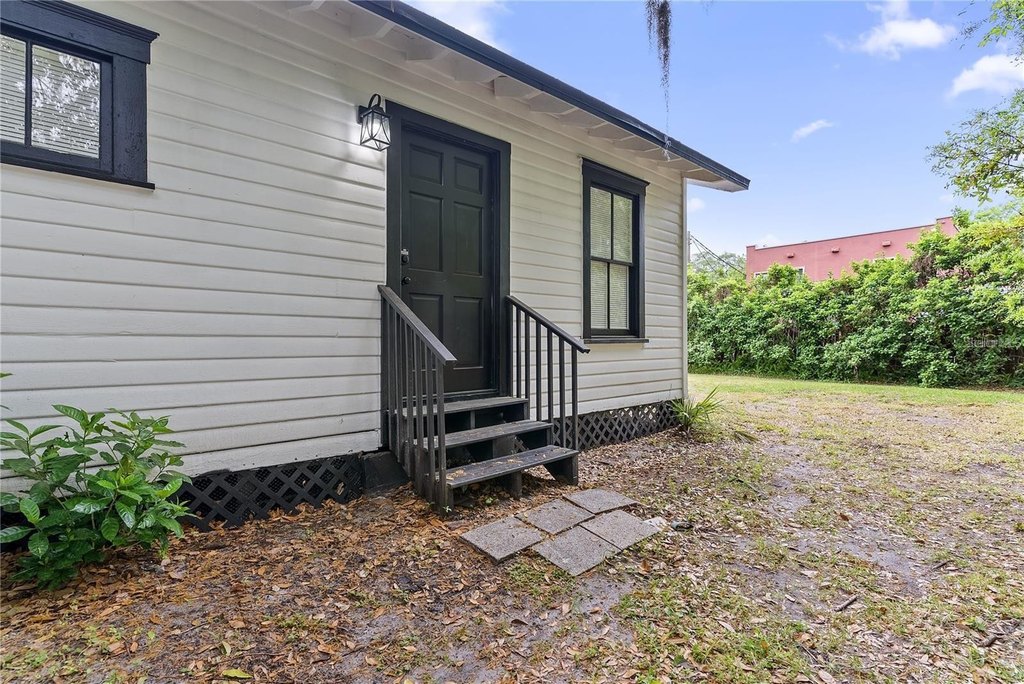
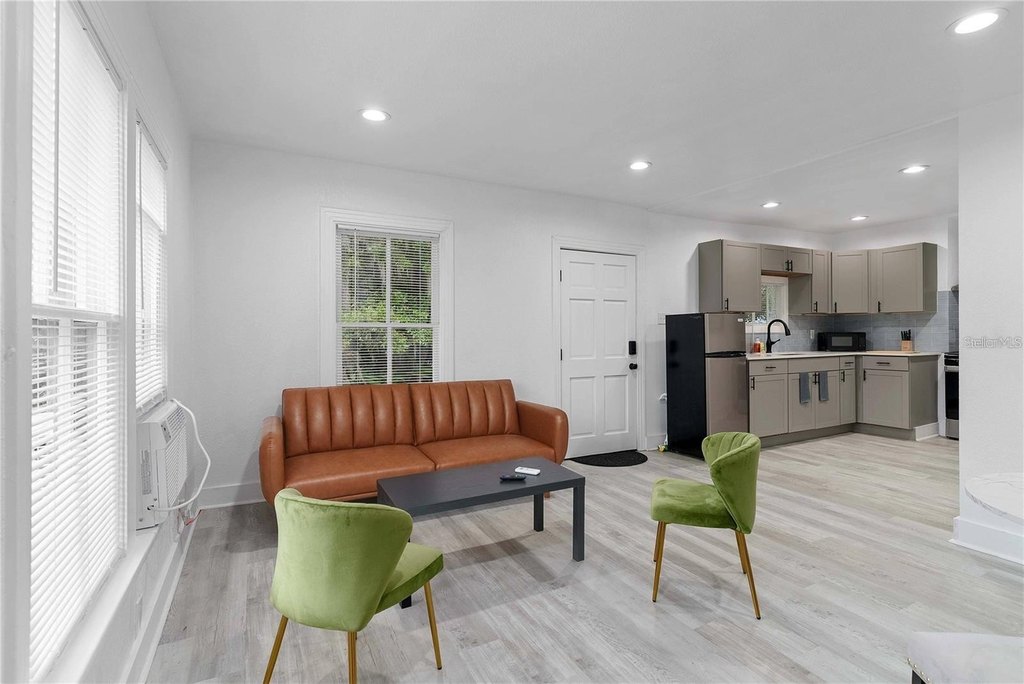
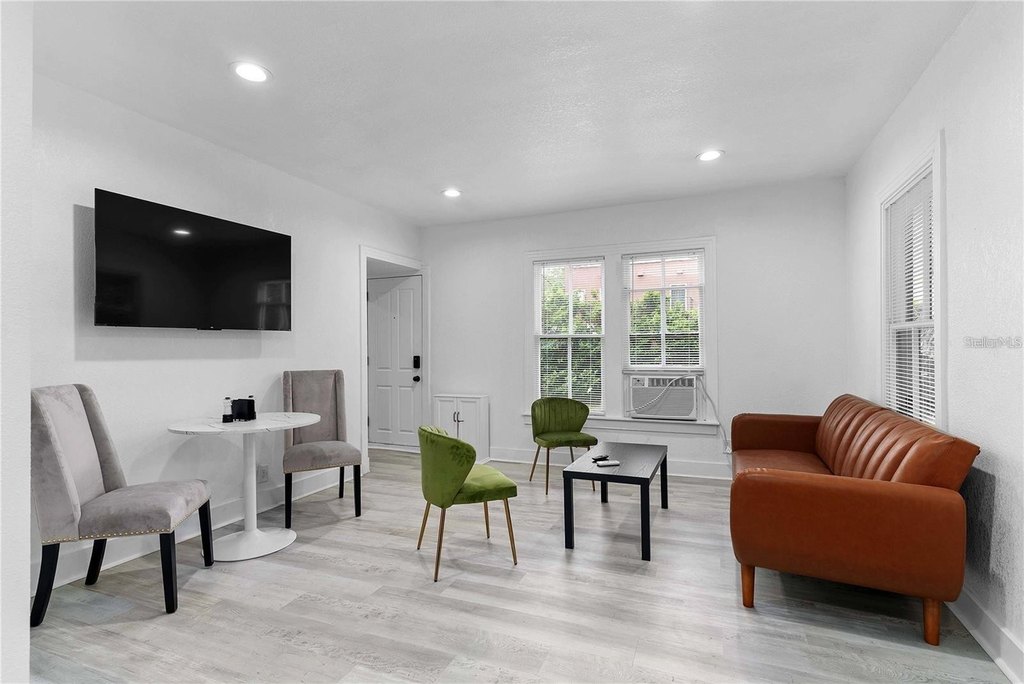
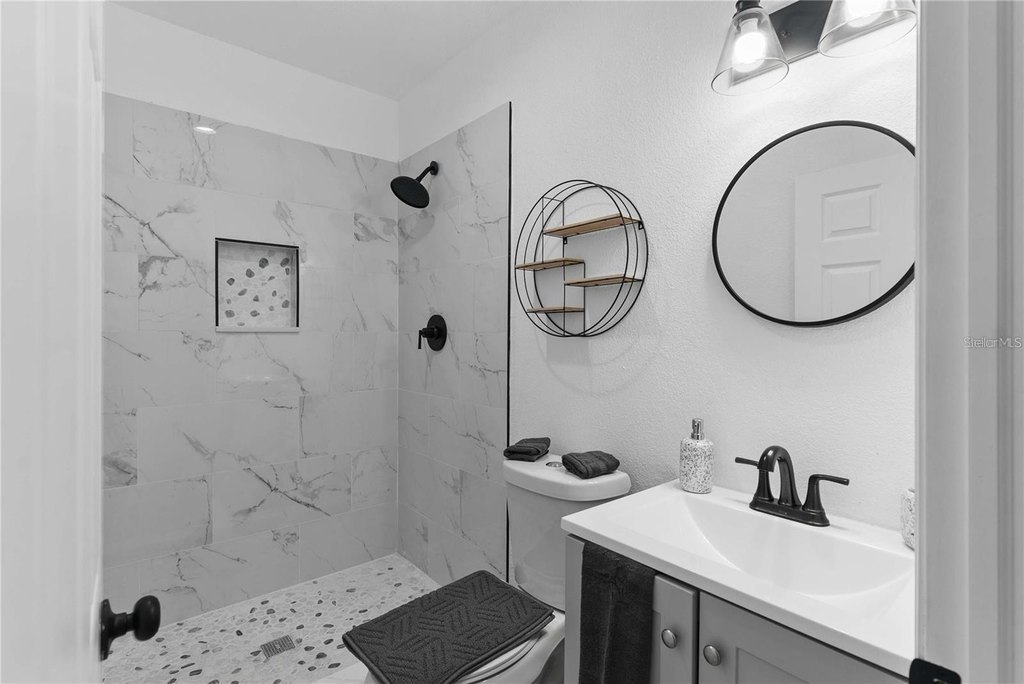
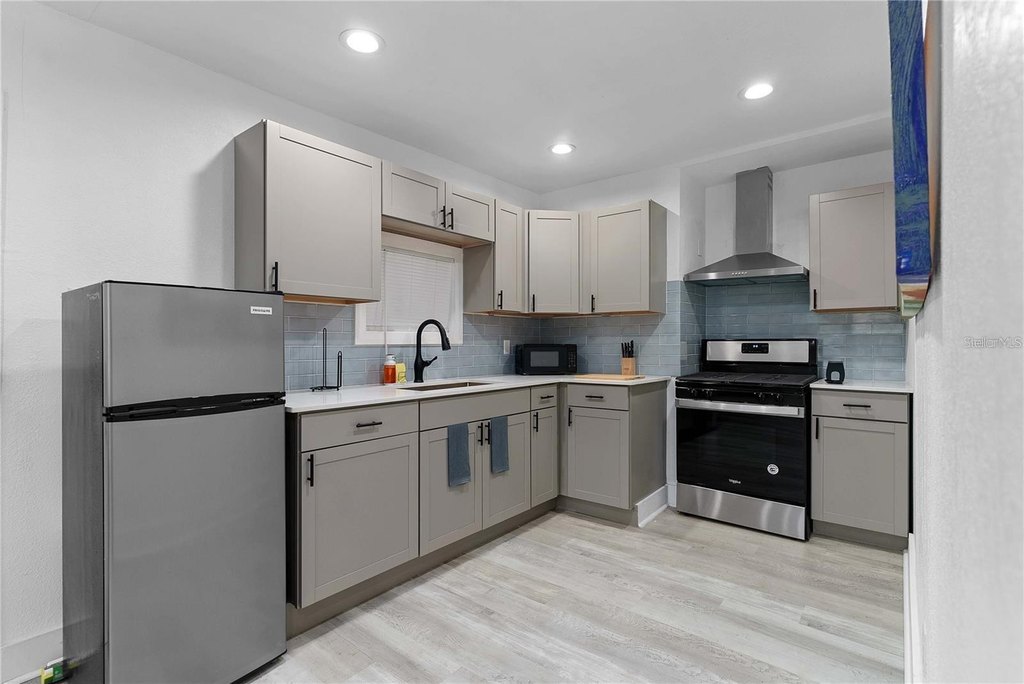
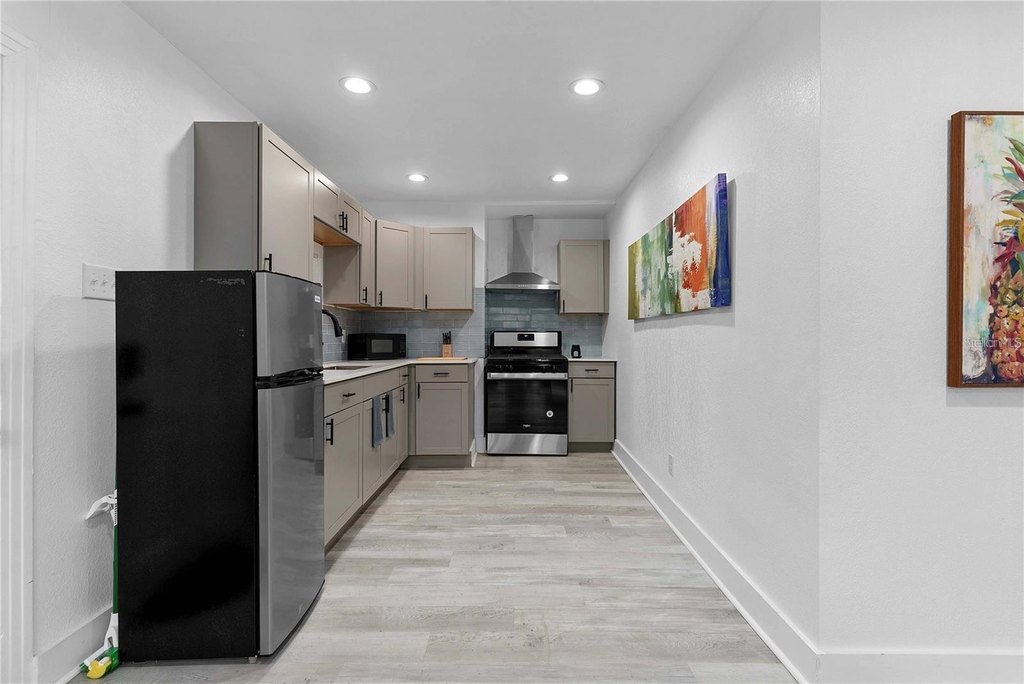
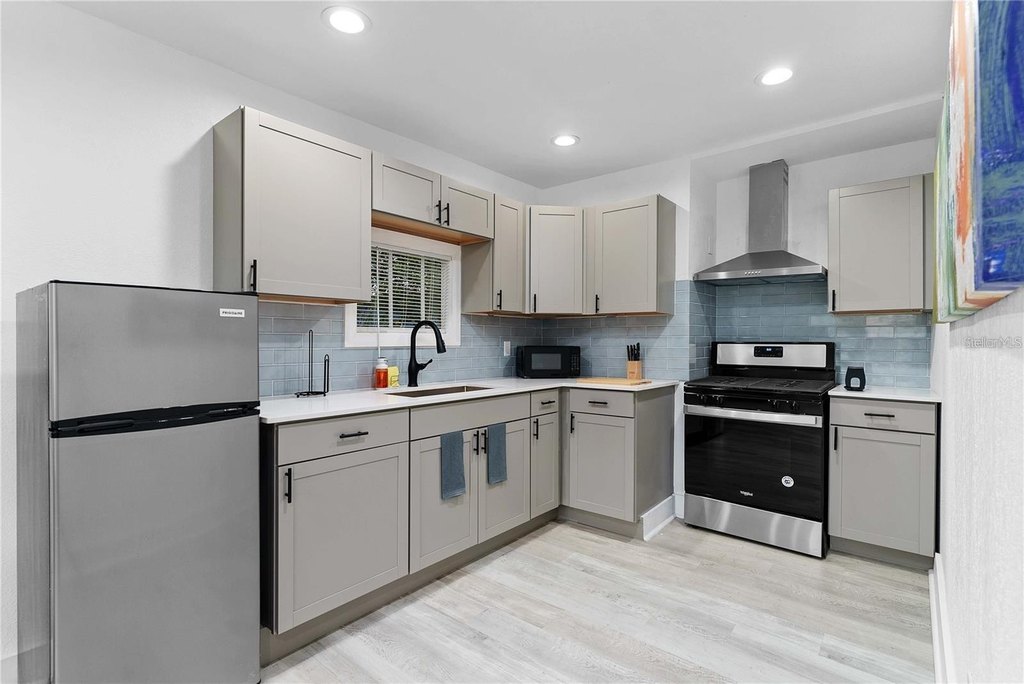
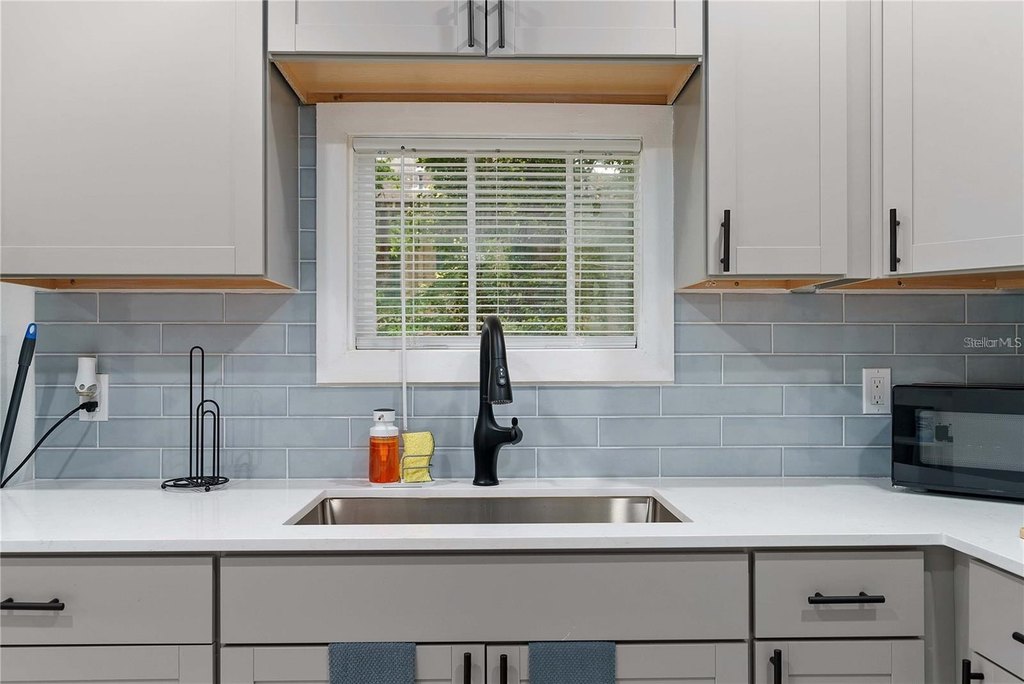
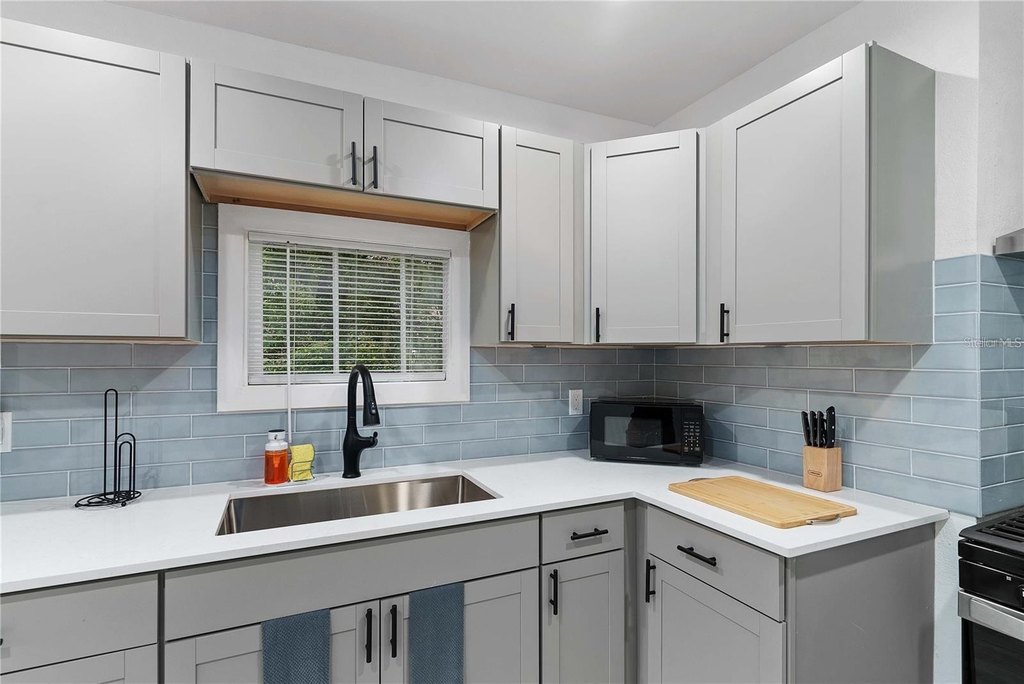
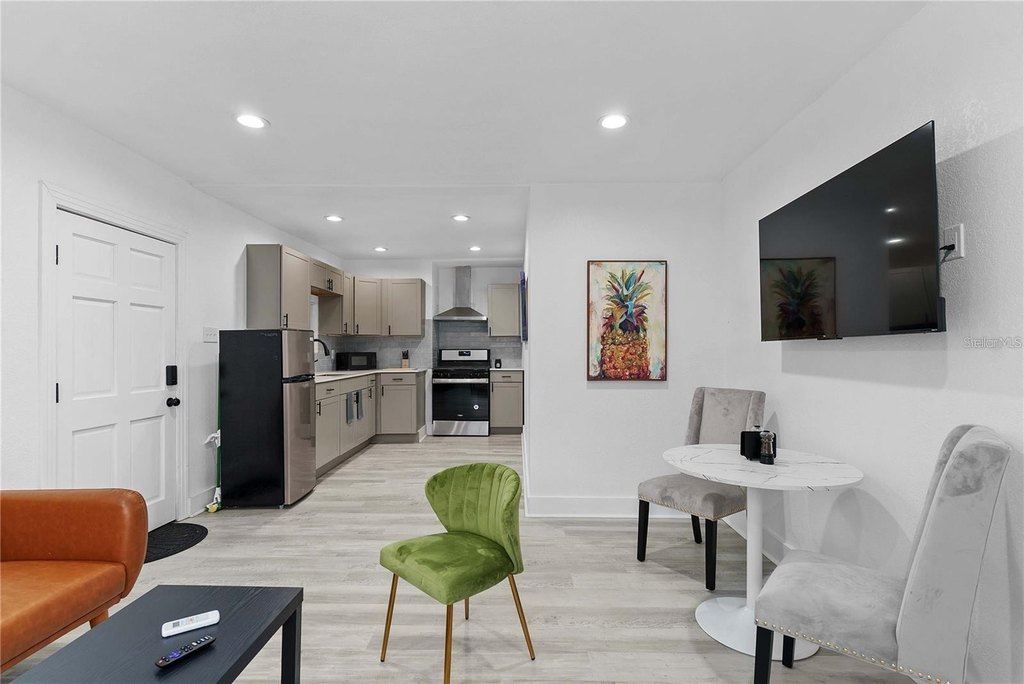
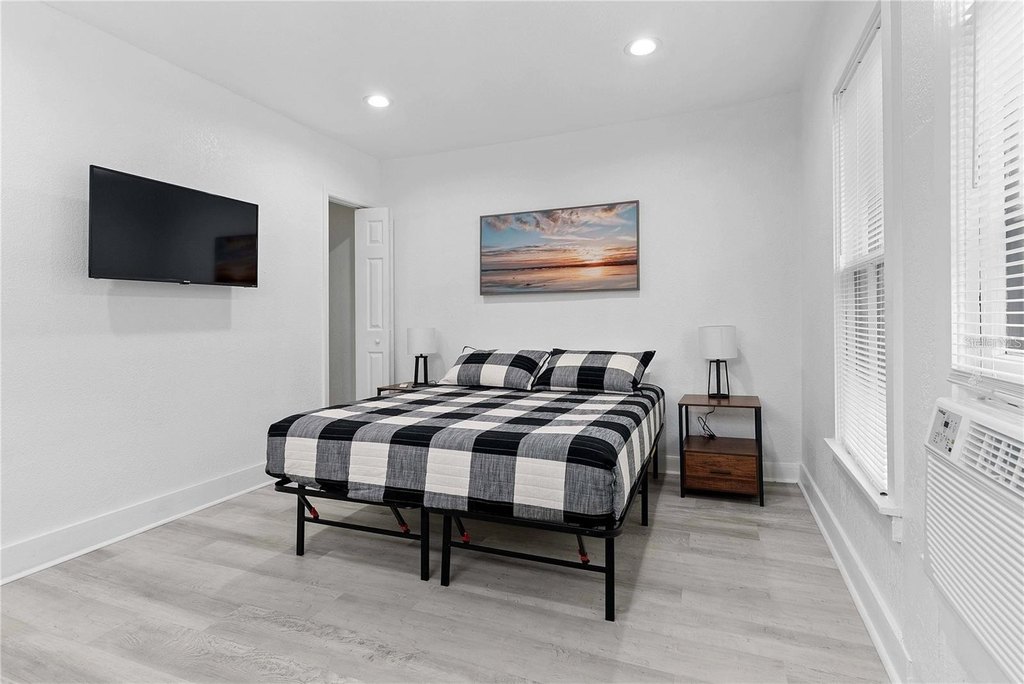
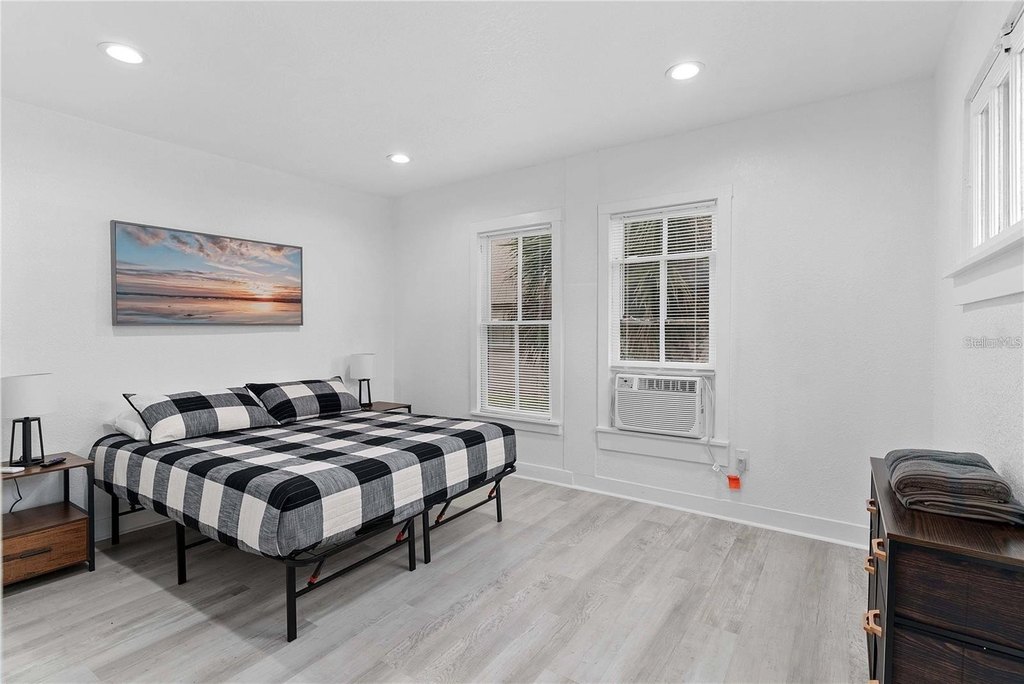
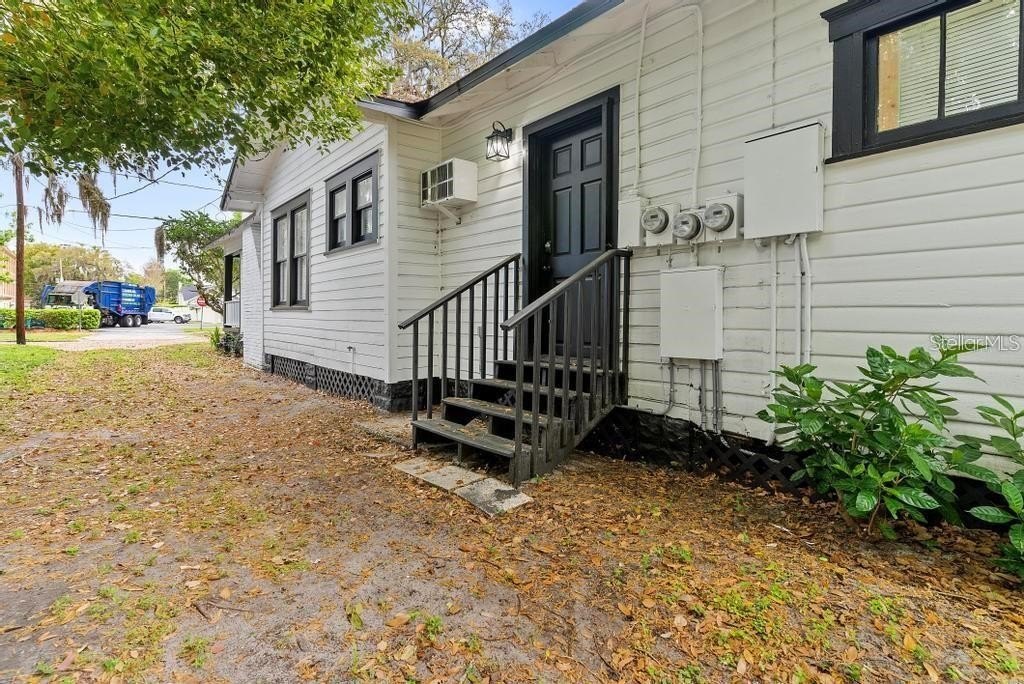
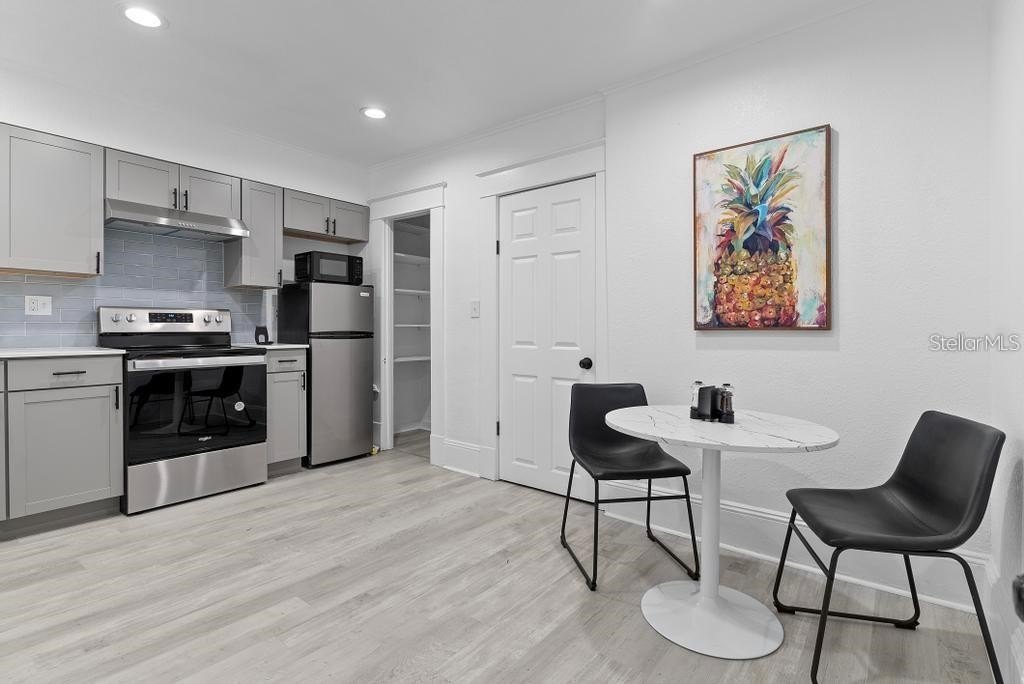
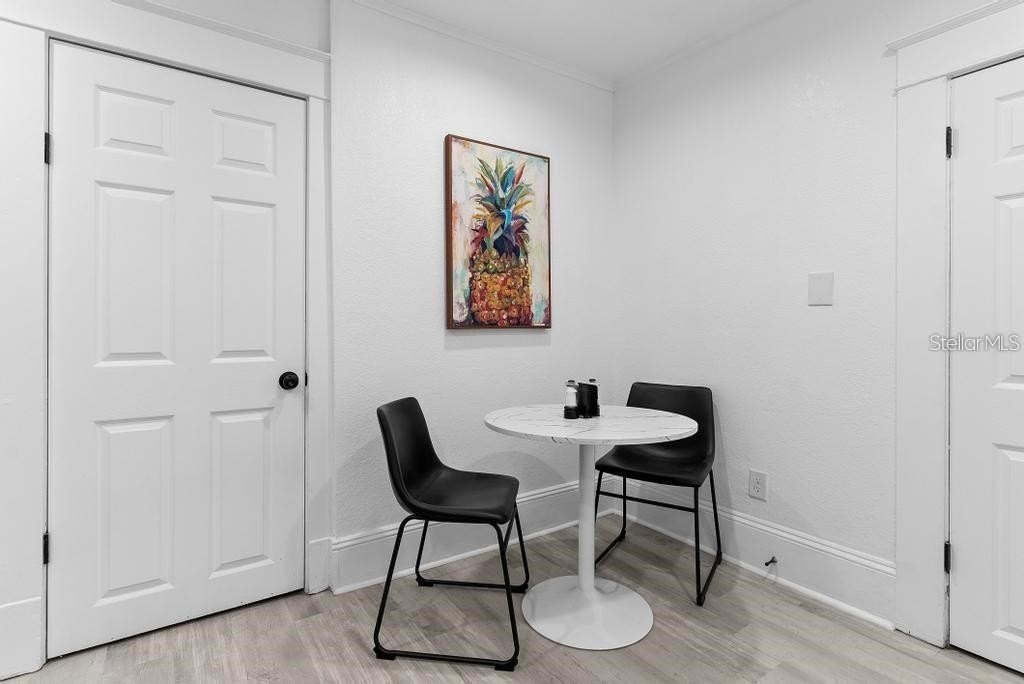
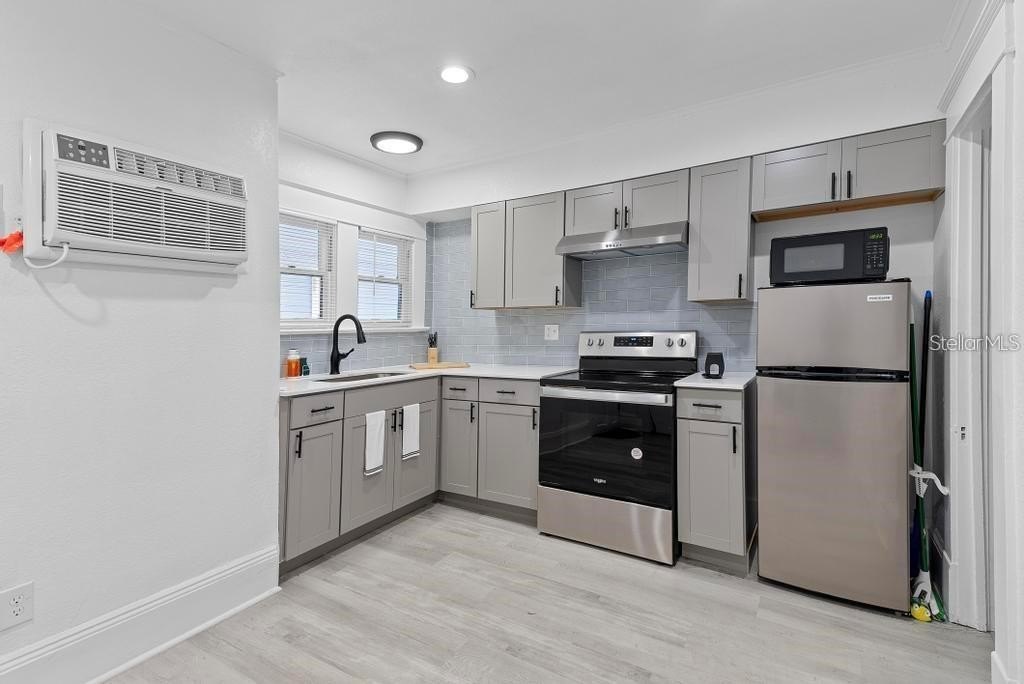
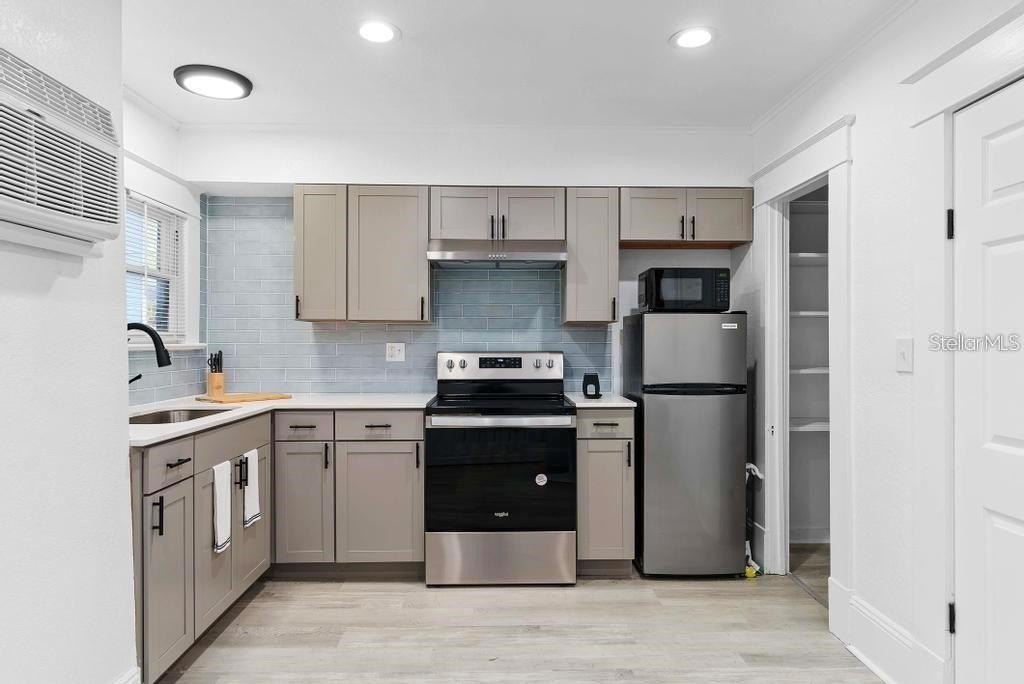
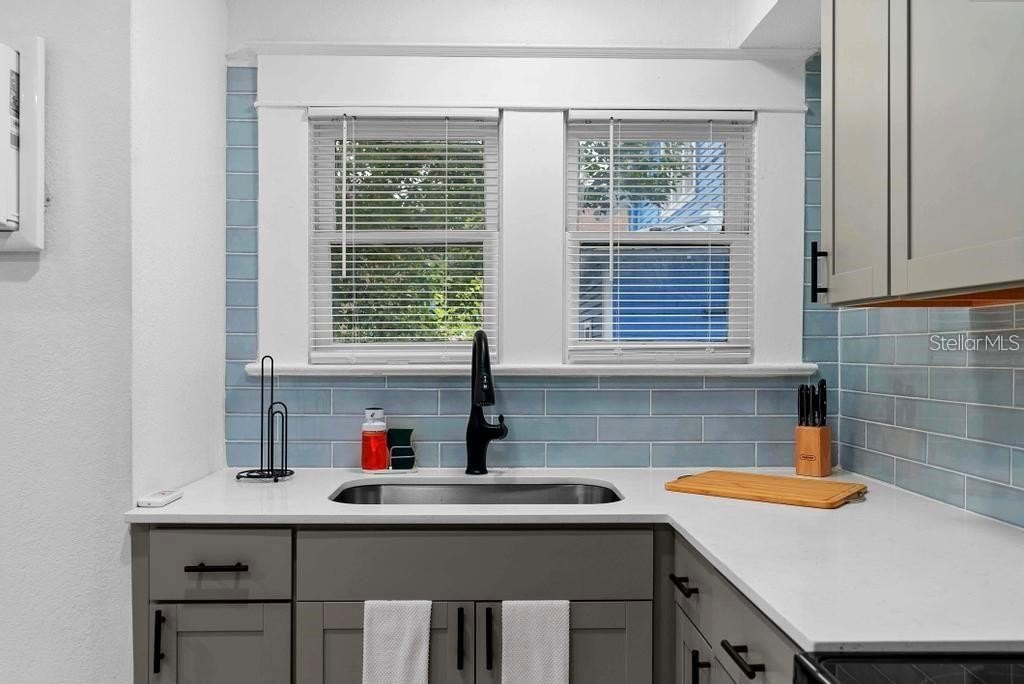
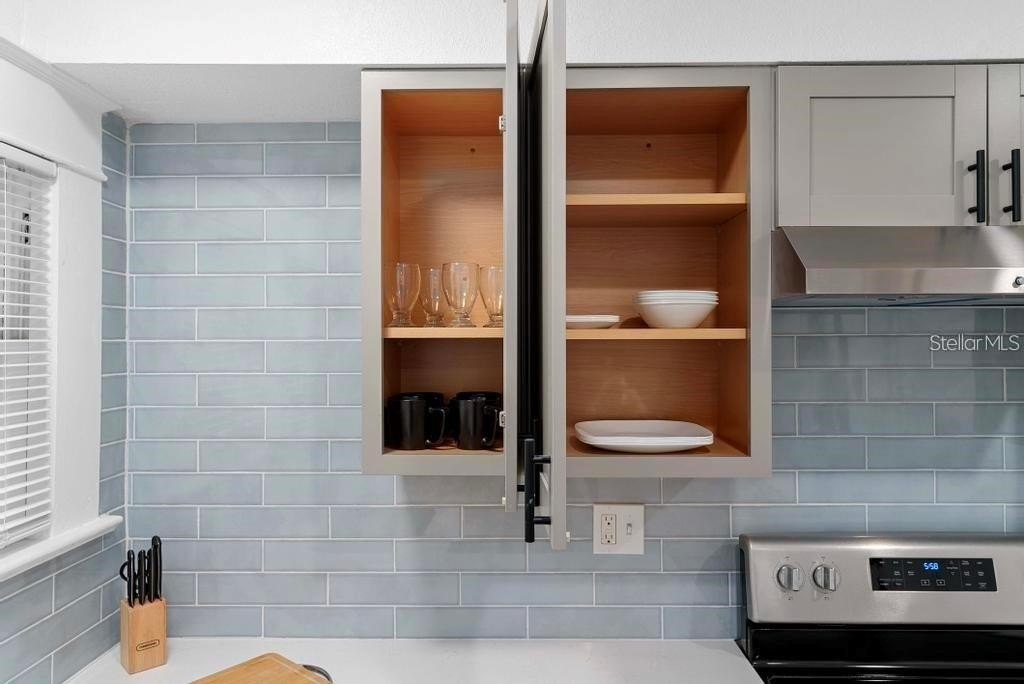
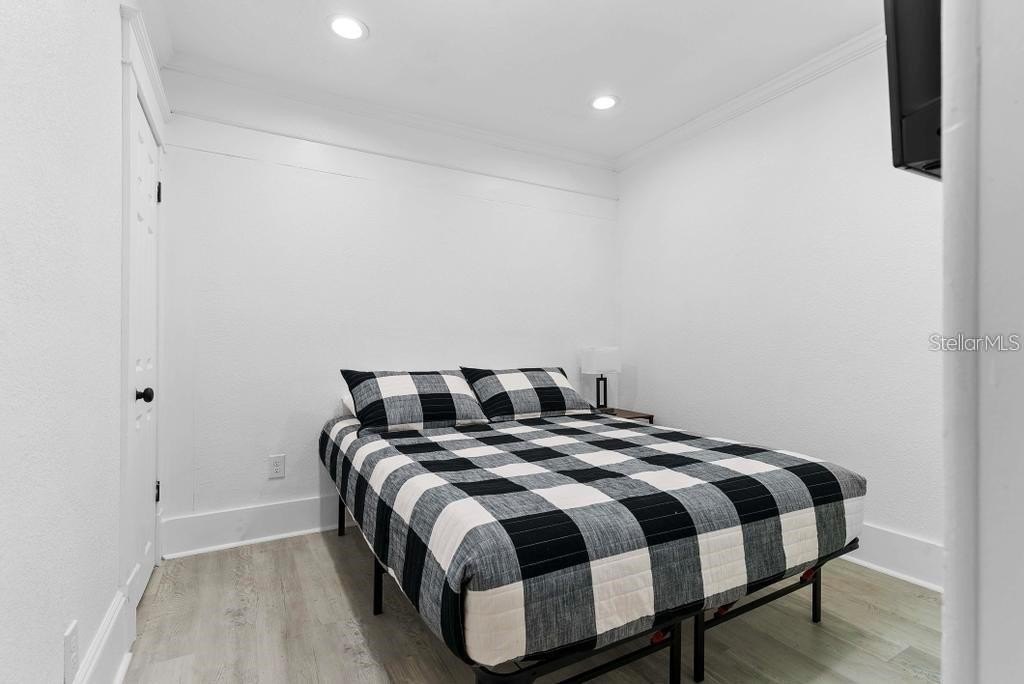
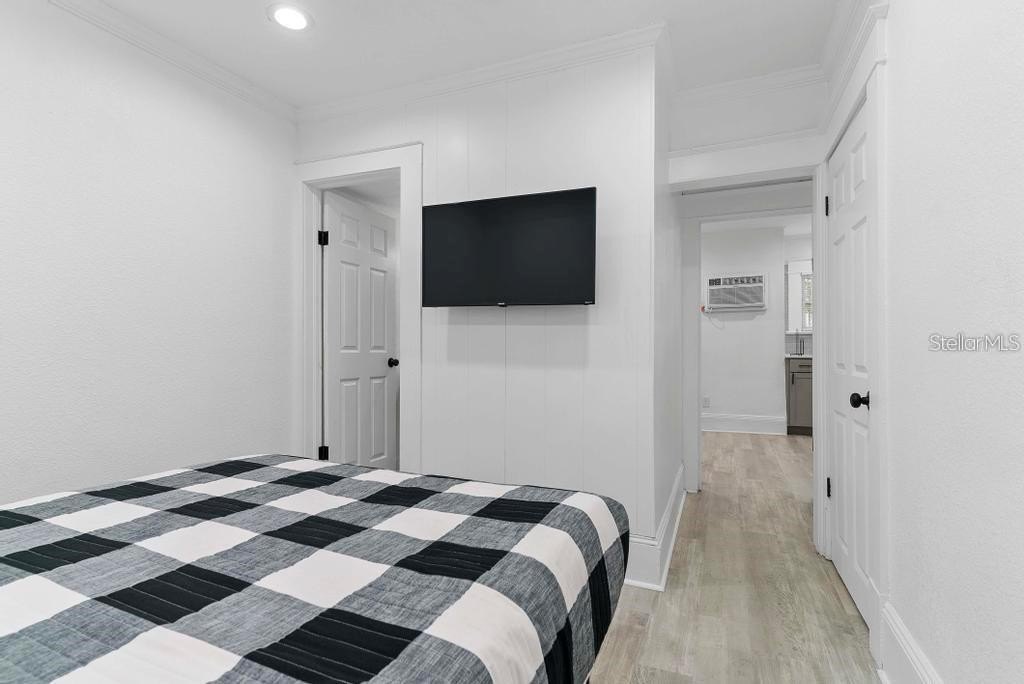
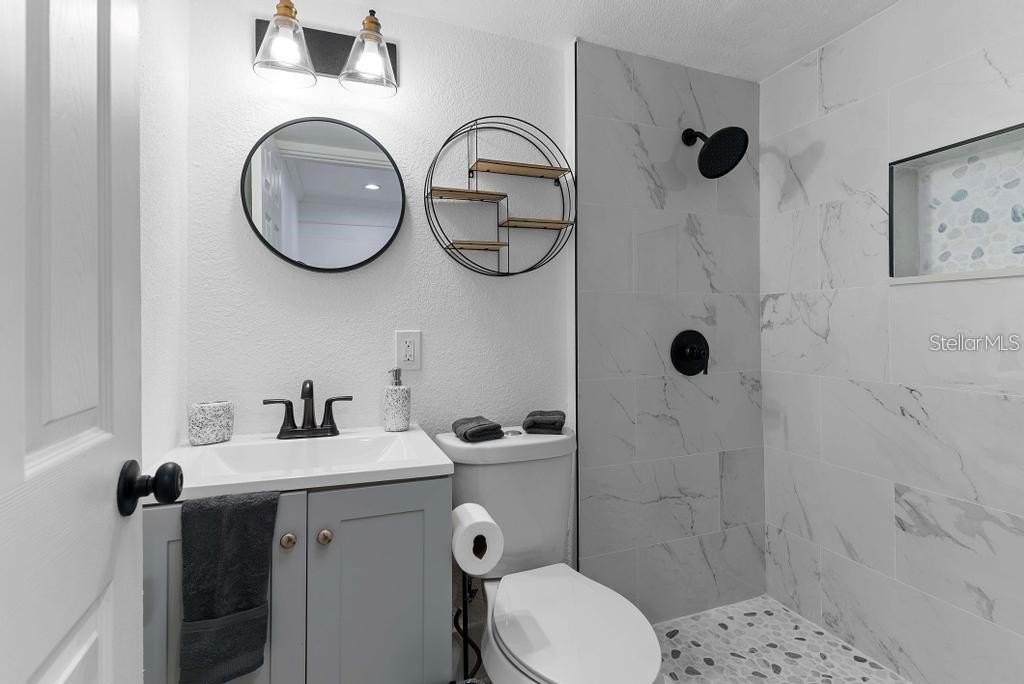
Built in 1920, this 1,886-square-foot quadplex contains 4 residential units with a combined total of 5 bedrooms and 4 bathrooms. The interiors include open floorplans, primary bedrooms on the main floor, vinyl flooring, central heating and central air. Kitchens are equipped with microwaves and refrigerators, while a courtyard and driveway provide additional functional features. Stucco construction, a shake roof, a fireplace, and public water and sewer complete the property profile.
The property is located at 412 E HARWOOD Street in Orlando’s 32803 ZIP code, near Lake Eola Park and within walking distance of restaurants, bars, theaters, and nightlife. Disney World, Universal Studios, and Sea World are identified as a short drive away. Furniture is available for separate purchase by negotiation.
The property is located at 412 E HARWOOD Street in Orlando’s 32803 ZIP code, near Lake Eola Park and within walking distance of restaurants, bars, theaters, and nightlife. Disney World, Universal Studios, and Sea World are identified as a short drive away. Furniture is available for separate purchase by negotiation.
Key Highlights
- 4 residential units with 5 bedrooms and 4 bathrooms
- 1,886 square feet on a 0.18‑acre lot
- R2 zoning with public water and public sewer
Financial Insights
Estimated NOI and Cap Rate
NOI / Yr
$26,757
Cap Rate
2.97%
Suggested Prices Based on Cap Rates
Cap Rate 5%
$535,140
$535.1K
Cap Rate 7%
$382,243
$382.2K
Cap Rate 9%
$297,300
$297.3K
Market Conditions
NOI Build-Up for 1,886 SF
Gross rent
$40.7K $21.60/SF
− Vacancy
−$2.5K −$1.33/SF
EGI
$38.2K $20.27/SF
− OpEx
−$11.5K −$6.08/SF
NOI
$26.8K $14.19/SF
Area
Orlando, FL
Vacancy
6.17%
Lease Rate
$21.60 /SF/Yr
Expense Ratio
30.00%
Simulate Cap Rate and NOI
Suggested Prices Based on Cap Rates
Cap Rate 5%
$535,140
Cap Rate 7%
$382,243
Cap Rate 9%
$297,300
Alternative Uses
Best Use
Multifamily LT 5
$382.2K
$334.5K – $446.0K
NOI $26,757 @ 7.0% cap · market cap 2.97%
Second Best
Apartment 5plus
$349.2K
$305.5K – $407.4K
NOI $24,441 @ 7.0% cap · market cap 2.72%
Theoretical Best
Office A
$607.5K
$531.6K – $708.8K
NOI $42,528 @ 7.0% cap · market cap 4.73%
Zoning and permitted uses should be independently verified with authorities.
How Realmo checks its estimates
Property Analytics
Unlock full access to Insights
Subscribe to Realmo Intelligence
Open Analytics
Current Use
Lease Details
4
Residential units
Location Intelligence
Trade Area within ½ mile
8,533
Businesses Nearby
Explore this area
Business Placement
Demographics for 32803, FL
21,003
Population
12,225
Households
1.7
Avg Household Size
38
Median Age
59%
College-Educated
96%
High-School Grad
6.8 sq mi
ZIP Area
3,089
Density / Sq Mi
$101,401
Median Household Income
$61,439
Median Earnings
$1,823
Median Rent
$421,300
Median Home Value
Check the figures for this property
Cap Rate, Value Estimation, Potential NOI and more
View Realmo Analytics
Market
Vacancy Rate% for Multifamily in South region

Questions? Ask Rey
Realmo’s AI knows this listing — price, zoning, demand, history. Ask anything.






Frequently Asked Questions
What type of property is this?
Quadplex - R2-zoned residential property with modern finishes, courtyard space, public utilities, and a central Orlando setting.
Where is this quadplex located?
The property is located at 412 E HARWOOD Street Orlando, FL.
What is the asking price?
The asking price for this property is $899,900.
What are key features of this property?
This property features: 4 residential units with 5 bedrooms and 4 bathrooms; 1,886 square feet on a 0.18‑acre lot; R2 zoning with public water and public sewer


