Restaurant Building with Complete
For Sale
$174,900
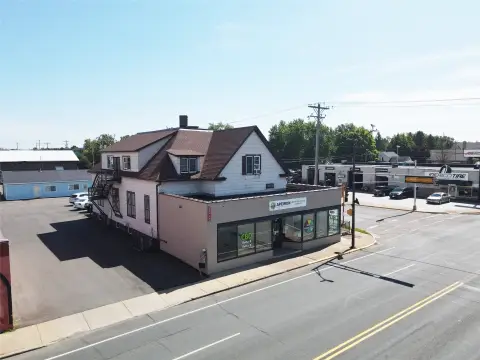
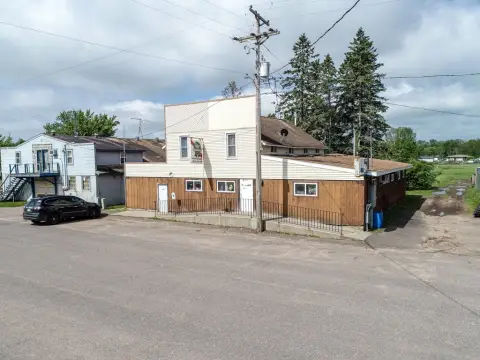
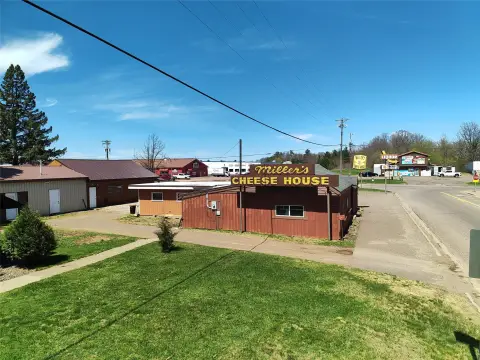
407 S Main St, Rice Lake, WI 54868
Existing restaurant improvements include a walk-in cooler and additional downstairs storage.
Property Size2,400 SF
Price / SF$72.88
Days on Market51
Property Features for 407 S Main St
General Information
Standard status
Active
Size
2,400 SF
Additional Details
Equipment Included
Yes
Amenities
complete kitchen
walk-in cooler
downstairs storage
Building Details
Year Built
1946
Buildings
1
Tenancy
Single
Listing Agency:
Team Realty
Listed By:
Layne Grover · License #28584-90
(715) 234-1991
Source:
Homcentric
Added: Aug 16
Changed: Oct 3
Last Checked: Oct 4 at 12:30PM
Displayed information is deemed reliable but is not guaranteed and should be independently verified. All listing content including descriptions, pricing, images are the copyrighted material of Team Realty
Investment Insights
Based on property information with market context.
This restaurant property includes a complete kitchen, walk-in cooler, and additional storage on the lower level. The layout can accommodate seating for more than 50 customers and may support continued restaurant use or other commercial occupancy, subject to applicable requirements.
The building is positioned on S Main St in Rice Lake, directly across from Marketplace Foods and near Casa Mexicana Grill and Cantina. The property was previously operated as the Mandarin Restaurant and, earlier, Russ’s Pancake House.
The building is positioned on S Main St in Rice Lake, directly across from Marketplace Foods and near Casa Mexicana Grill and Cantina. The property was previously operated as the Mandarin Restaurant and, earlier, Russ’s Pancake House.
Key Highlights
- Restaurant layout accommodates seating for over 50 customers
- Complete kitchen included with the property
- Walk‑in cooler in place
Financial Insights
Estimated NOI and Cap Rate
NOI / Yr
$9,677
Cap Rate
5.53%
Suggested Prices Based on Cap Rates
Cap Rate 5%
$193,540
$193.5K
Cap Rate 7%
$138,243
$138.2K
Cap Rate 9%
$107,522
$107.5K
Market Conditions
NOI Build-Up for 2,400 SF
Gross rent
$14.4K $6.00/SF
− Vacancy
−$576 −$0.24/SF
EGI
$13.8K $5.76/SF
− OpEx
−$4.1K −$1.73/SF
NOI
$9.7K $4.03/SF
Area
Barron County, WI
Vacancy
4.00%
Lease Rate
$6.00 /SF/Yr
Expense Ratio
30.00%
Simulate Cap Rate and NOI
Suggested Prices Based on Cap Rates
Cap Rate 5%
$193,540
Cap Rate 7%
$138,243
Cap Rate 9%
$107,522
Alternative Uses
Best Use
Industrial
$1.59M
$1.39M – $1.85M
NOI $111,163 @ 7.0% cap · market cap 63.56%
Second Best
Specialty Retail
$300.5K
$263.0K – $350.6K
NOI $21,038 @ 7.0% cap · market cap 12.03%
Theoretical Best
Warehouse
$1.93M
$1.69M – $2.25M
NOI $134,983 @ 7.0% cap · market cap 77.18%
Zoning and permitted uses should be independently verified with authorities.
Property Analytics
Unlock full access to Insights
Subscribe to Realmo Intelligence
Open Analytics
Current Use
Lease Details
Single-tenant
Tenancy
Location Intelligence
Trade Area within ½ mile
483
Businesses Nearby
Under-served
Demand for This Use
Explore this area
Business Placement
Demographics for 54868, WI
15,785
Population
7,640
Households
2.1
Avg Household Size
44
Median Age
25%
College-Educated
94%
High-School Grad
212.0 sq mi
ZIP Area
74
Density / Sq Mi
$64,567
Median Household Income
$40,474
Median Earnings
$850
Median Rent
$199,300
Median Home Value
Check the figures for this property
Cap Rate, Value Estimation, Potential NOI and more
View Realmo Analytics
Market
Vacancy Rate% for Retail in Midwest region

Questions? Ask Rey
Realmo’s AI knows this listing — price, zoning, demand, history. Ask anything.



Frequently Asked Questions
What type of property is this?
Conventional restaurant - Existing restaurant improvements include a walk-in cooler and additional downstairs storage.
Where is this conventional restaurant located?
The property is located at 407 S Main St Rice Lake, WI.
What is the asking price?
The asking price for this property is $174,900.
What are key features of this property?
This property features: Restaurant layout accommodates seating for over 50 customers; Complete kitchen included with the property; Walk‑in cooler in place


