Renovated Mixed-Use Theater
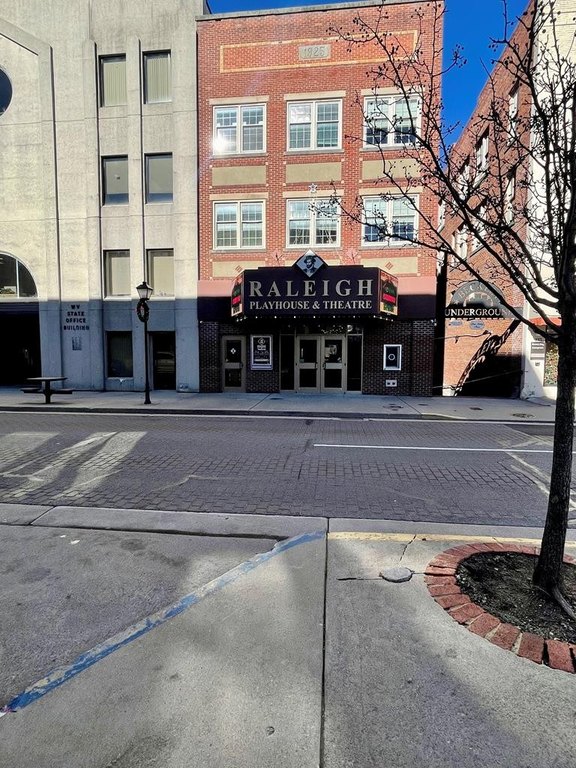
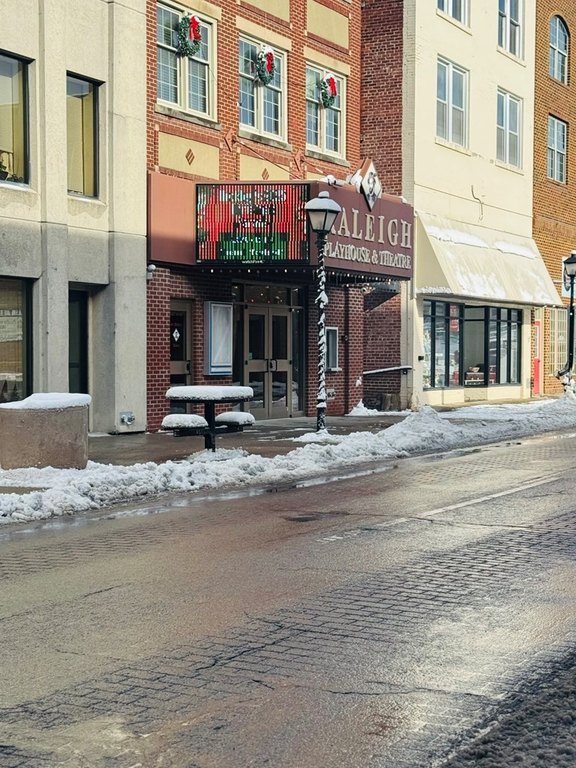
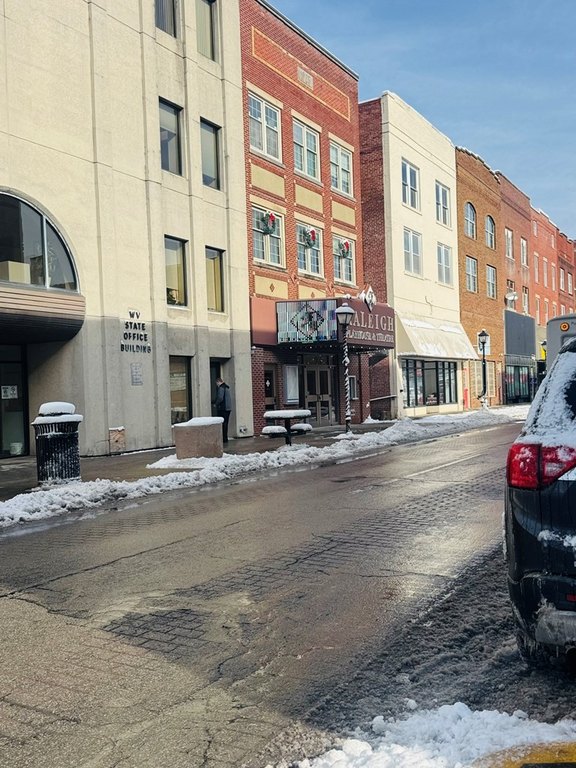
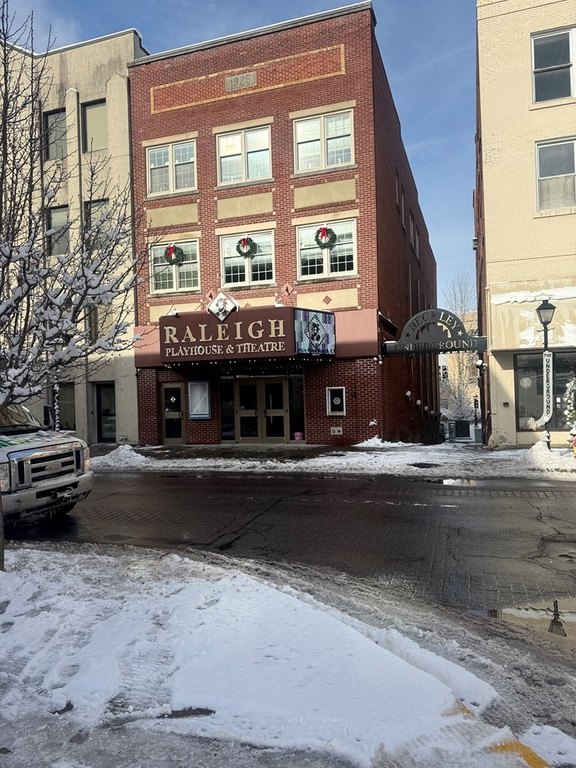
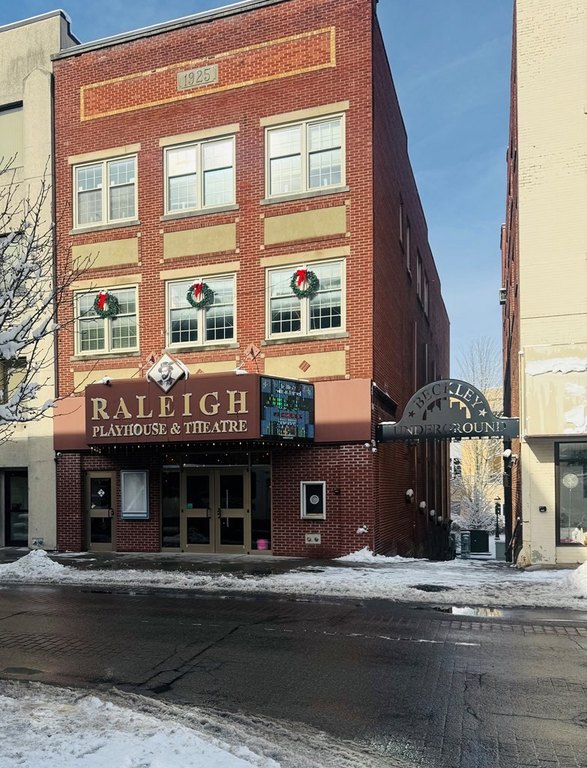
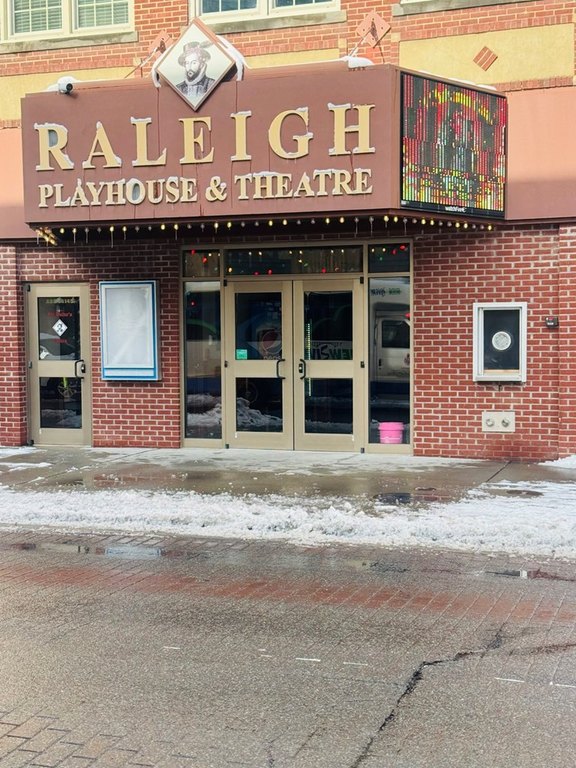
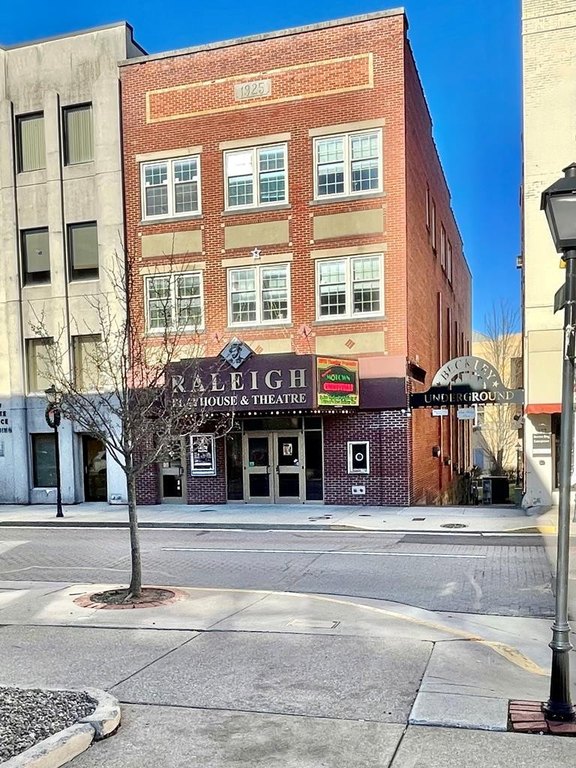
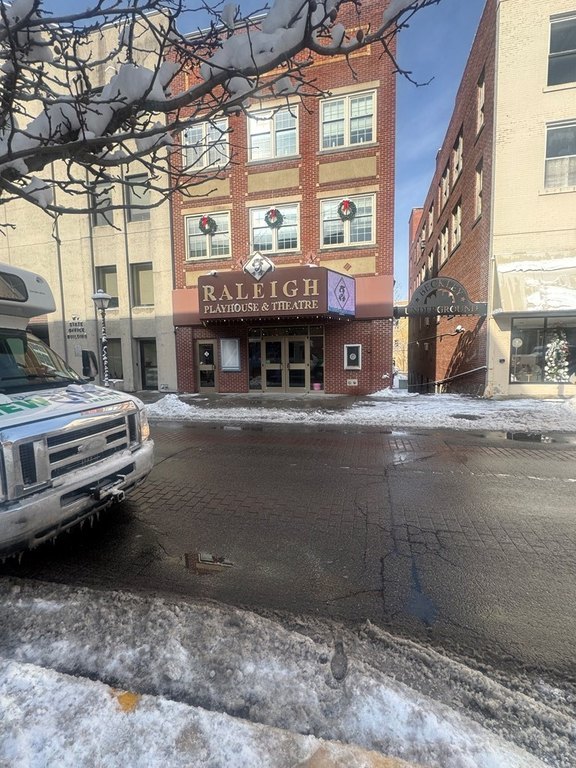
For Sale
$1,250,000
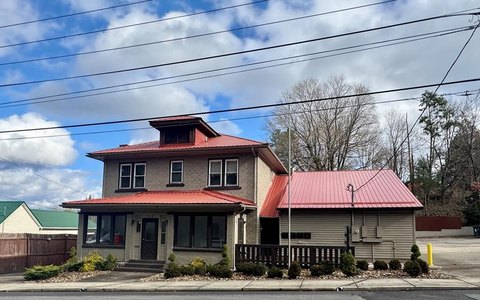
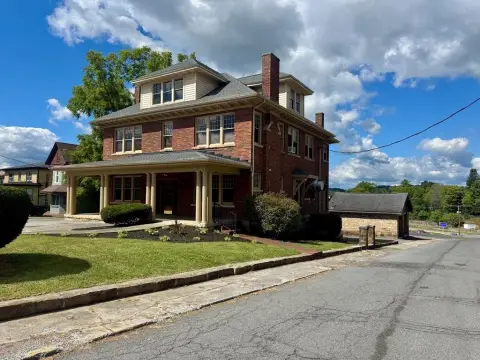
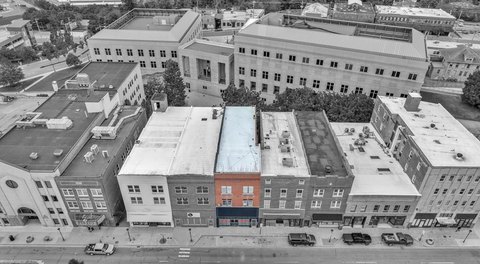
403 NEVILLE STREET, Beckley, WV 25801
Commercial Sale, BECKLEY, WV
Property Size8,808 SF
Lot Size0.08 Acres
Price / SF$141.92
Days on Market299
Property Features for 403 NEVILLE STREET
General Information
Property type
Commercial Sale
Property subtype
Other
Subdivision
Area 1
Standard status
Active
Size
8,808 SF
Lot size
0.08 Acres
Building Details
Year built
1925
Listing Agency:
ARMES REAL ESTATE & LAND COMPANY INC.
(304) 890-2388
Listed By:
Lisa Armes · License #WVB230300912
(681) 238-5495
Added: Dec 11, 2025
Changed: Sep 6
Last Checked: Oct 6 at 4:06AM
MLS# 93312
Copyright © 2026 Beckley Board of Realtors. All rights reserved. All information provided by the listing agent/broker is deemed reliable but is not guaranteed and should be independently verified.
Investment Insights
Based on property information with market context.
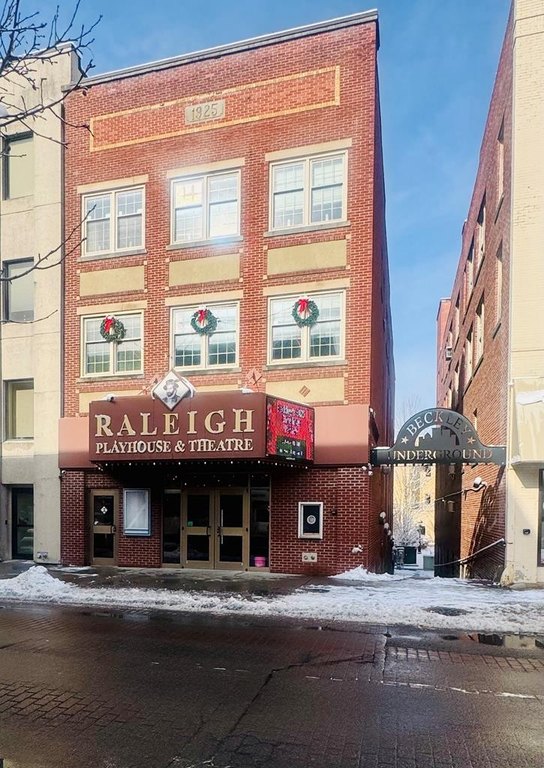
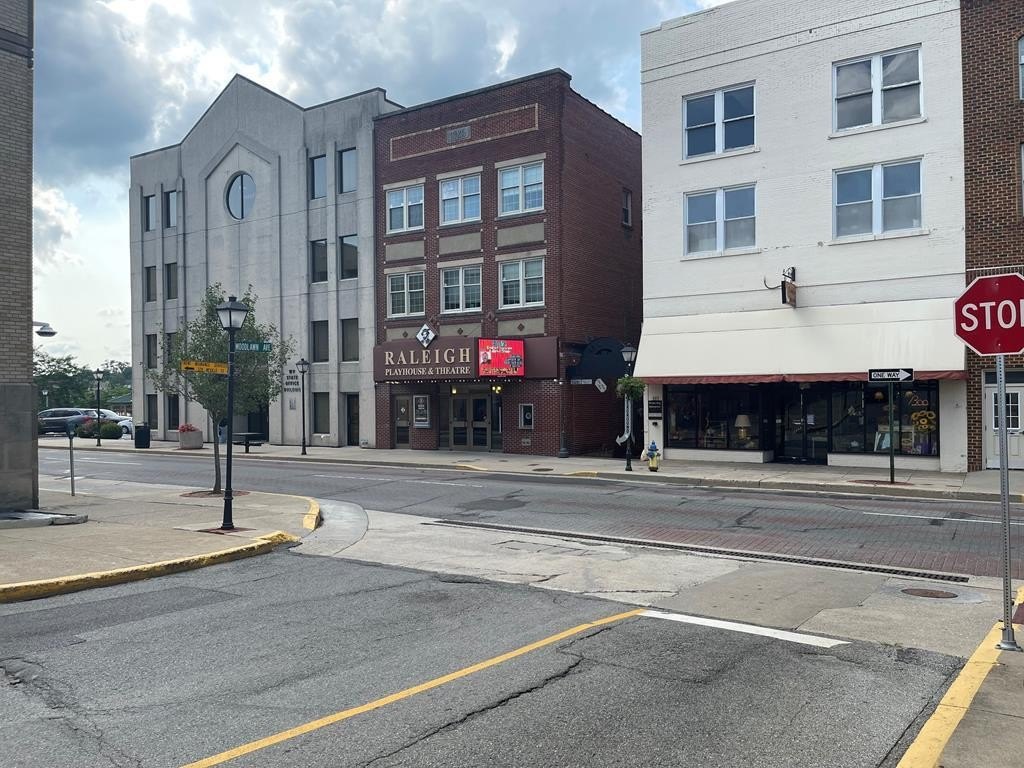
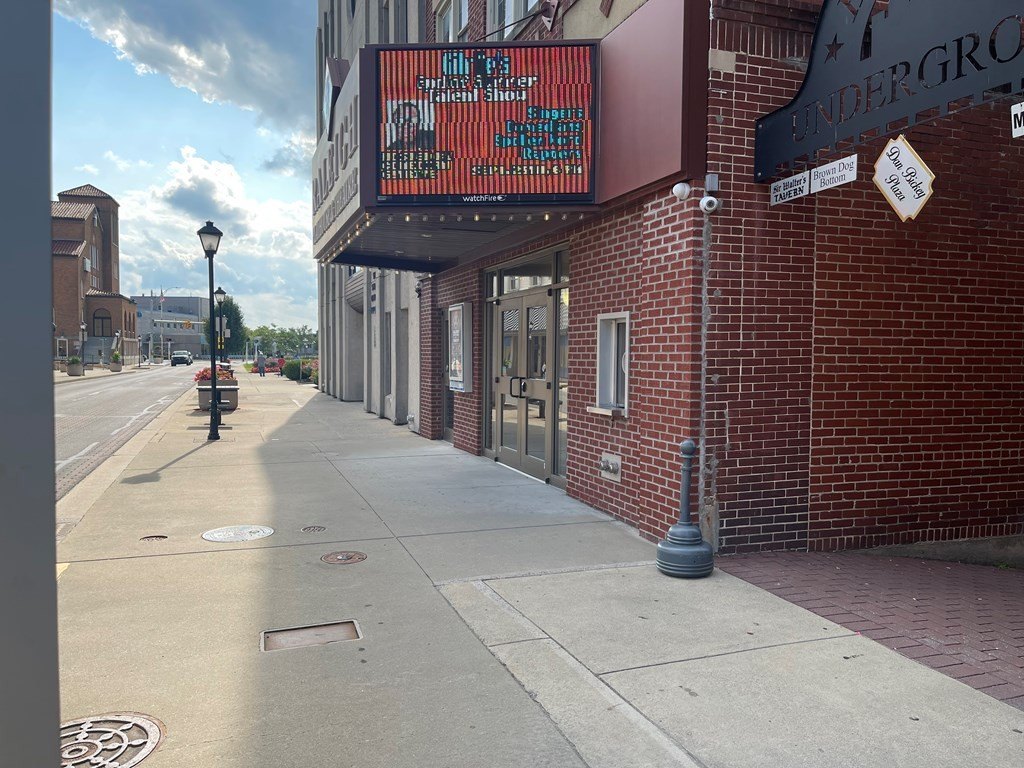
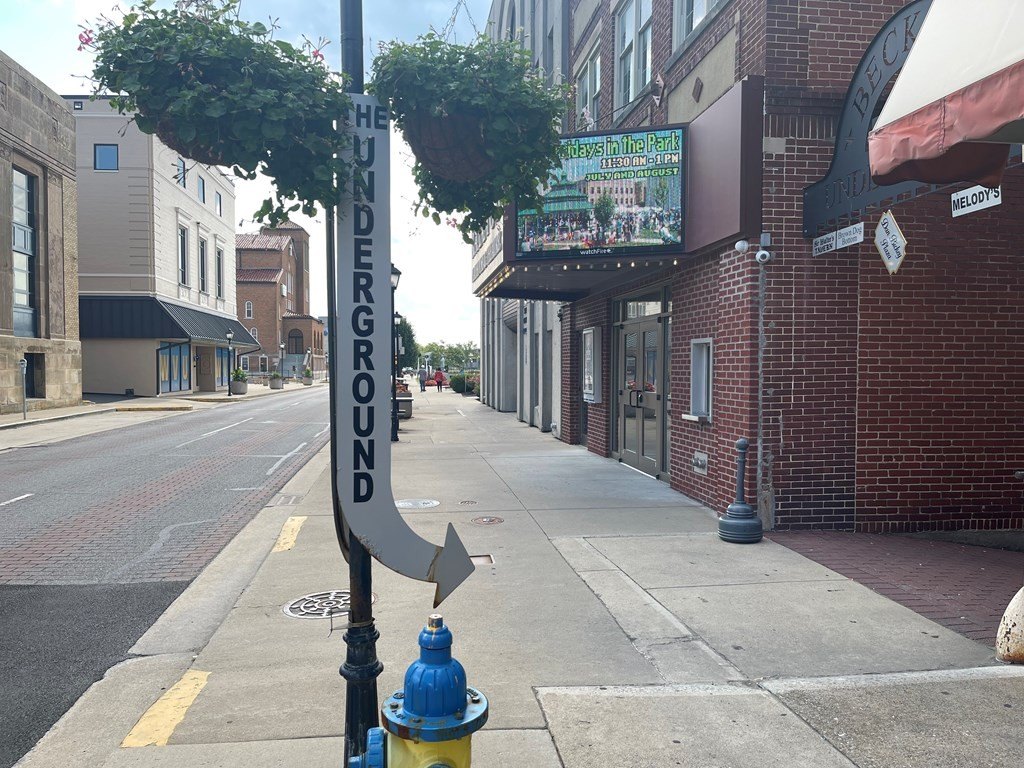
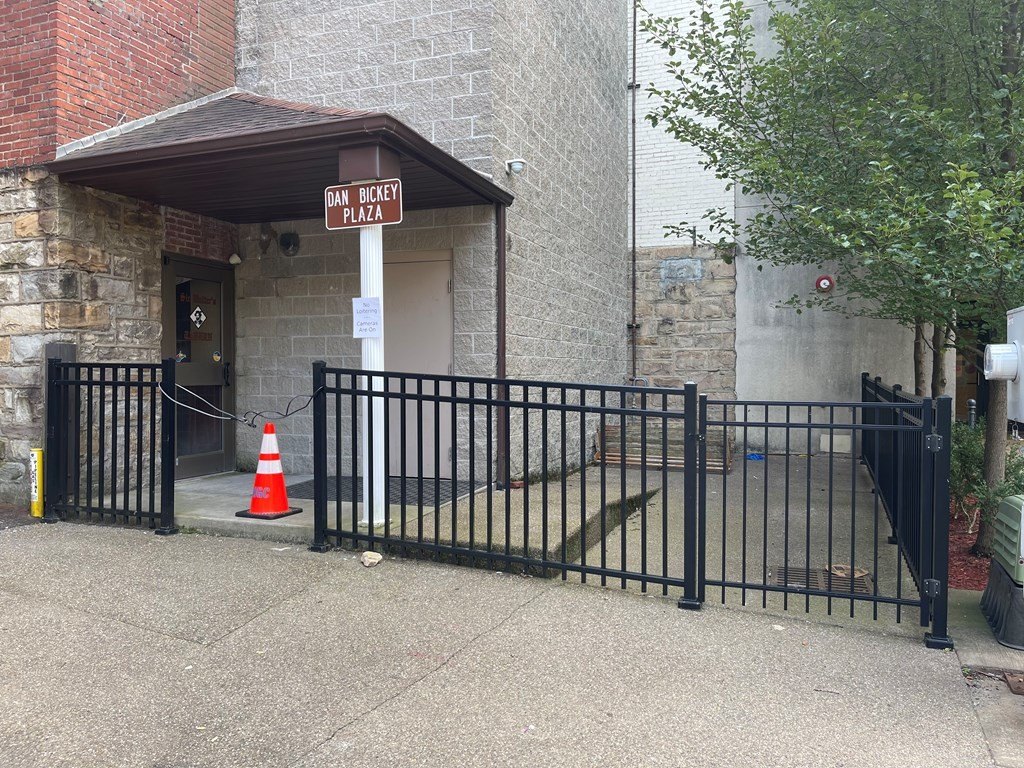
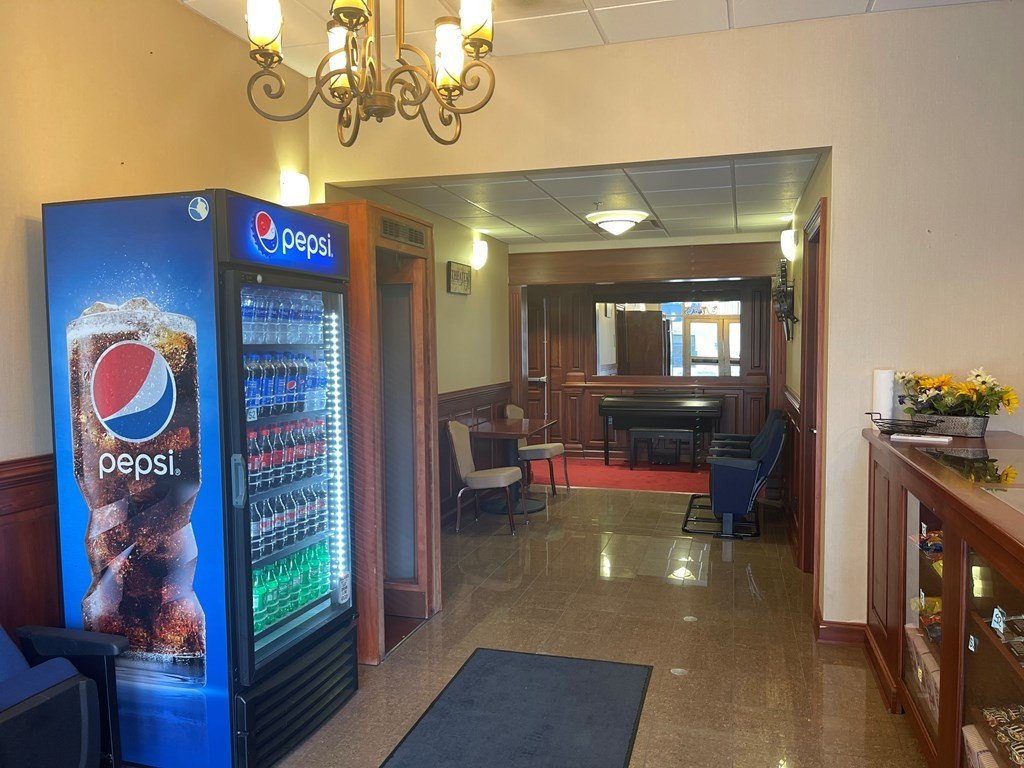
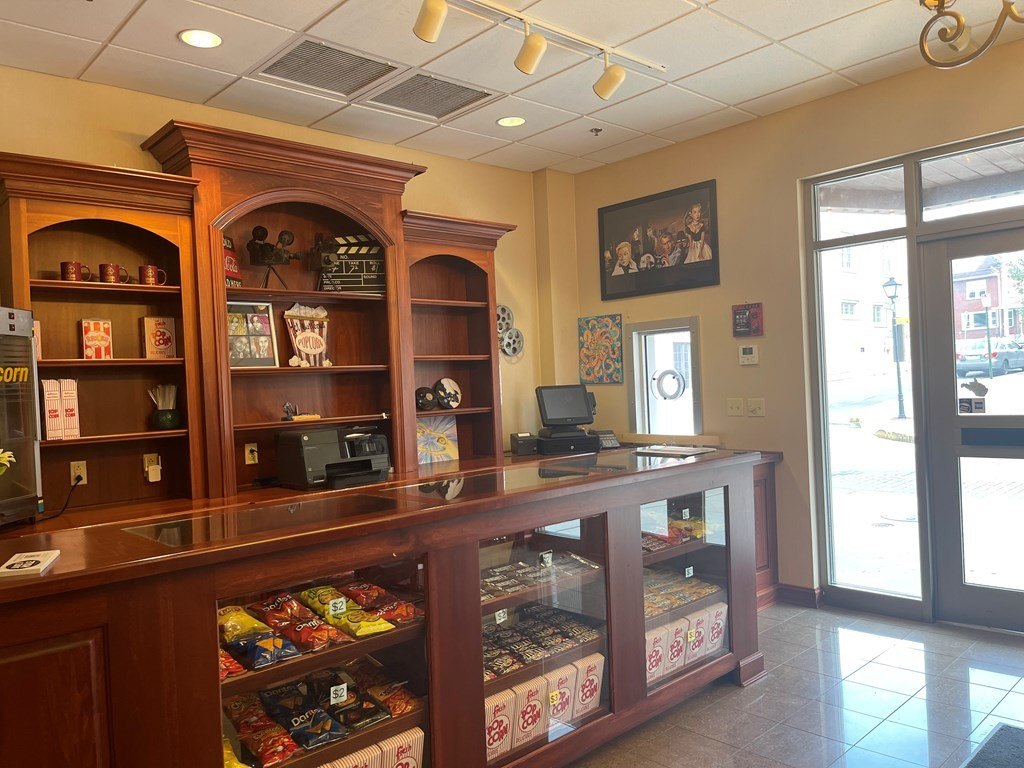
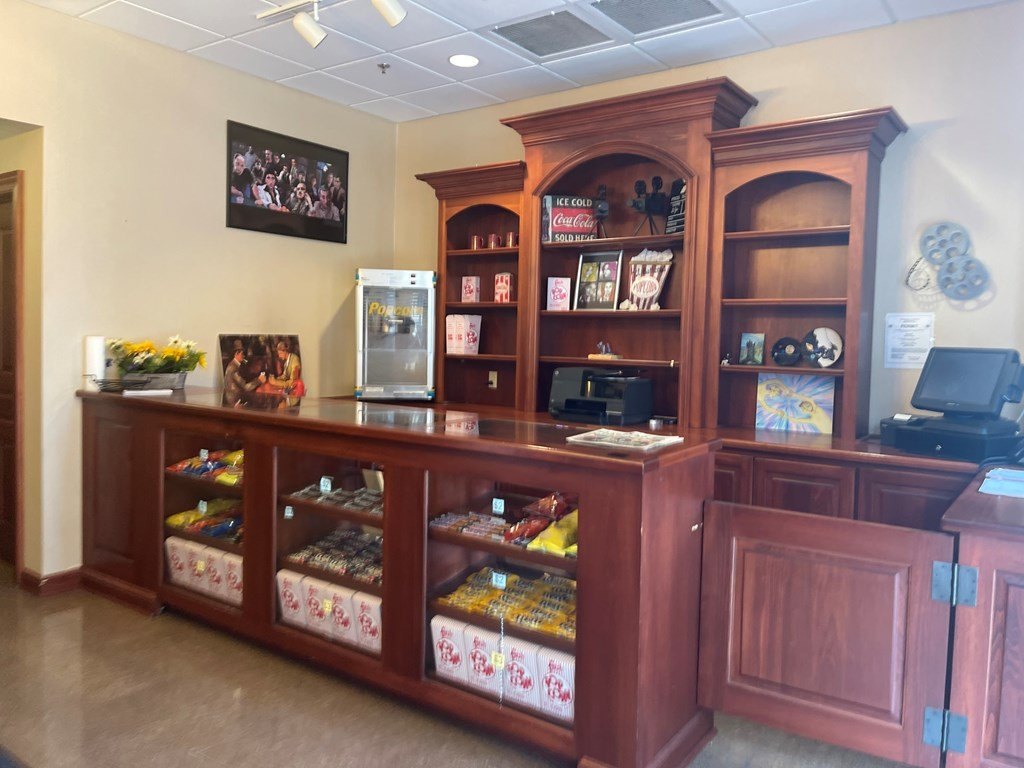
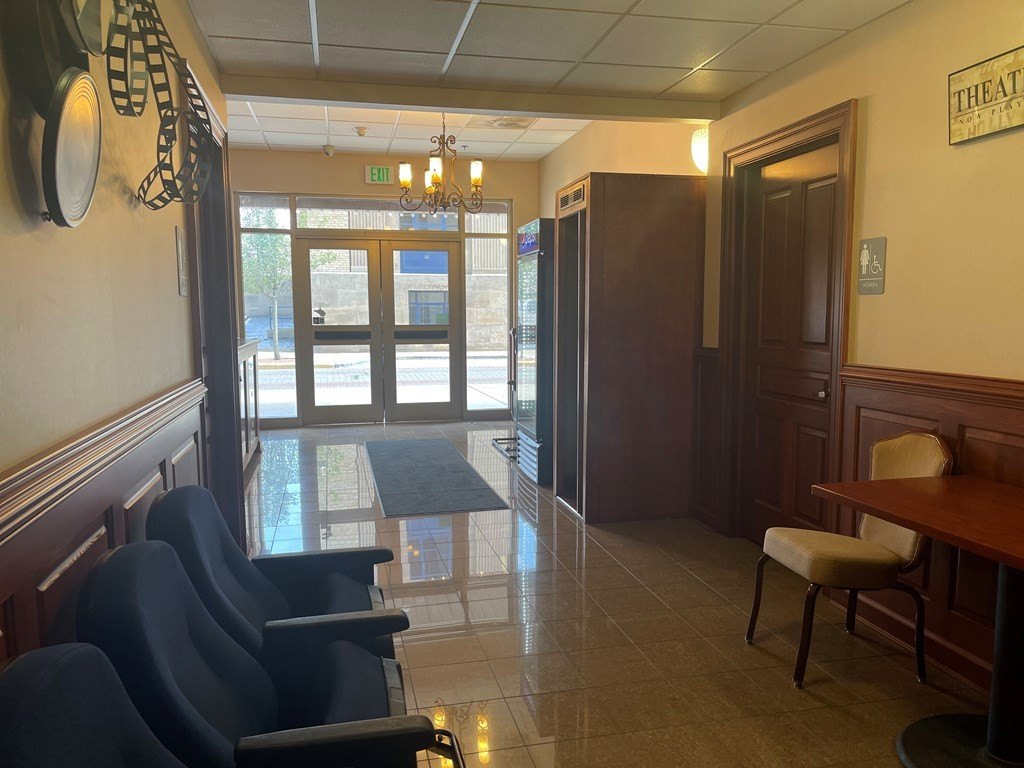
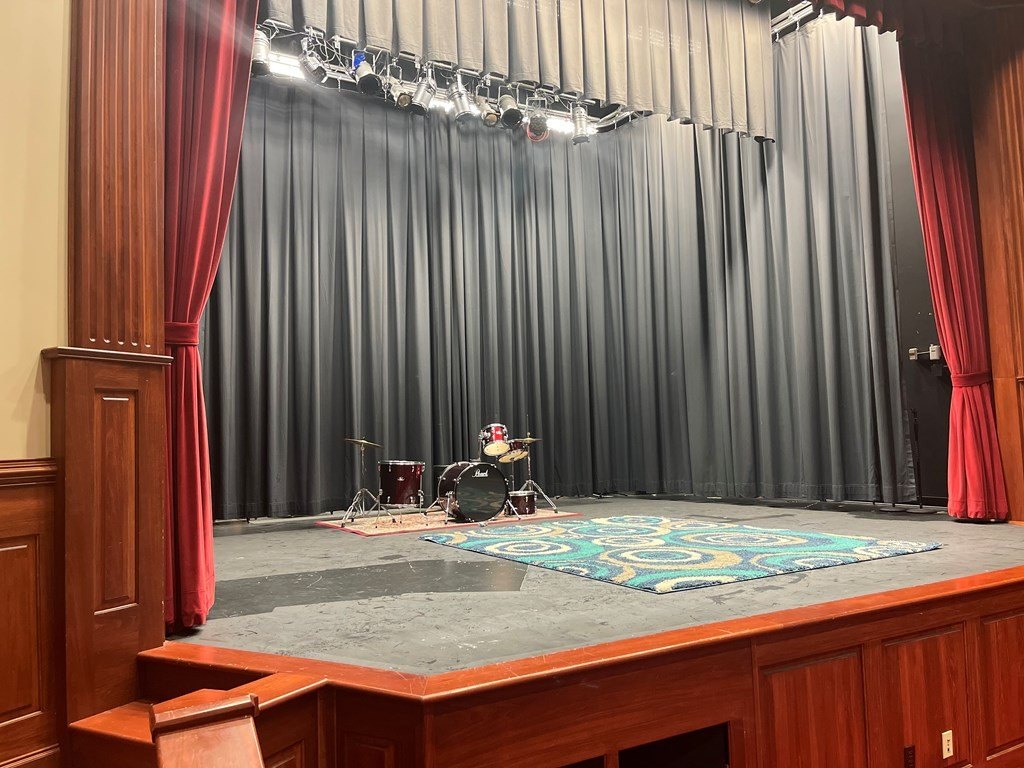
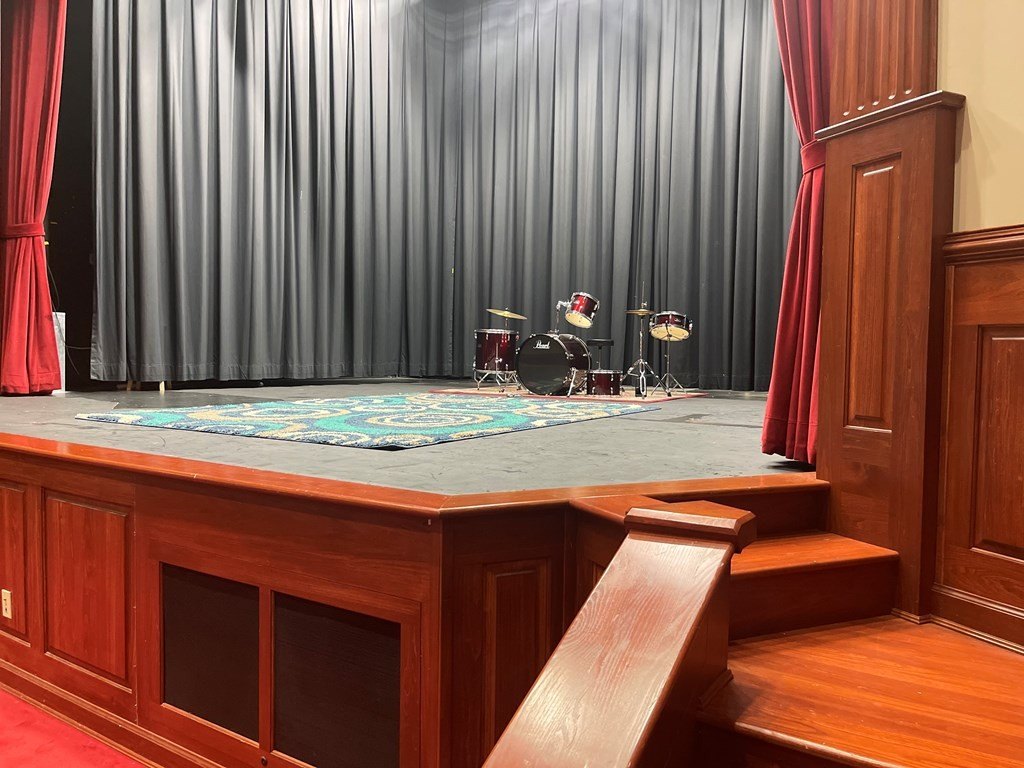
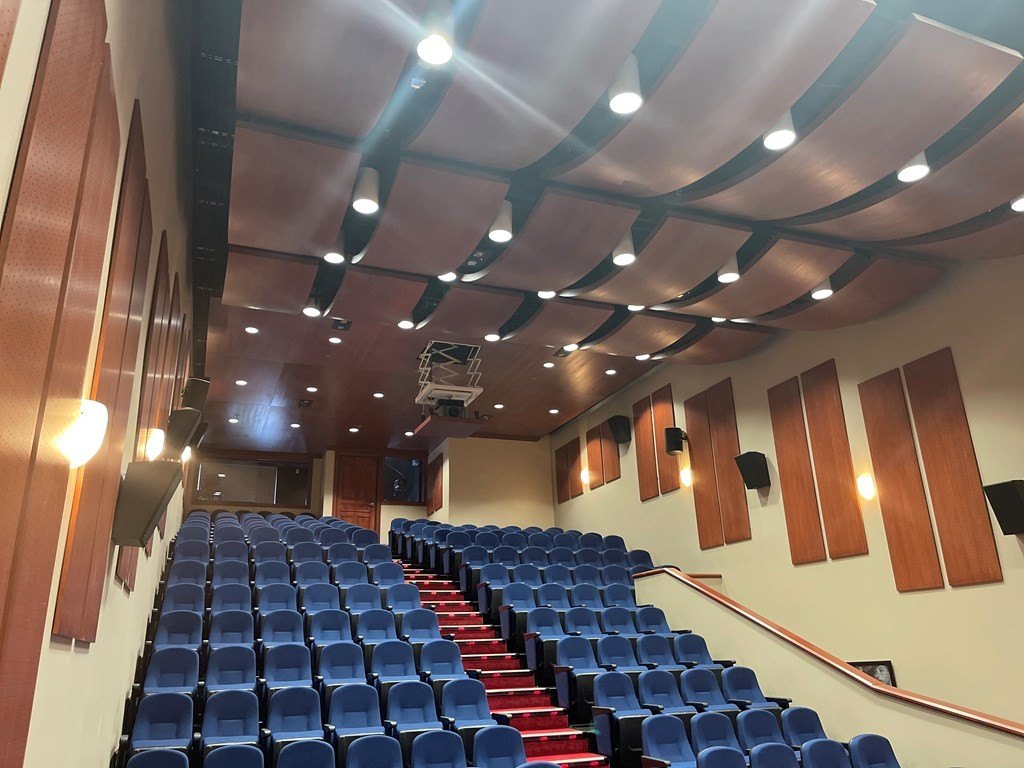
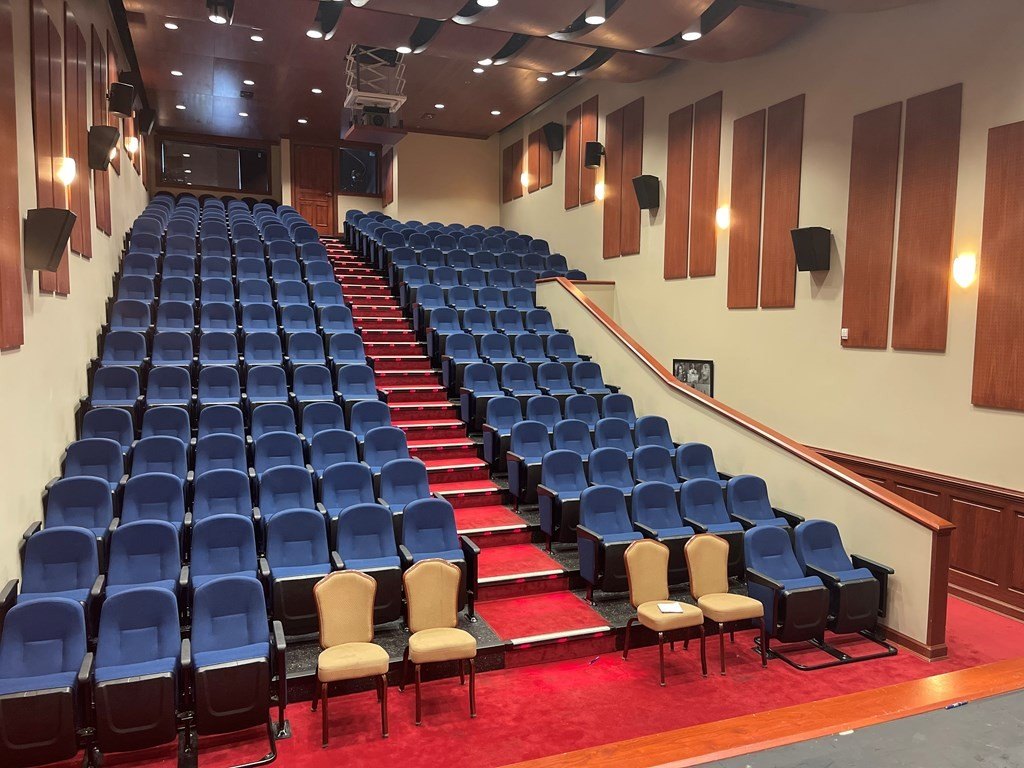
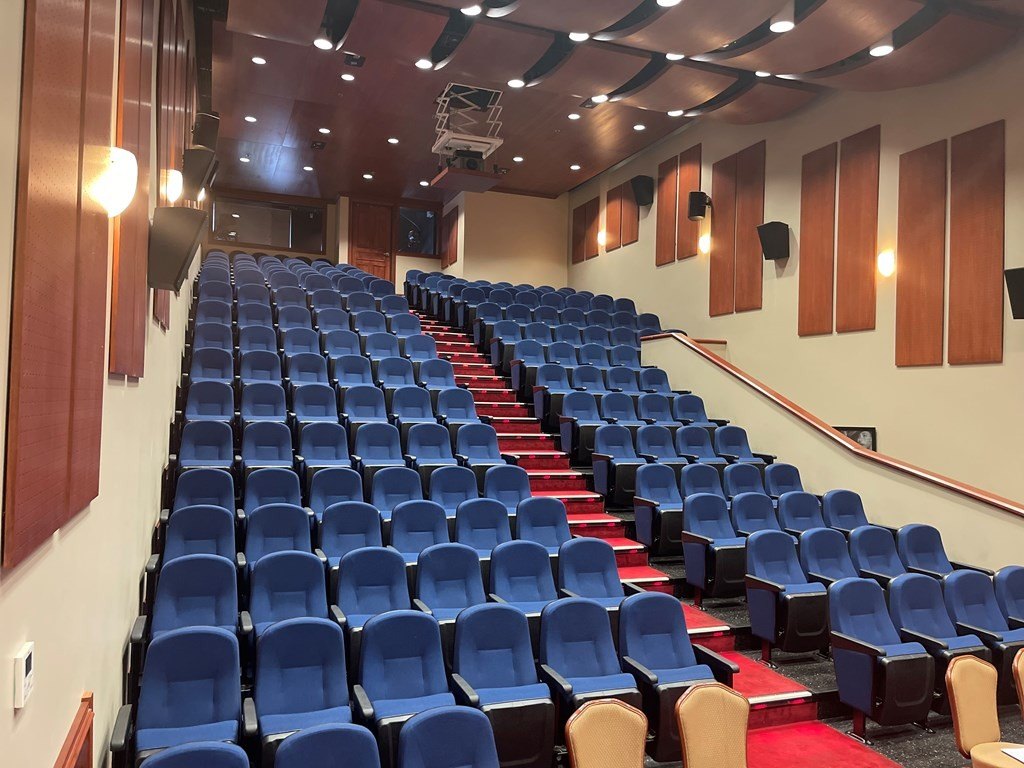
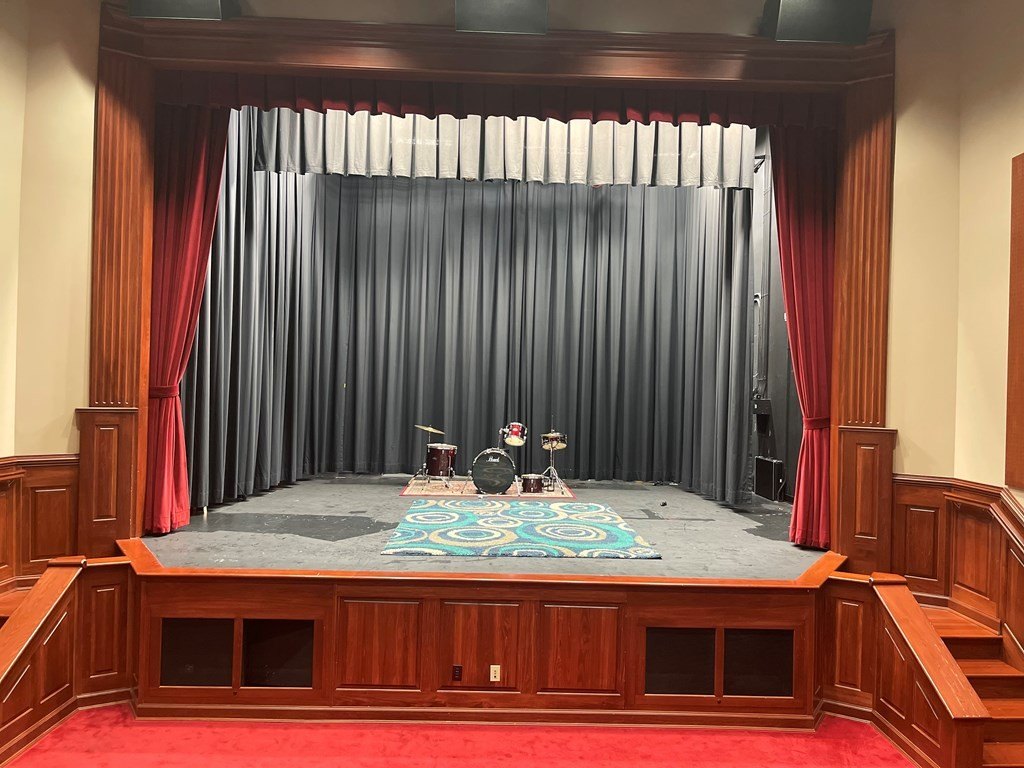
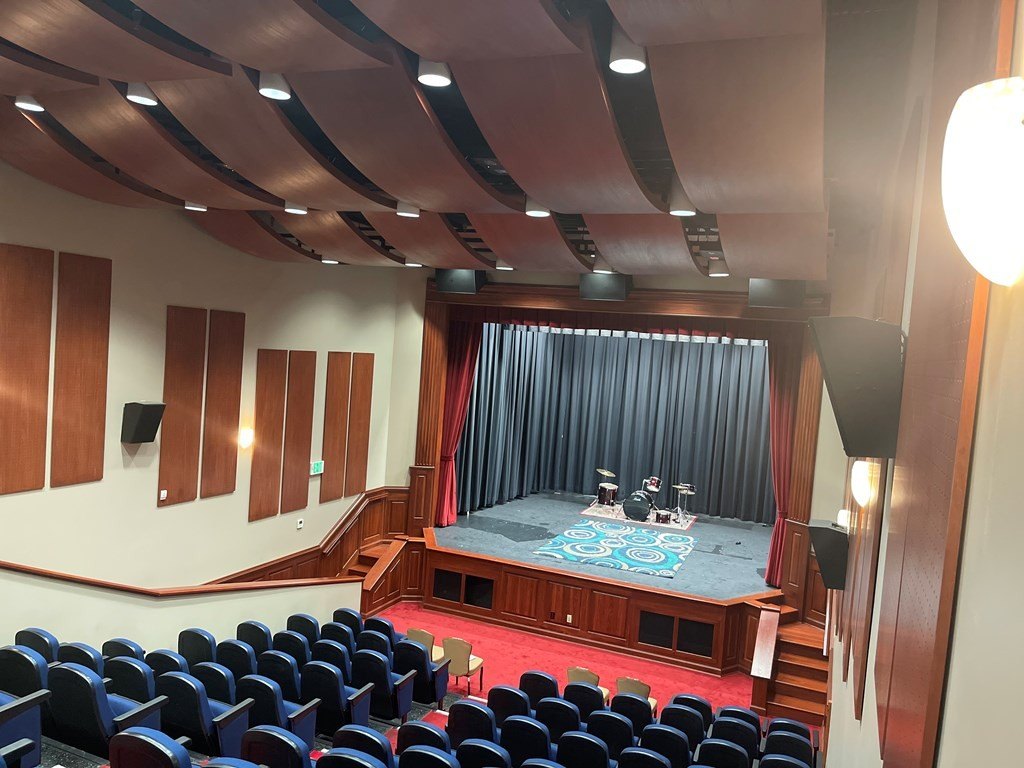
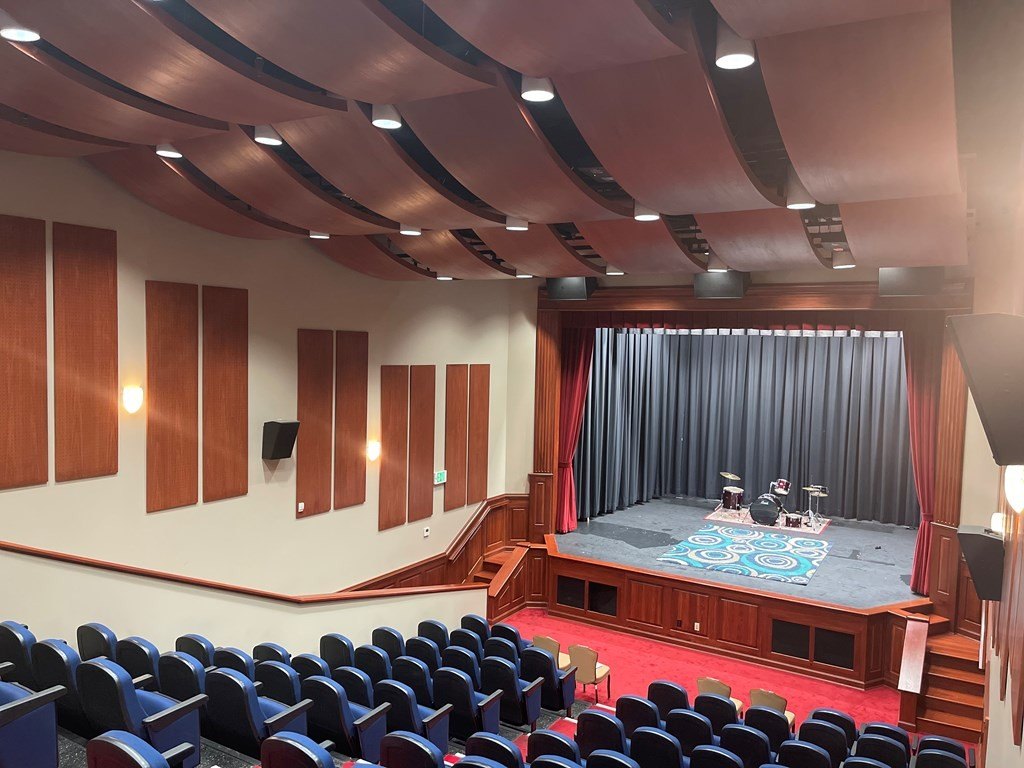
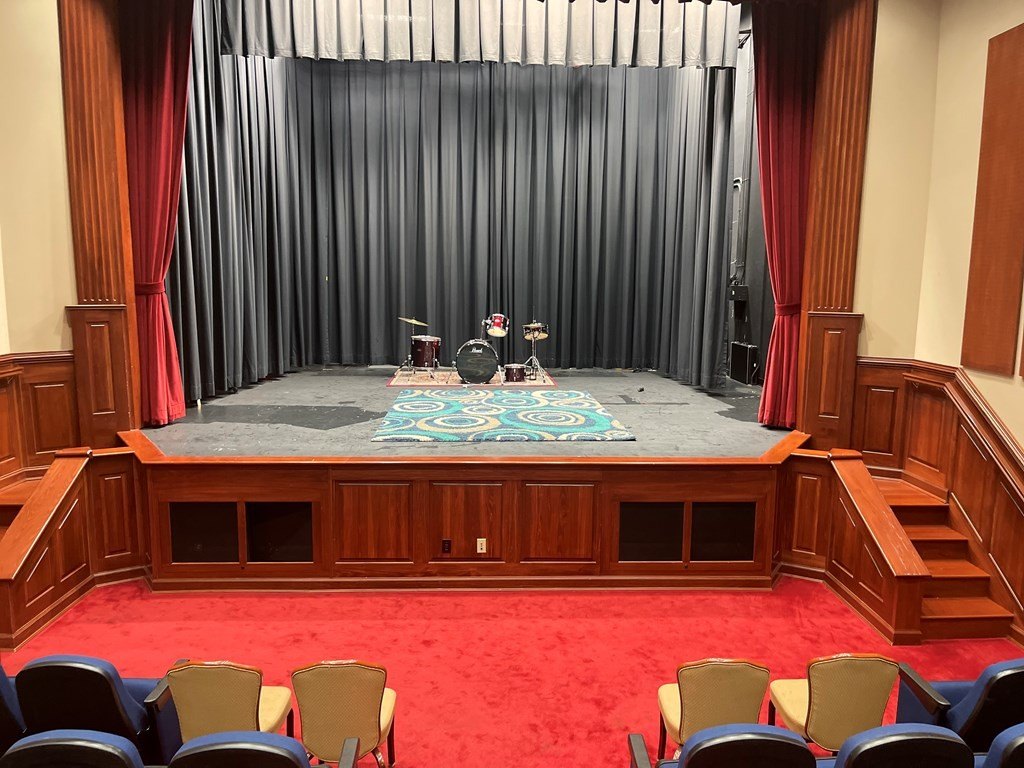
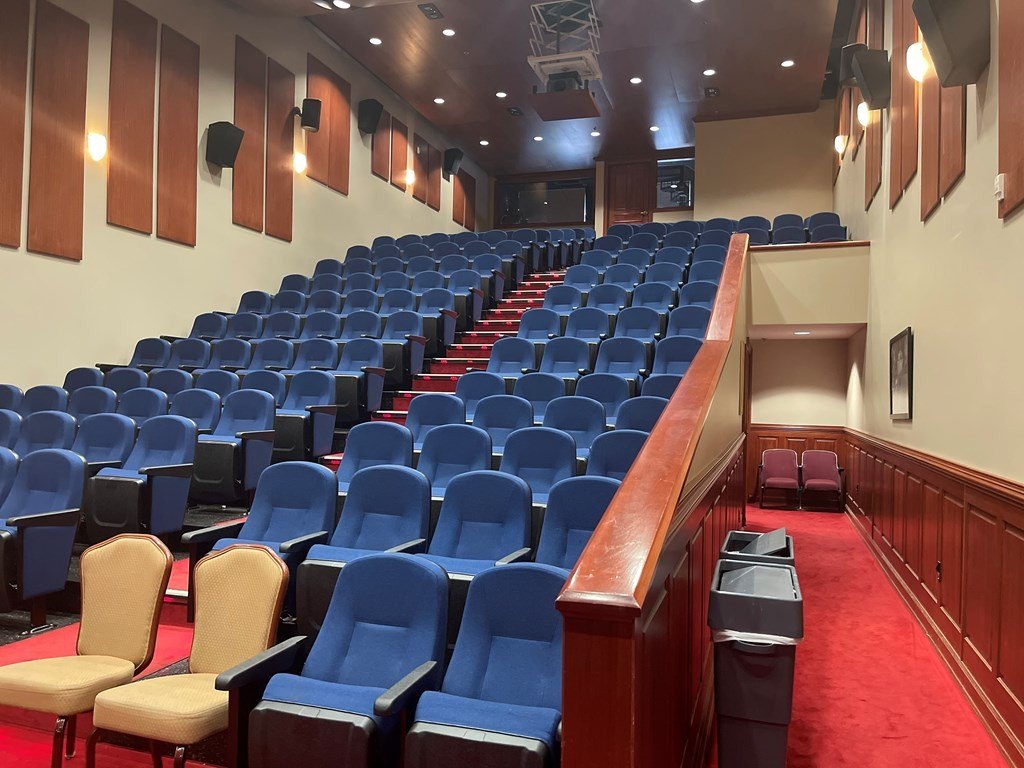
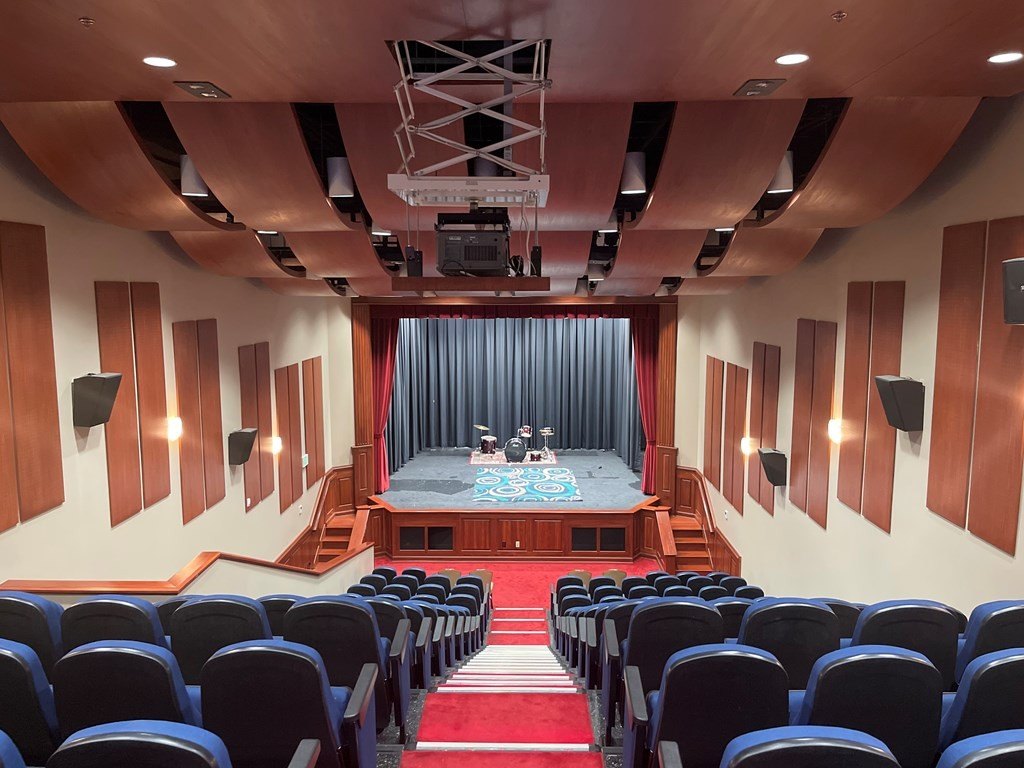
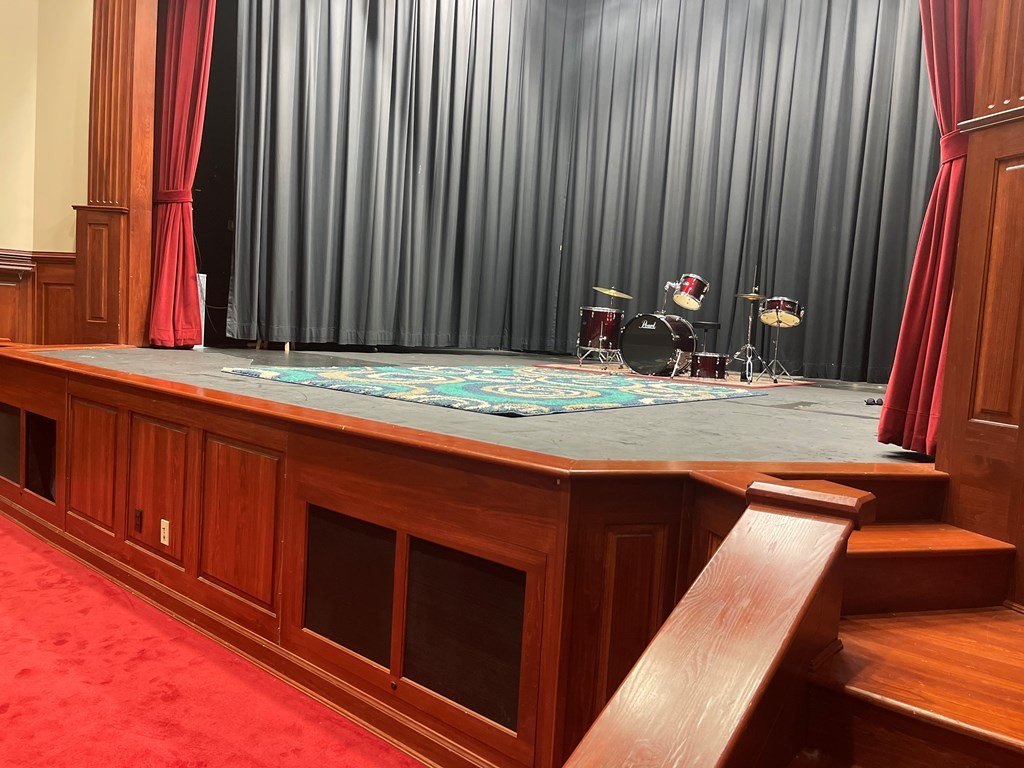
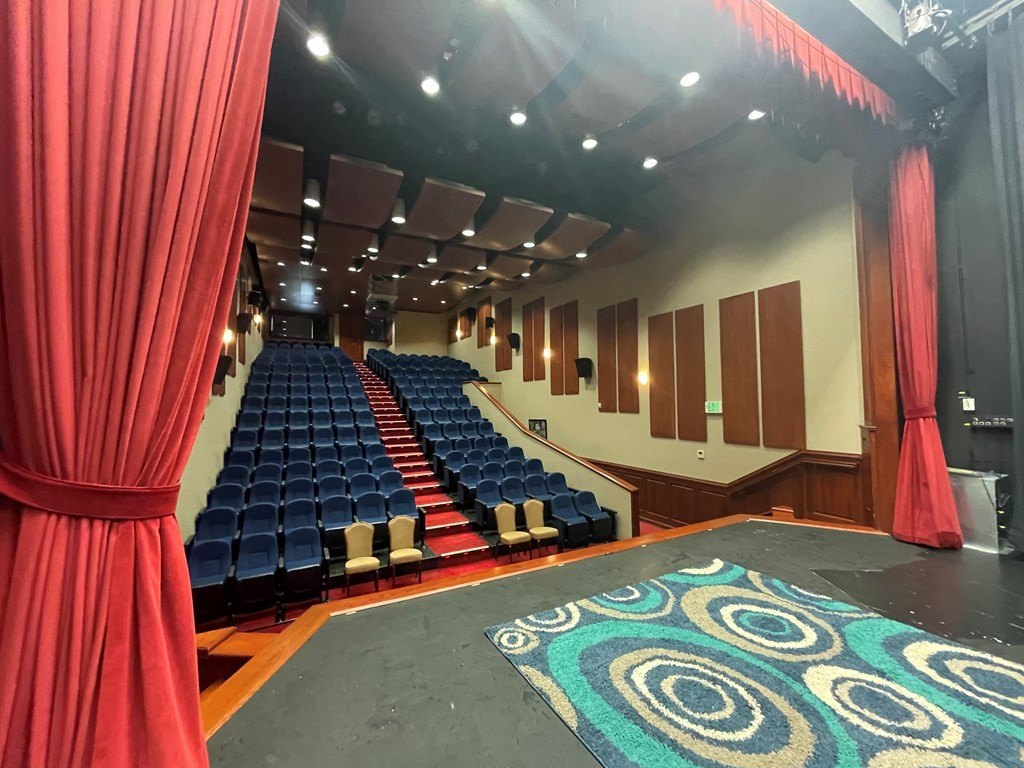
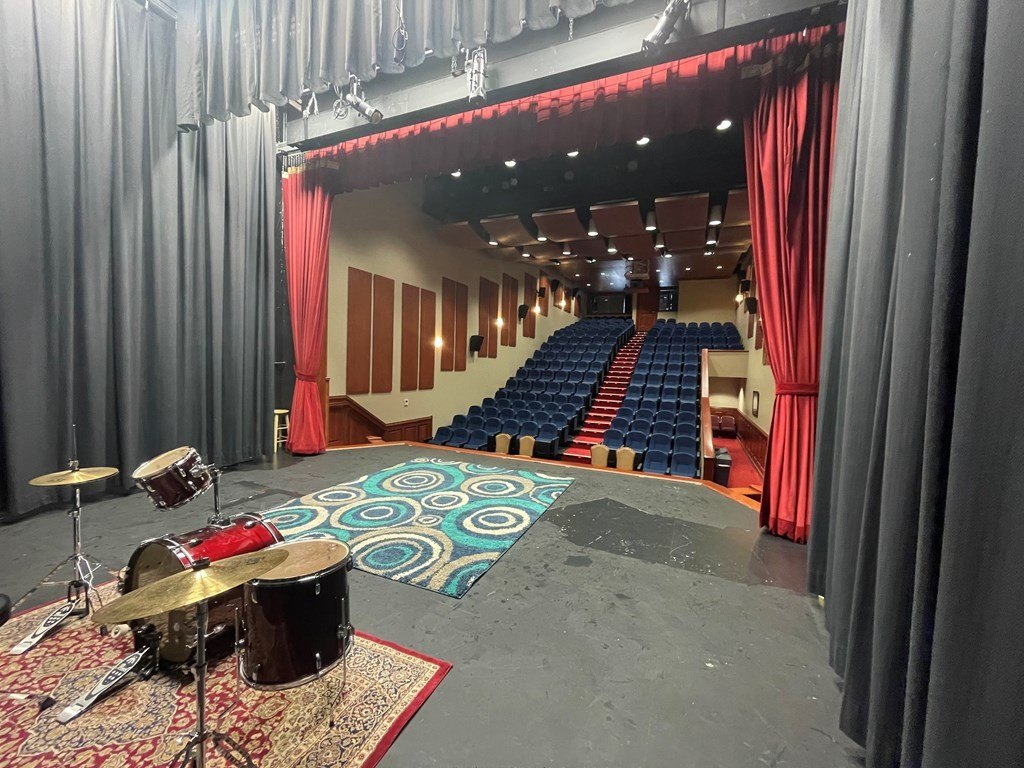
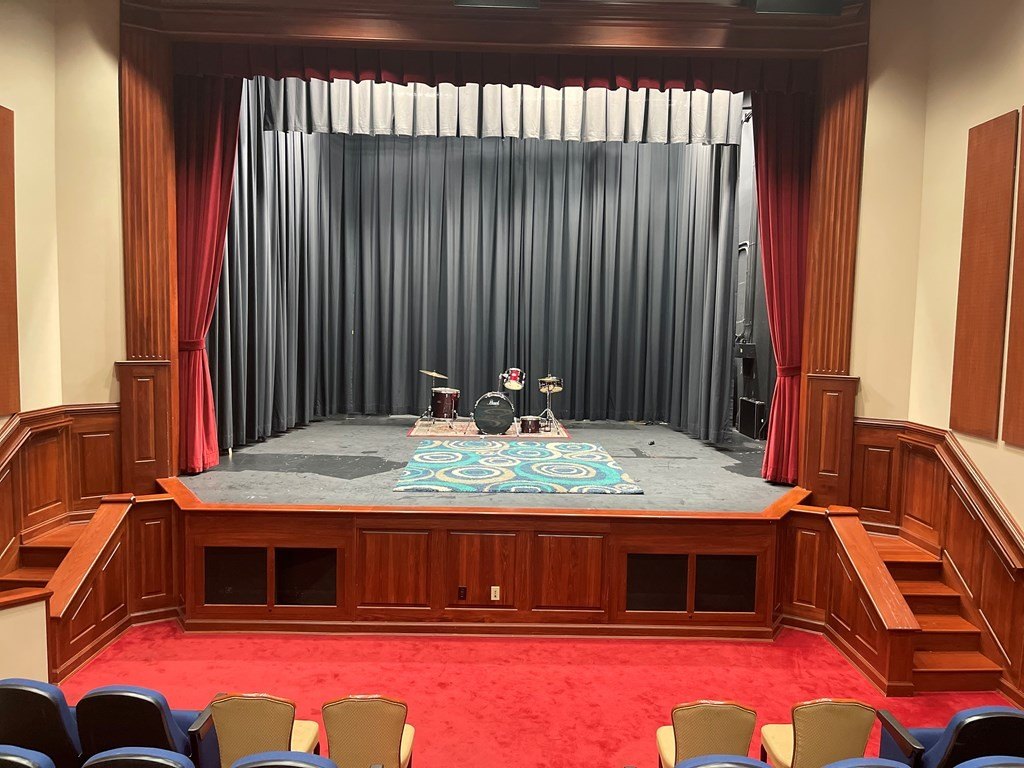
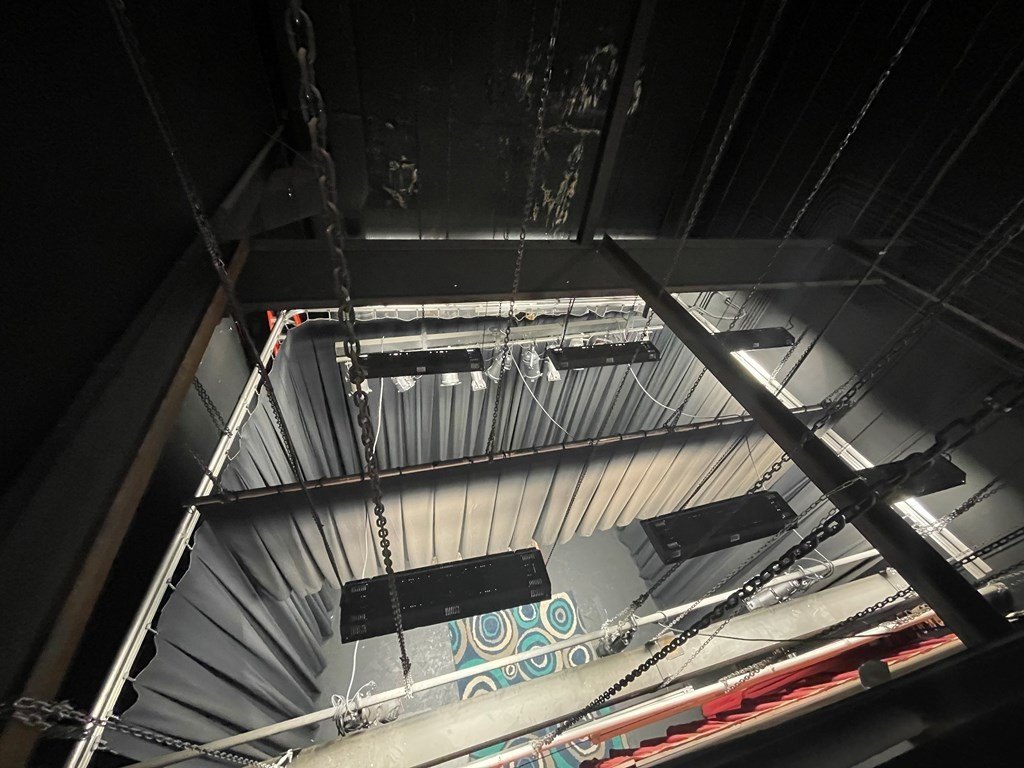
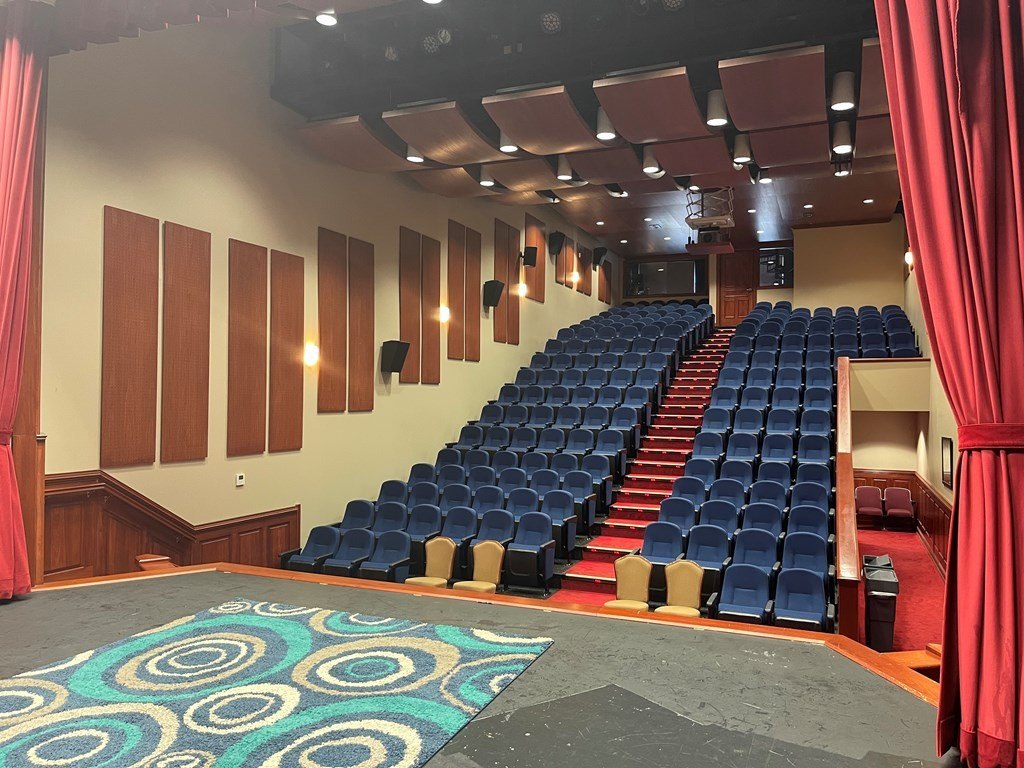
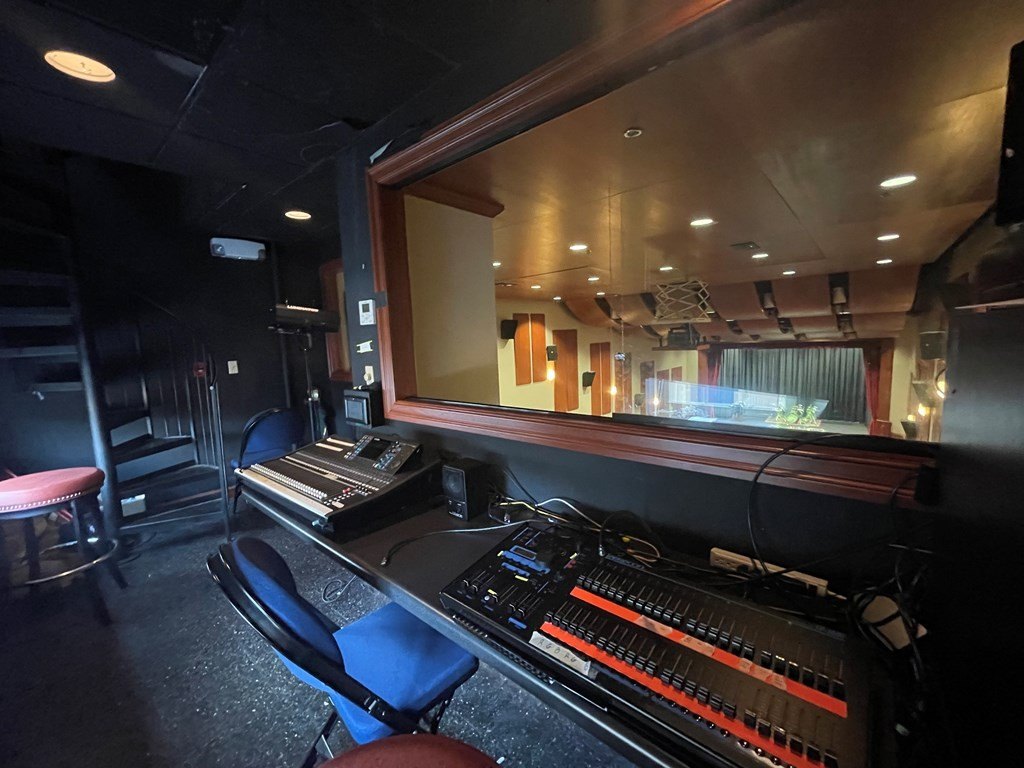
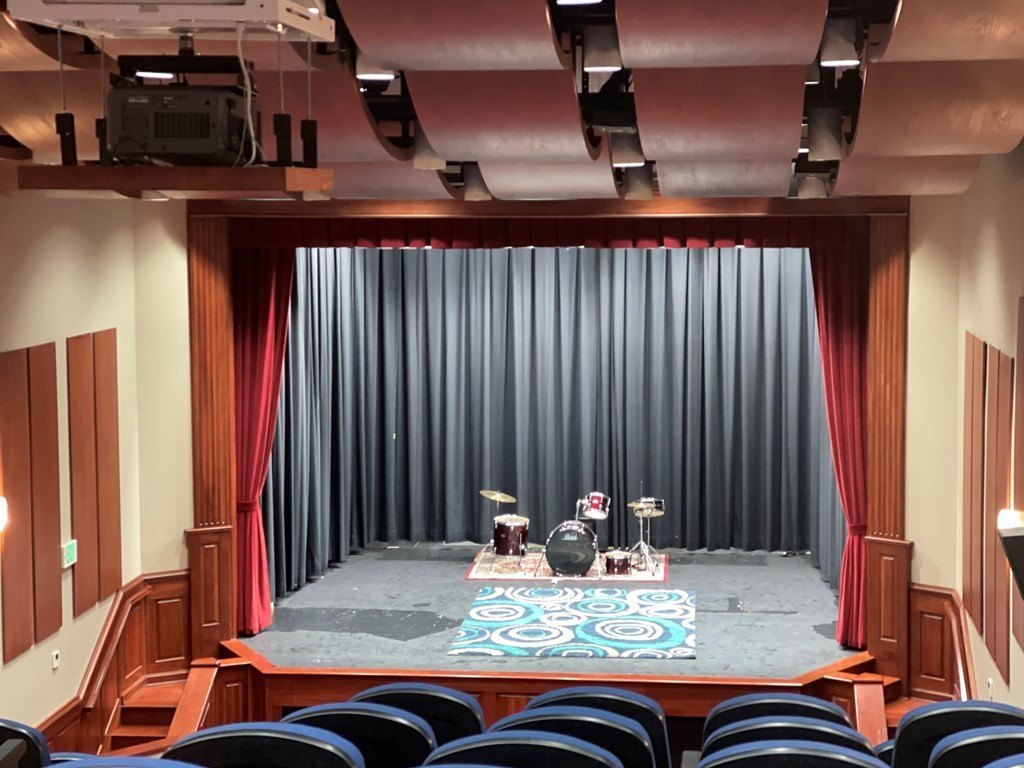
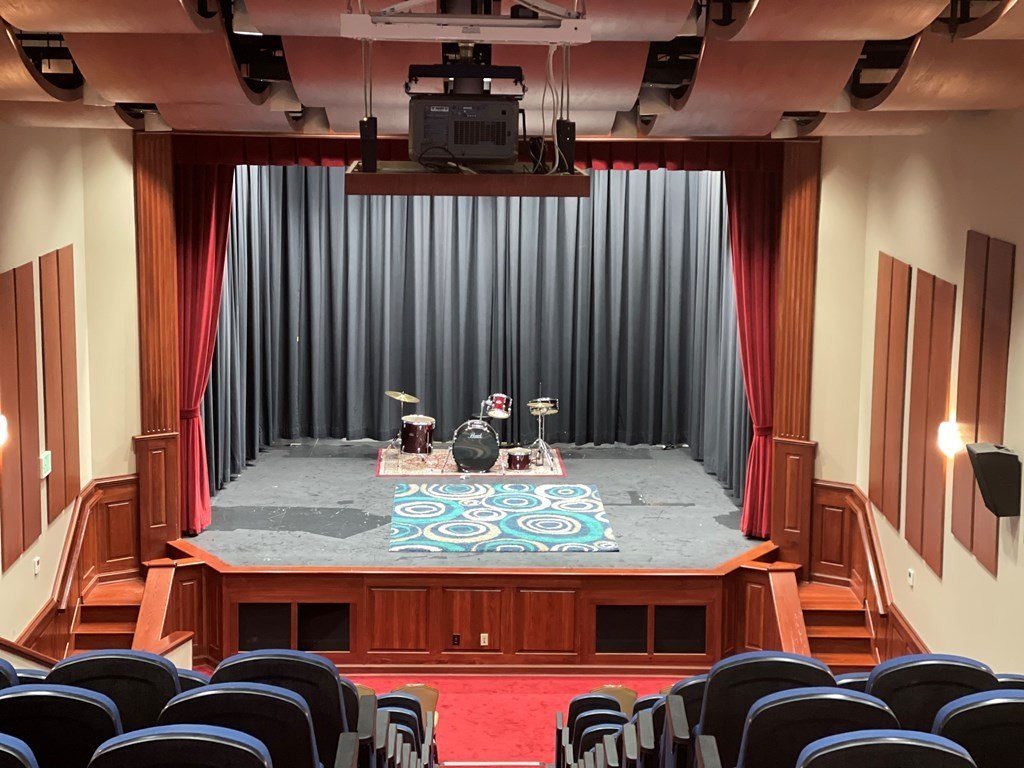
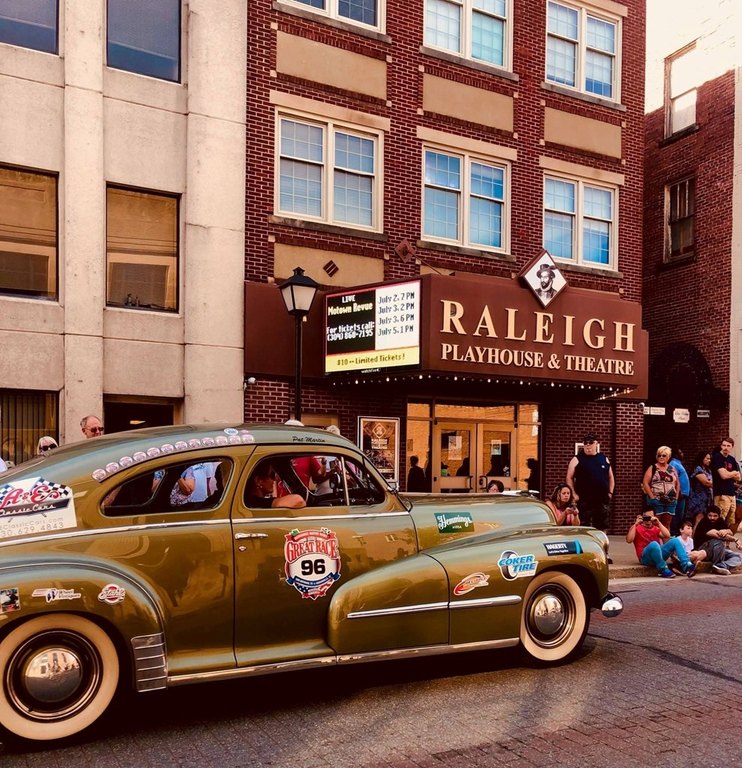
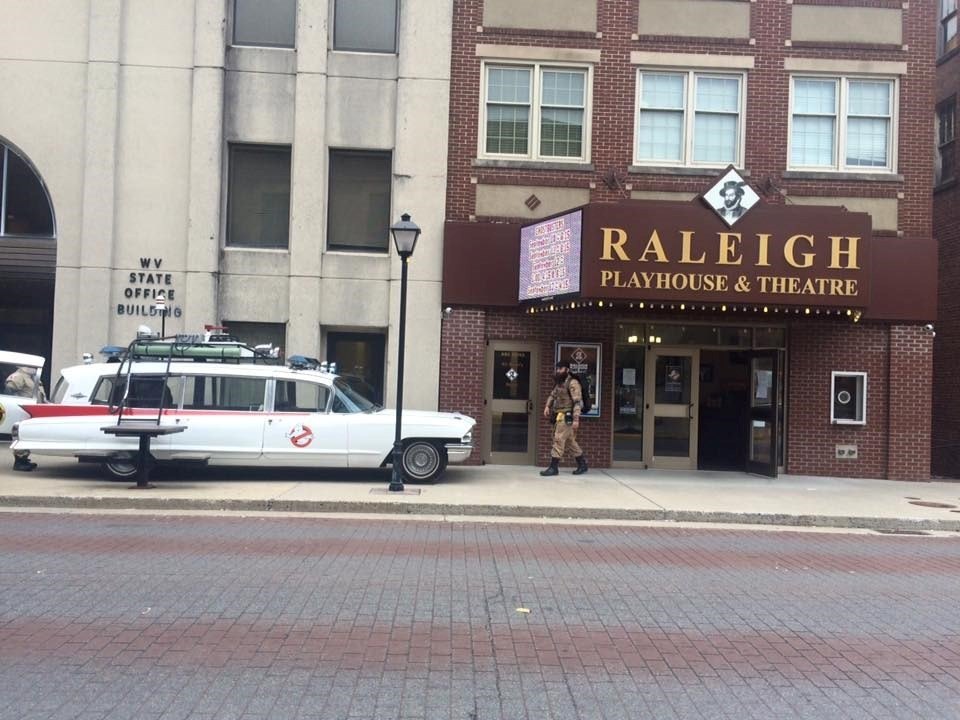
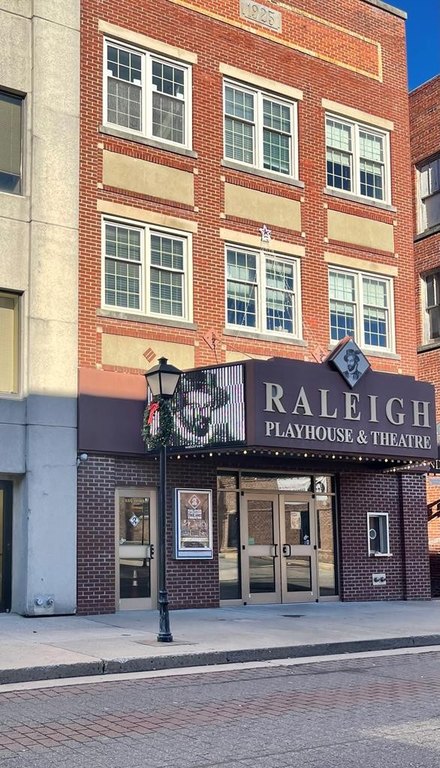
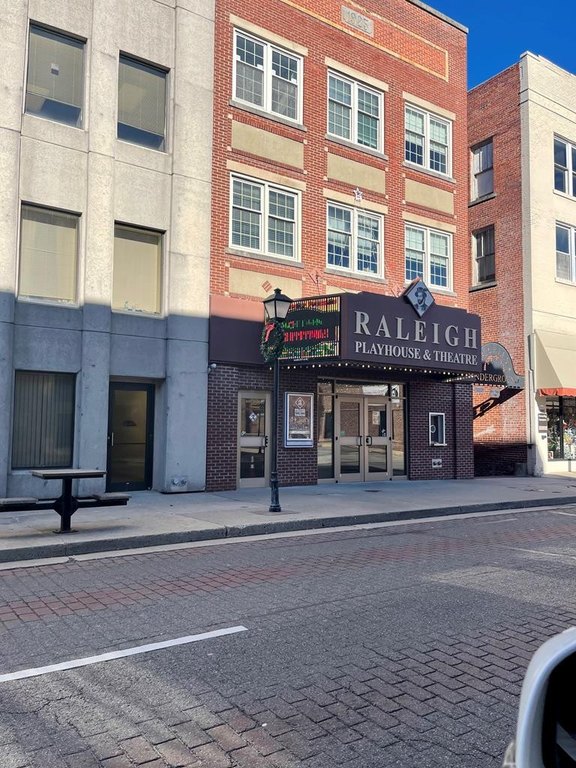
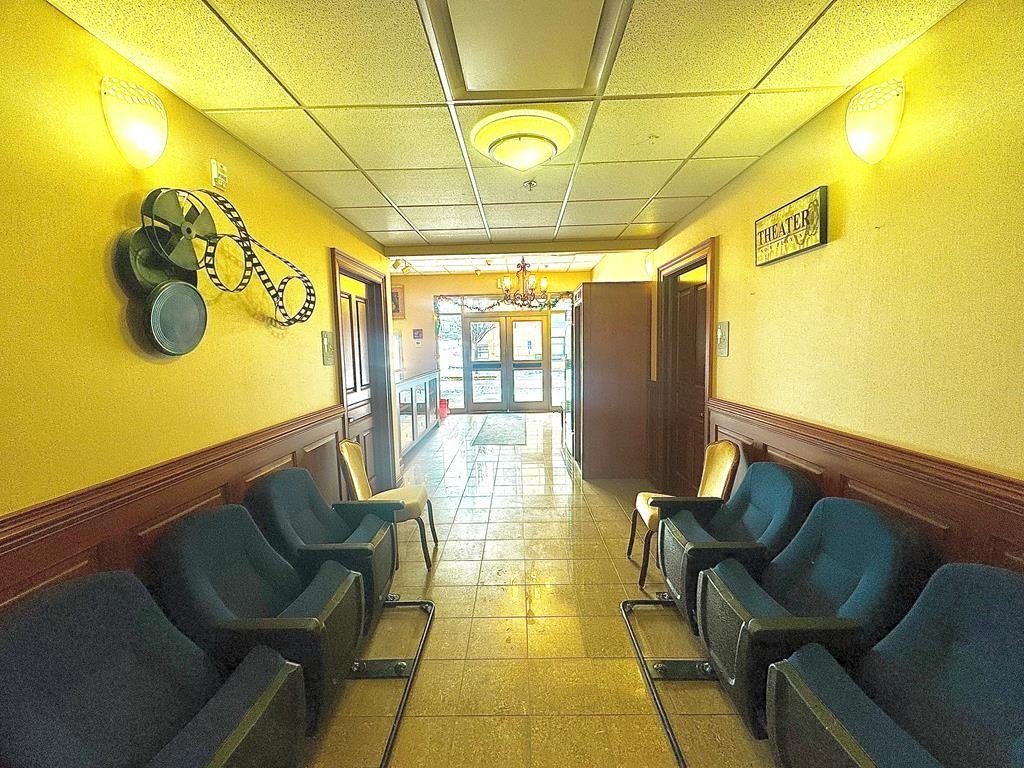
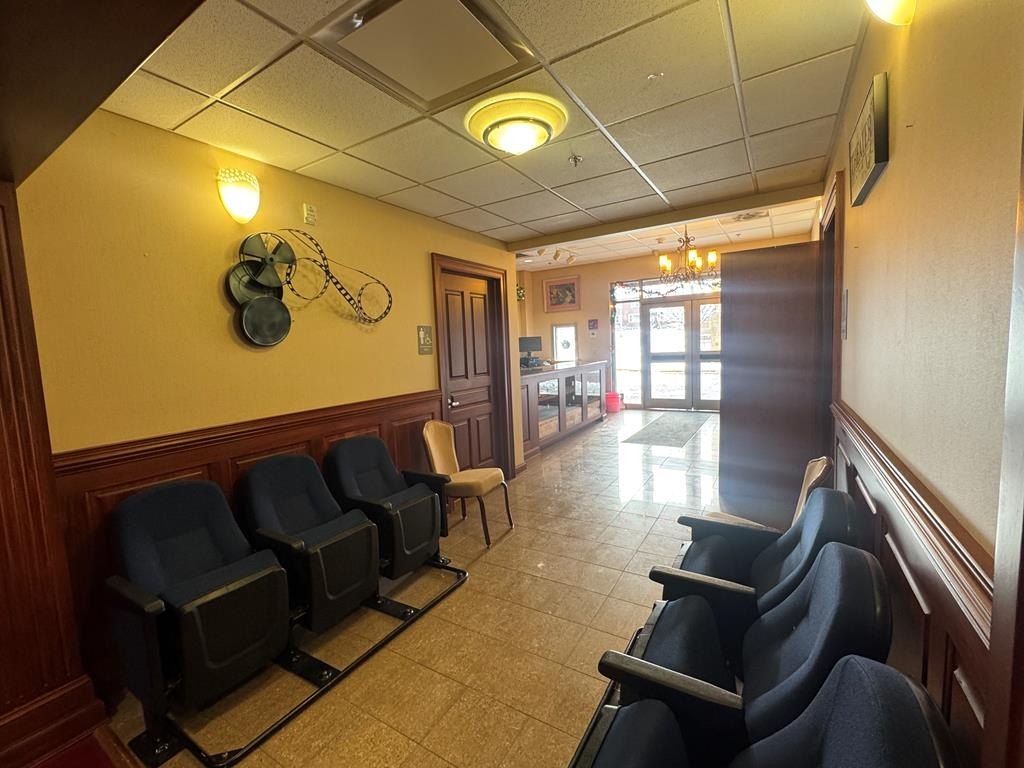
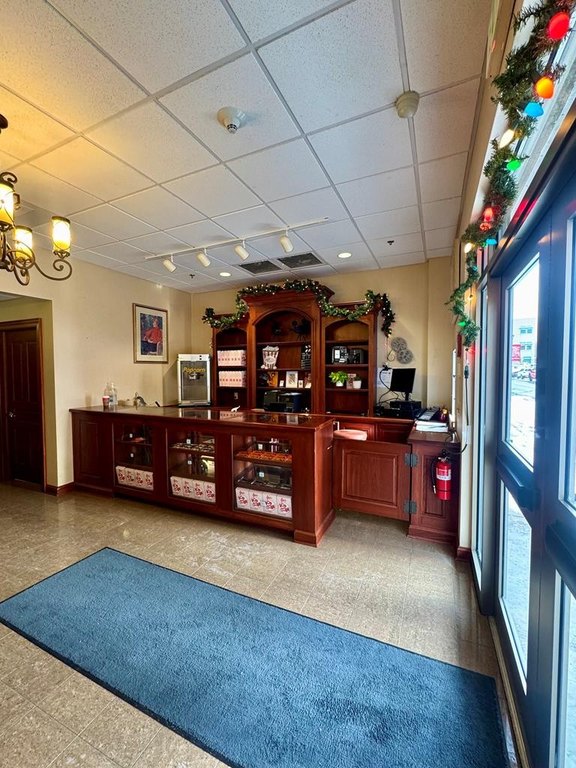
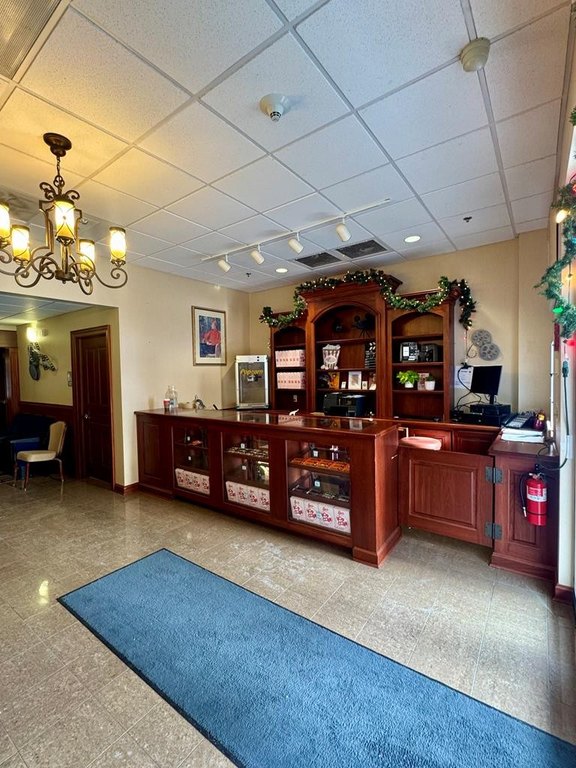
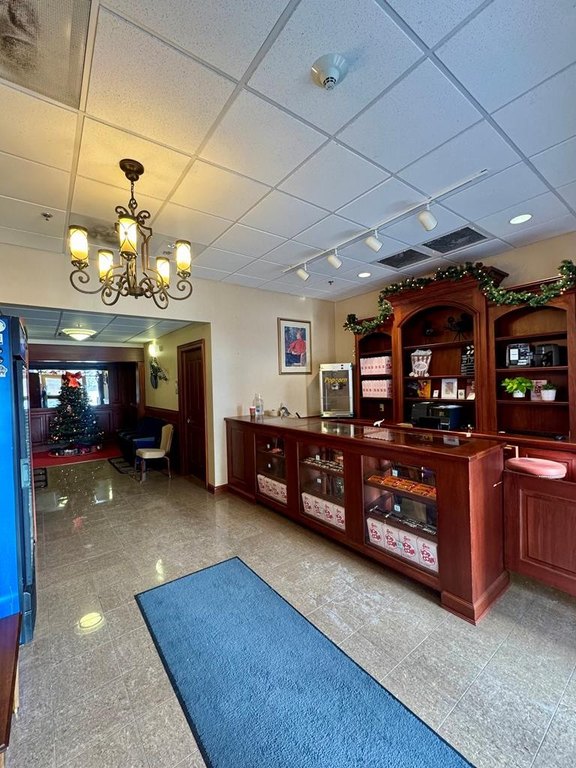
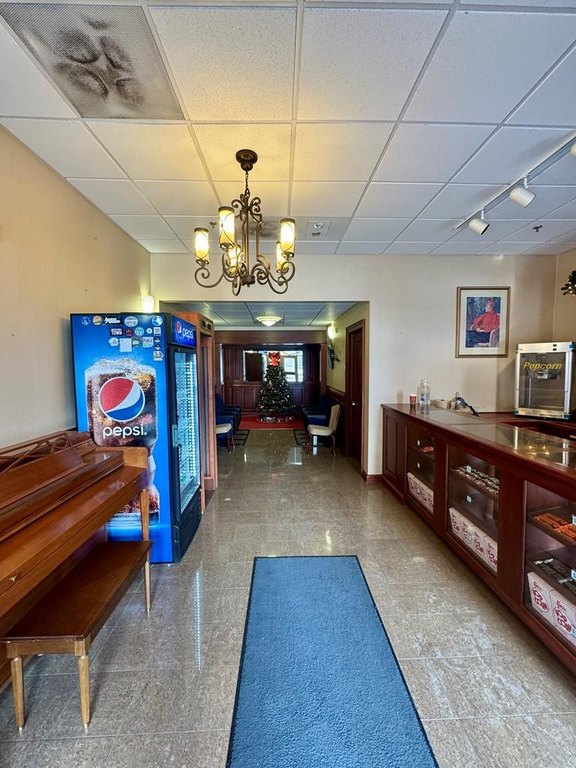
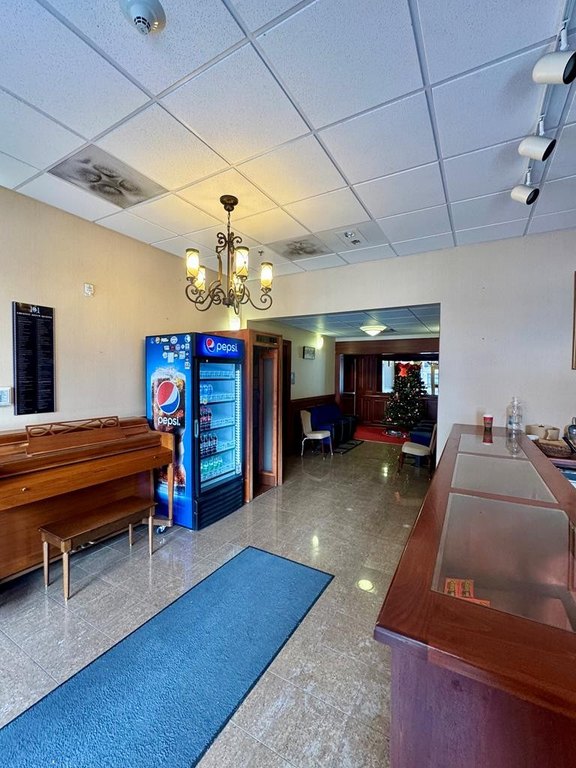
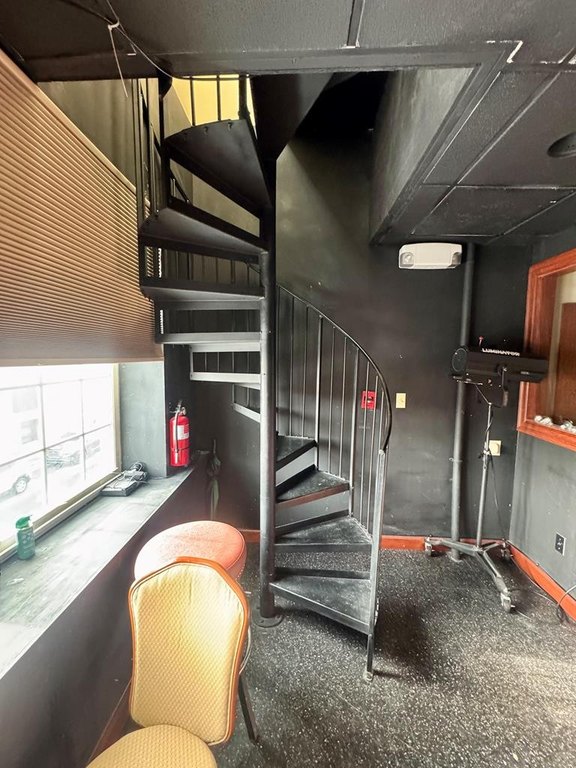
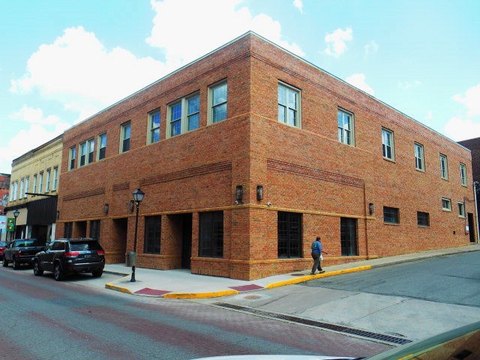
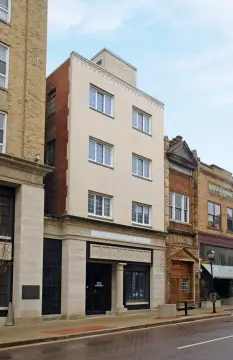
This 8,808-square-foot mixed-use property, built in 1925, has been renovated across three levels. The main floor contains a theater with stadium seating, professional lighting and sound, acoustic treatments, overhead baffles, a stage, lobby, concession counter, and built-in cabinetry. These improvements support screenings, performances, lectures, private events, and community gatherings.
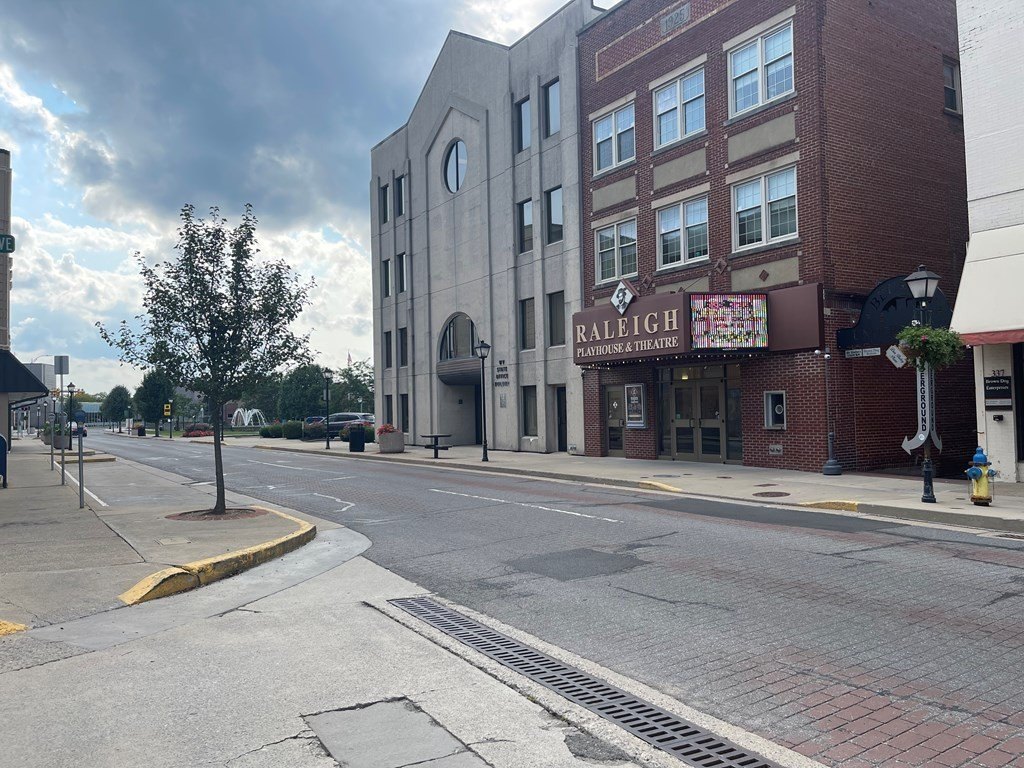
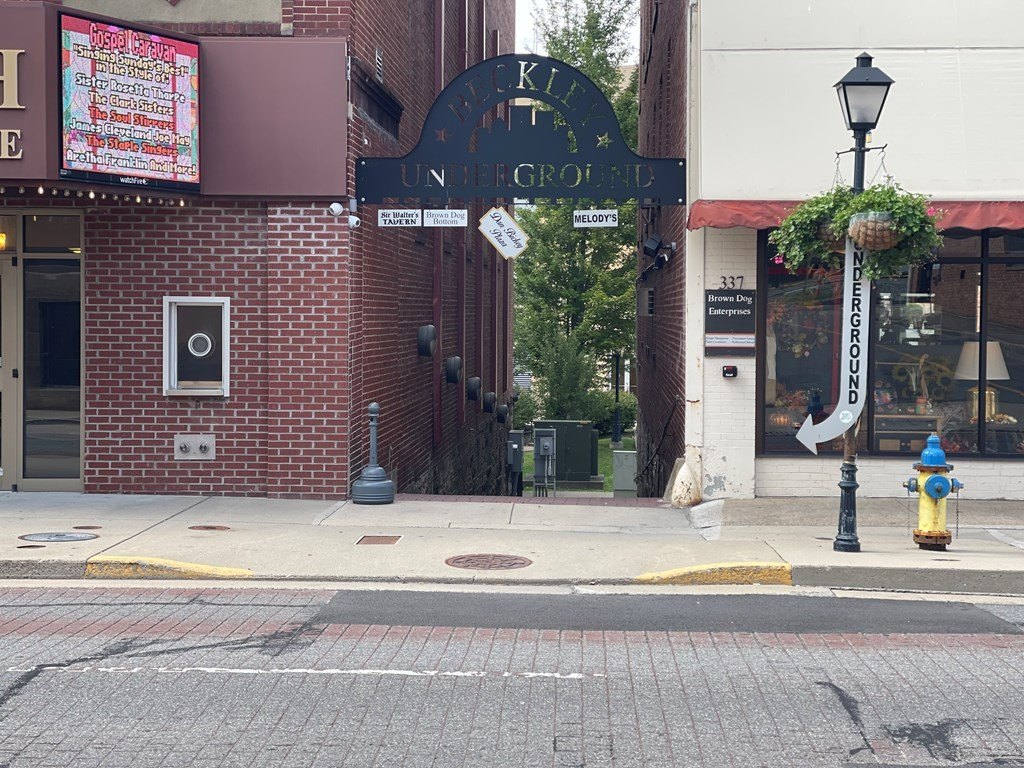
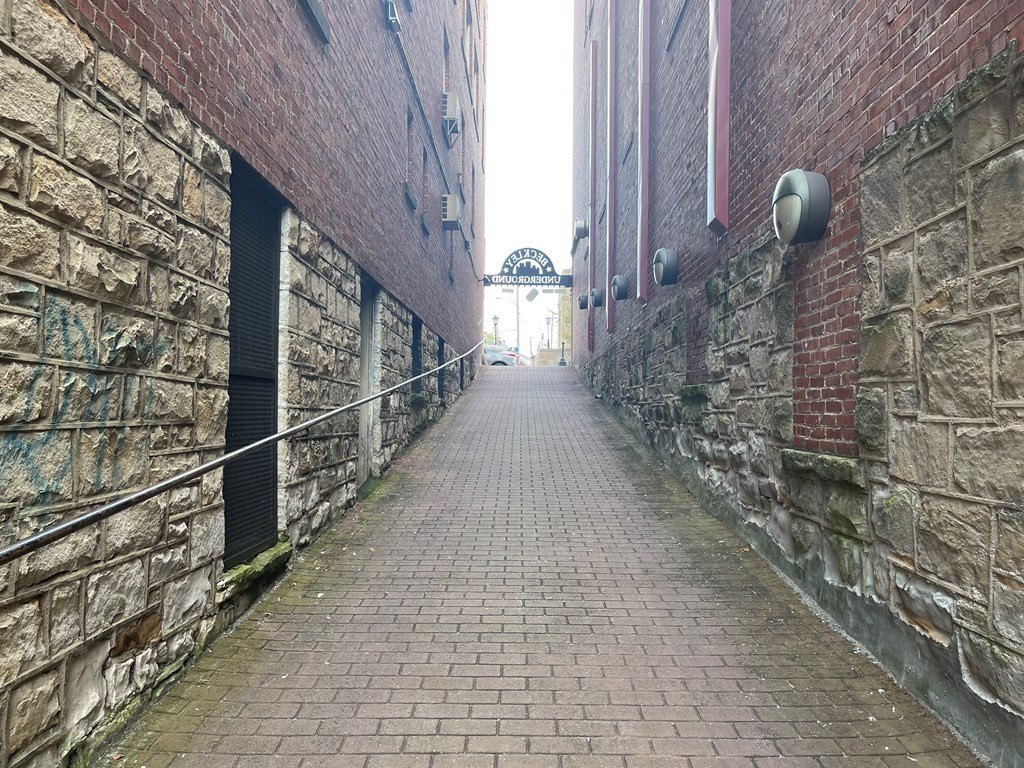
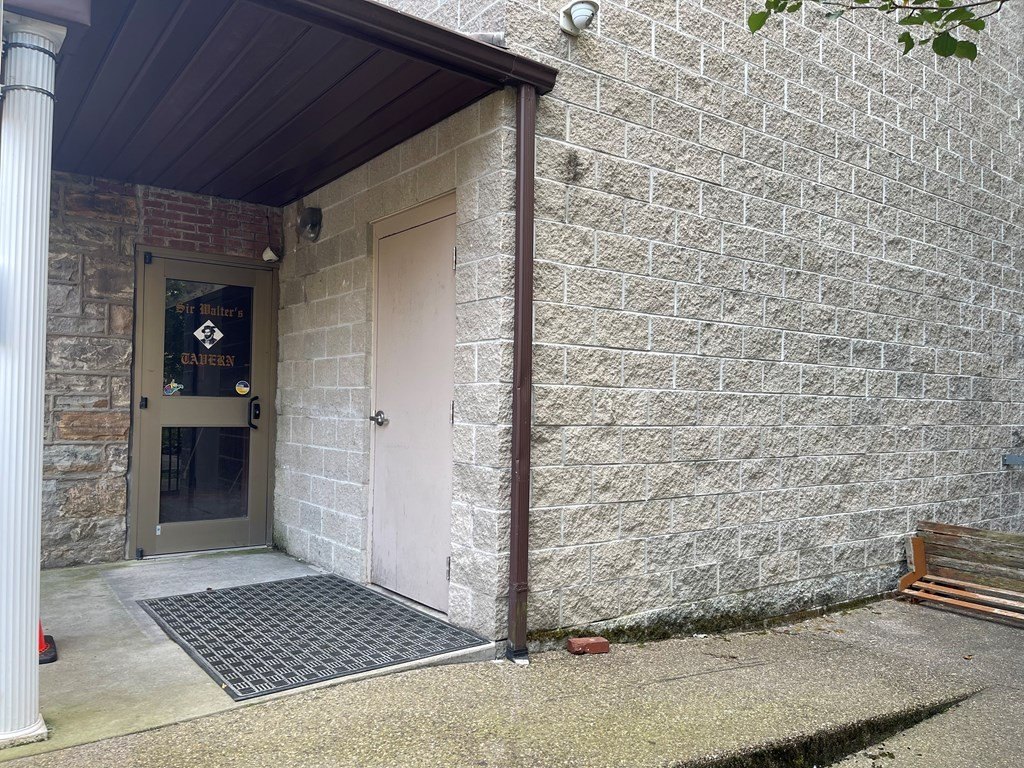
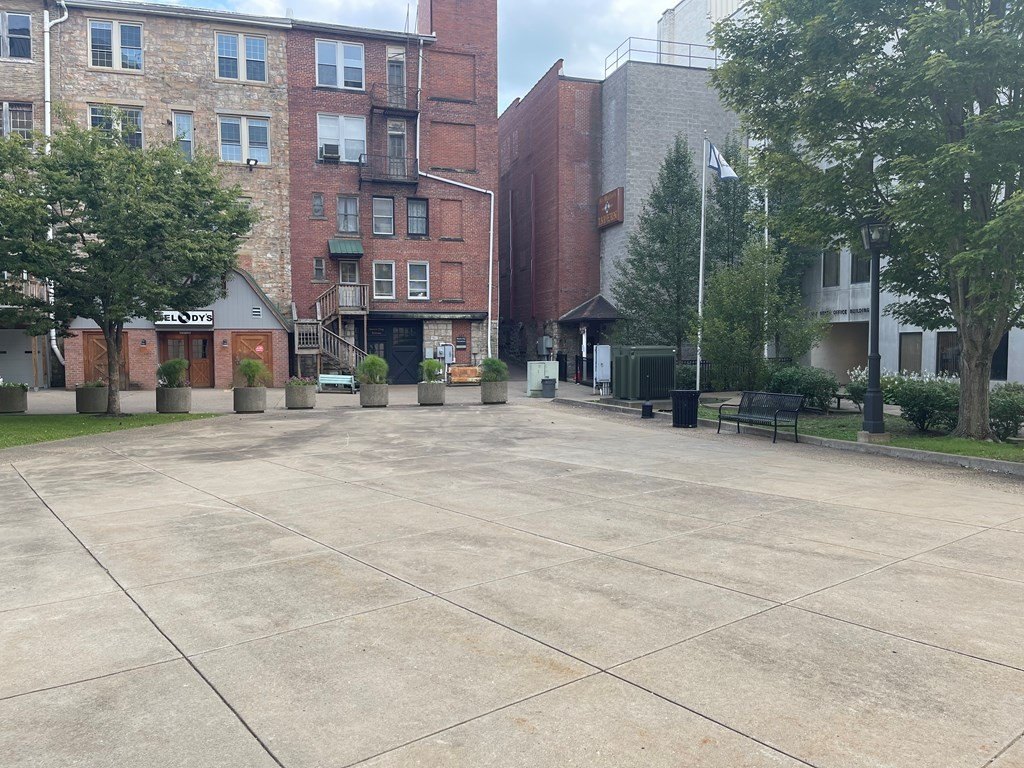
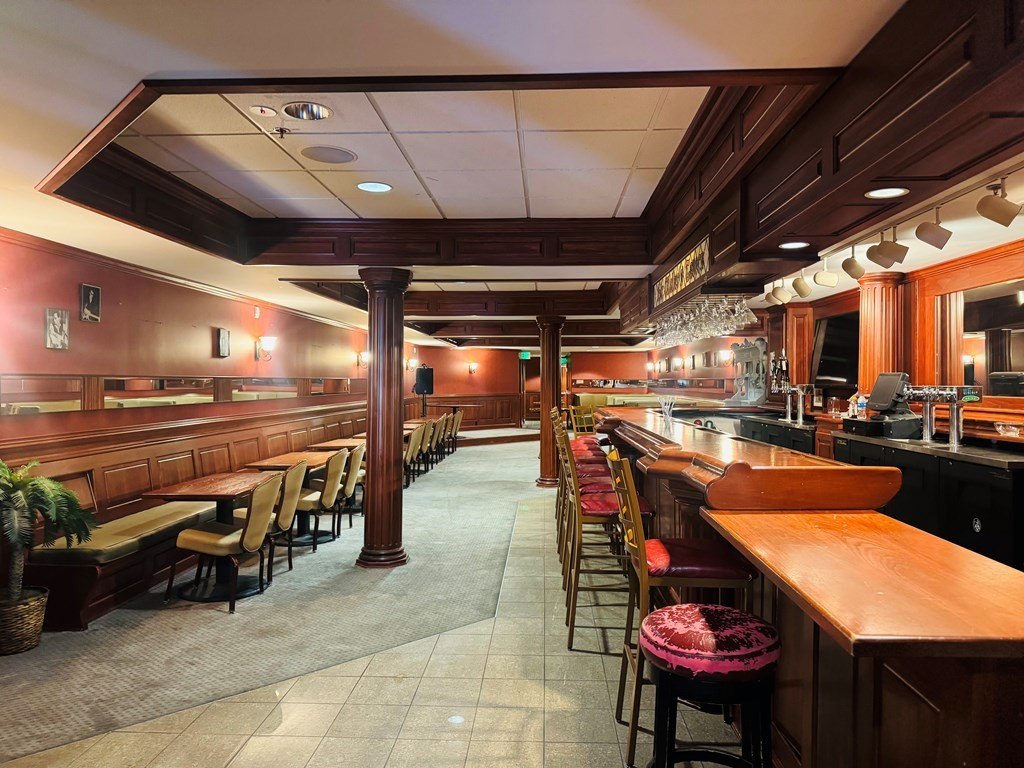
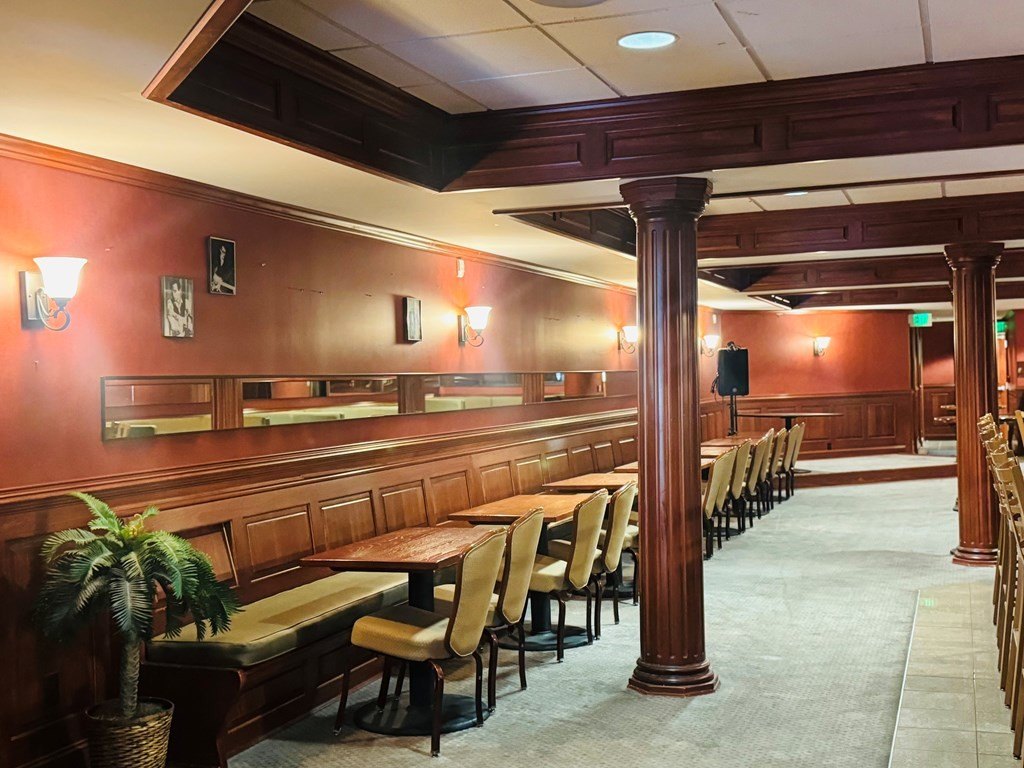
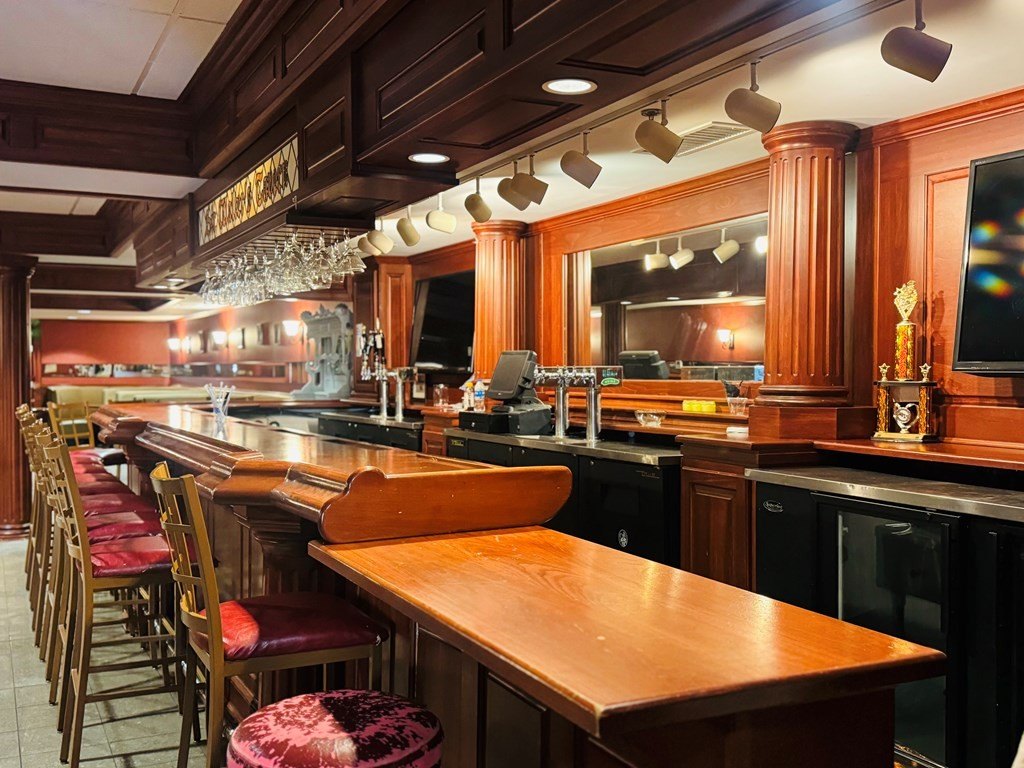
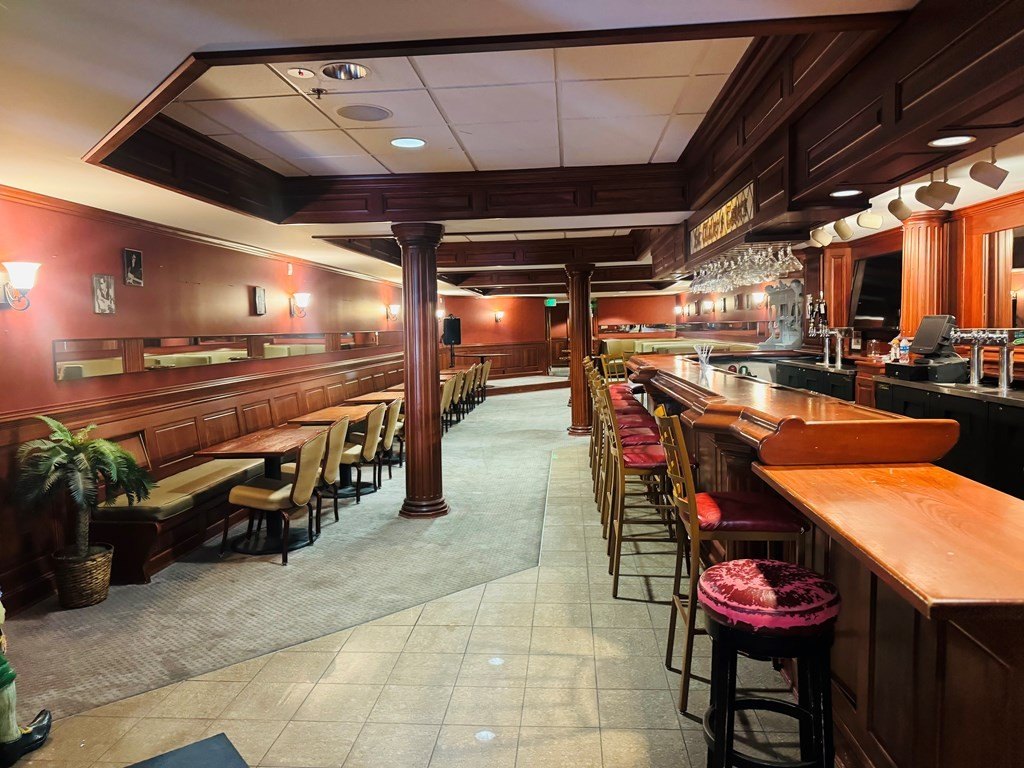
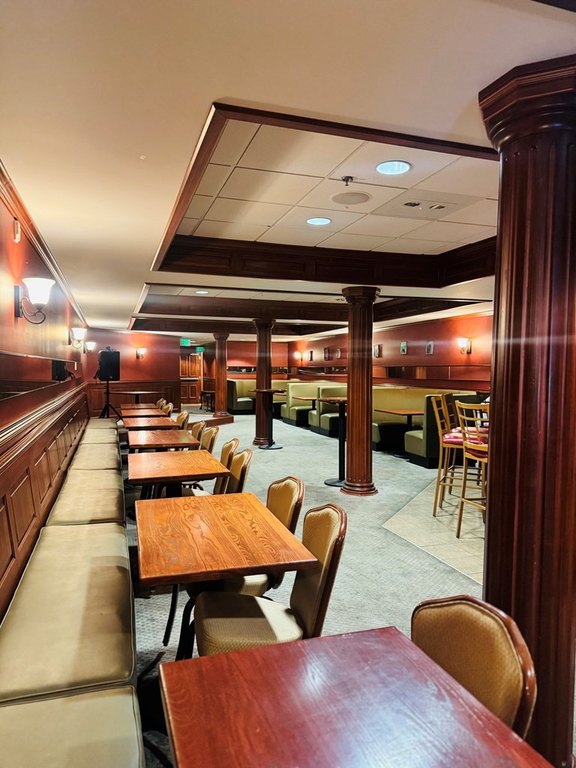
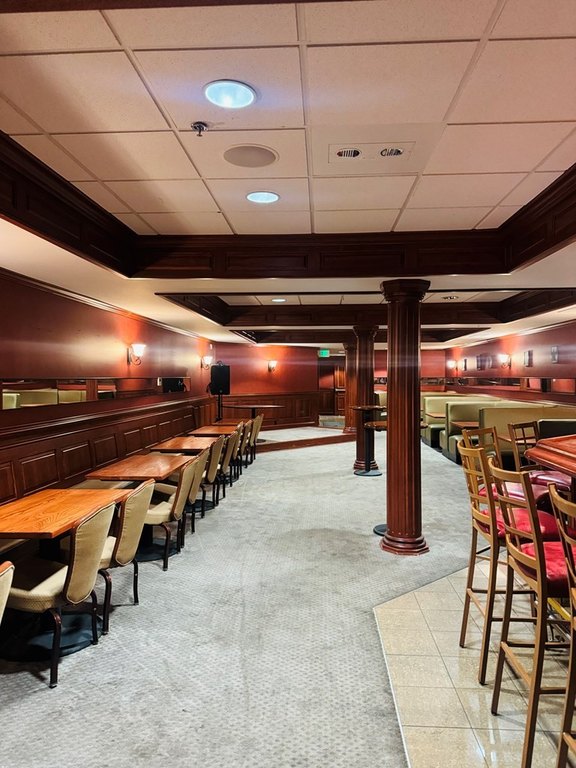
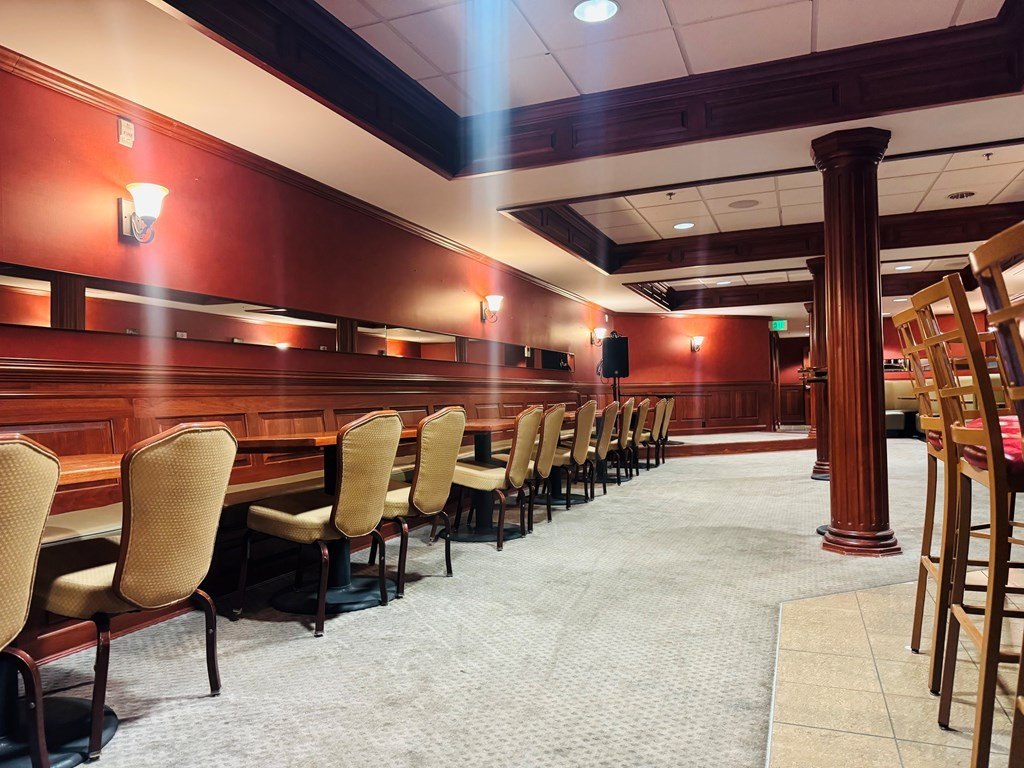
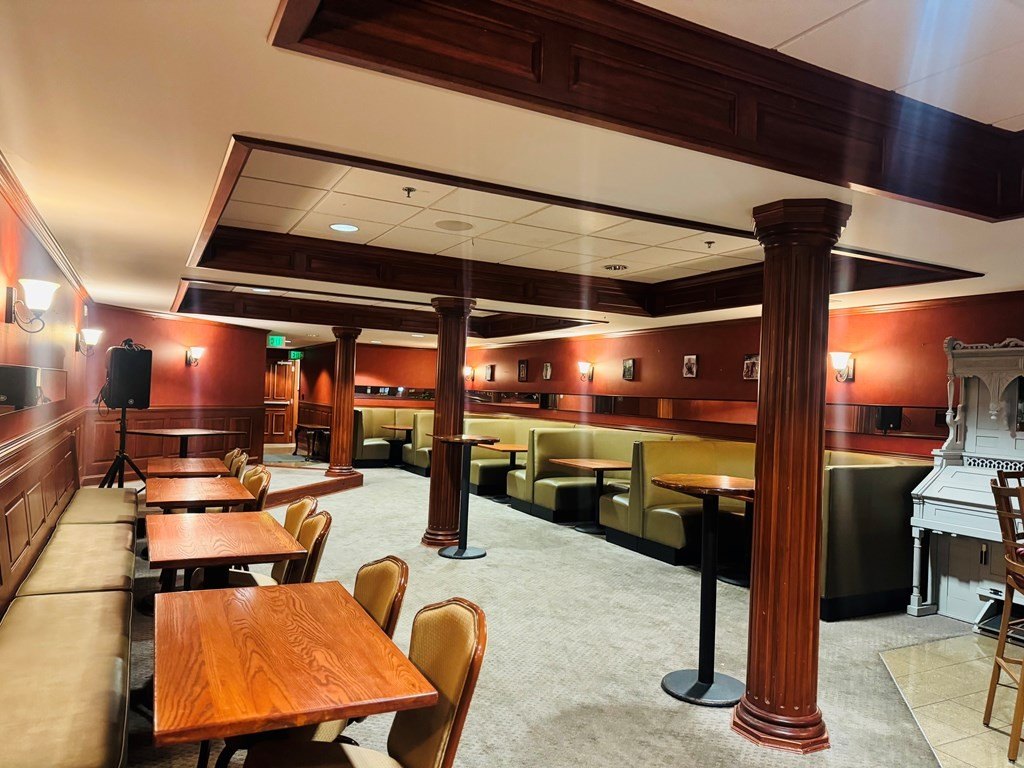
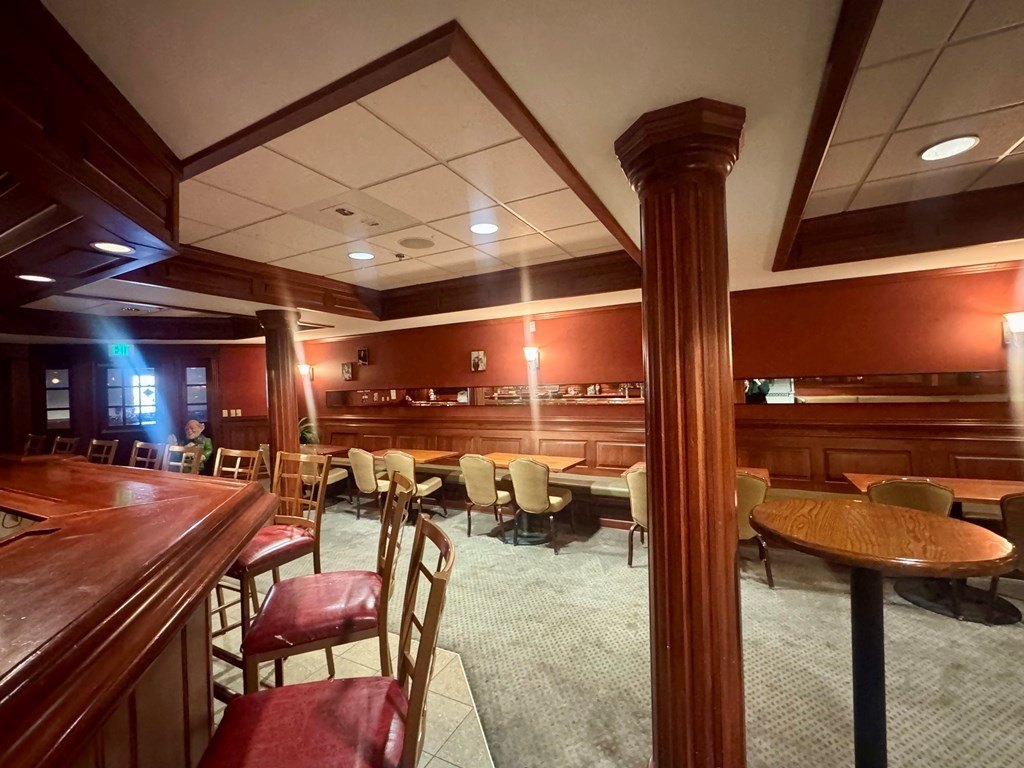
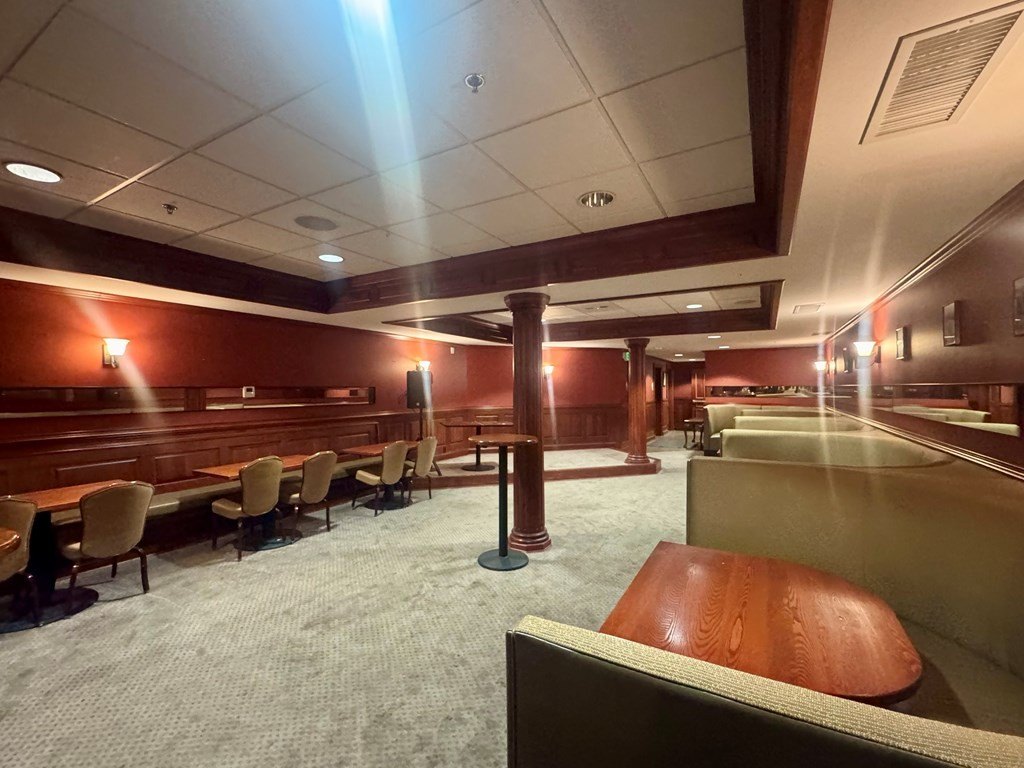
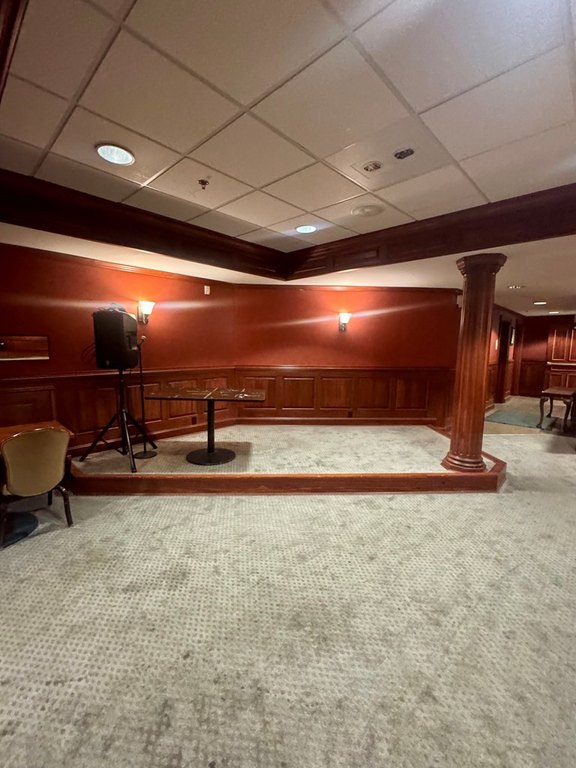
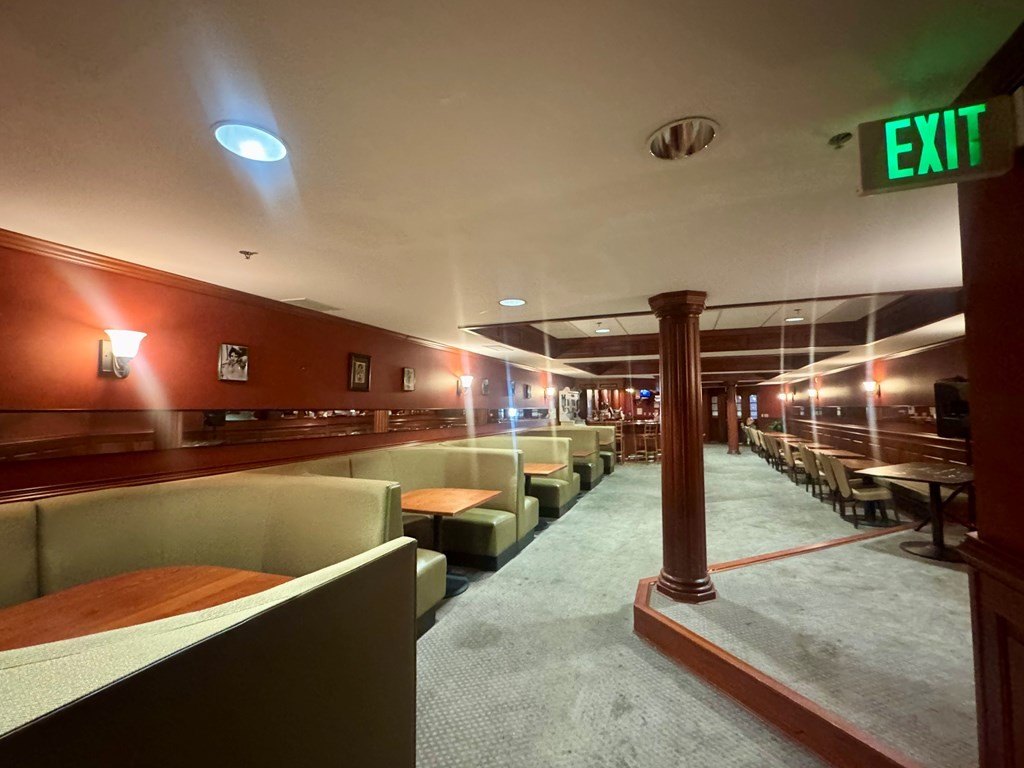
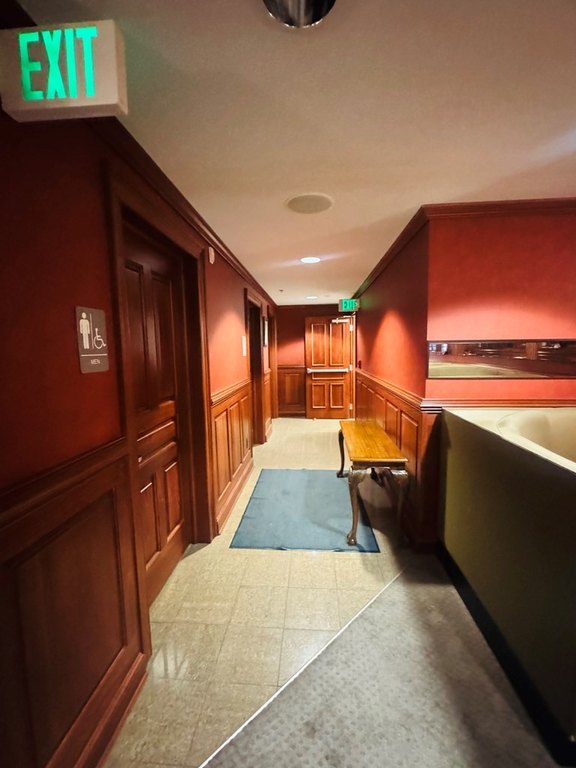
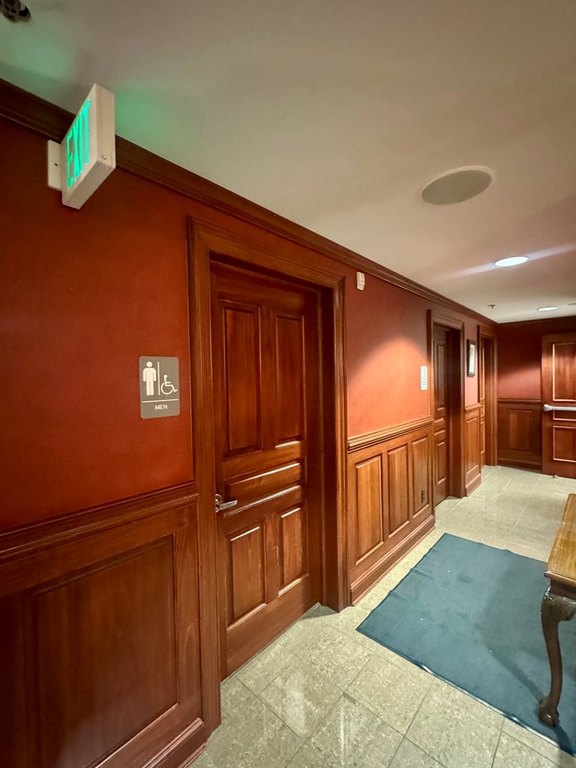
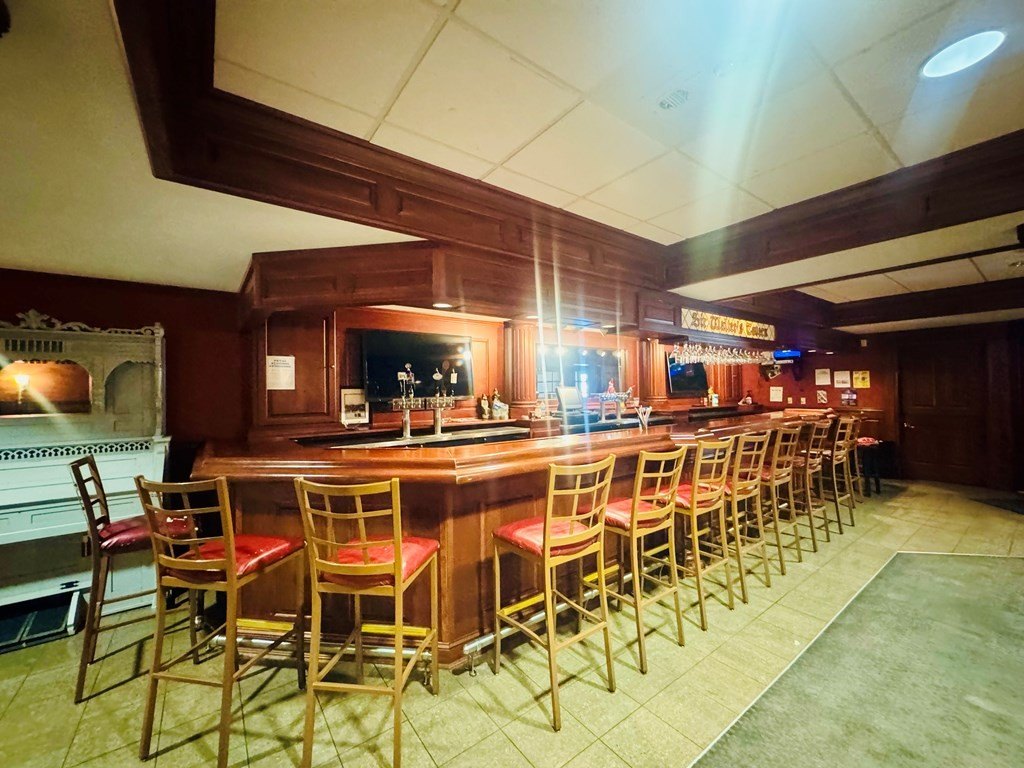
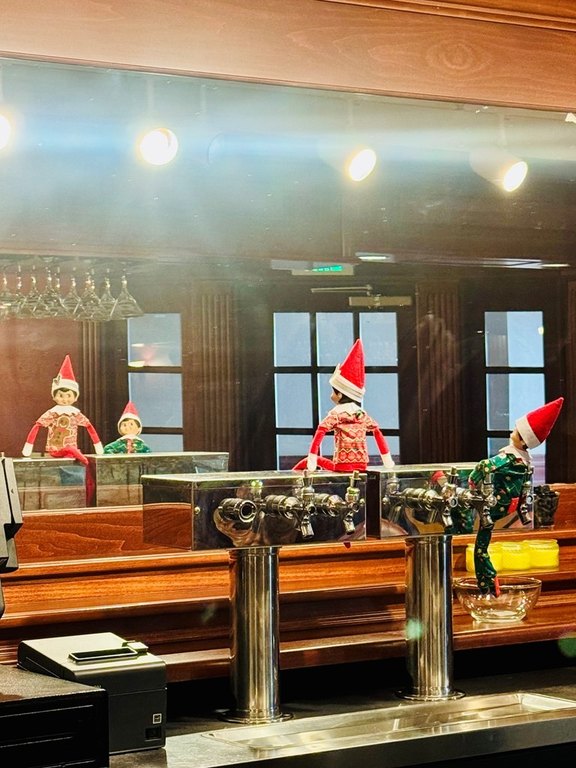
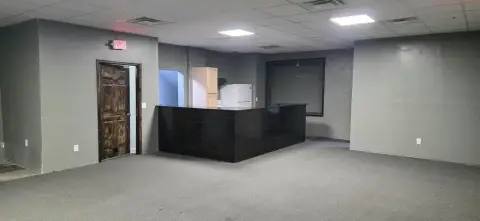
The lower level includes a tavern with a hardwood bar, booth seating, commercial kitchen, and outdoor patio. The upper floor adds office areas, dressing rooms, and restrooms, providing additional space within the existing configuration. A lease with the City of Beckley is in place, and the city pays its own utilities. The property is located at 403 Neville Street in Beckley, West Virginia, near WVU Tech.
The lower level includes a tavern with a hardwood bar, booth seating, commercial kitchen, and outdoor patio. The upper floor adds office areas, dressing rooms, and restrooms, providing additional space within the existing configuration. A lease with the City of Beckley is in place, and the city pays its own utilities. The property is located at 403 Neville Street in Beckley, West Virginia, near WVU Tech.
Key Highlights
- 8,808‑square‑foot mixed‑use property built in 1925
- Theater with stadium seating, professional lighting and sound, acoustic treatments, and a stage
- Lower‑level tavern includes hardwood bar, booth seating, commercial kitchen, and outdoor patio
Financial Insights
Estimated NOI and Cap Rate
NOI / Yr
$95,126
Cap Rate
7.61%
Suggested Prices Based on Cap Rates
Cap Rate 5%
$1,902,520
$1.9M
Cap Rate 7%
$1,358,943
$1.4M
Cap Rate 9%
$1,056,956
$1.1M
Market Conditions
NOI Build-Up for 8,808 SF
Gross rent
$158.5K $18.00/SF
− Vacancy
−$31.7K −$3.60/SF
EGI
$126.8K $14.40/SF
− OpEx
−$31.7K −$3.60/SF
NOI
$95.1K $10.80/SF
Area
Raleigh County, WV
Vacancy
20.00%
Lease Rate
$18.00 /SF/Yr
Expense Ratio
25.00%
Simulate Cap Rate and NOI
Suggested Prices Based on Cap Rates
Cap Rate 5%
$1,902,520
Cap Rate 7%
$1,358,943
Cap Rate 9%
$1,056,956
Alternative Uses
Best Use
Office B
$1.36M
$1.19M – $1.59M
NOI $95,126 @ 7.0% cap · market cap 7.61%
Second Best
Specialty Retail
$1.20M
$1.05M – $1.39M
NOI $83,687 @ 7.0% cap · market cap 6.69%
Theoretical Best
Multifamily LT 5
$5.19M
$4.54M – $6.05M
NOI $363,293 @ 7.0% cap · market cap 29.06%
Zoning and permitted uses should be independently verified with authorities.
Property Analytics
Unlock full access to Insights
Subscribe to Realmo Intelligence
Open Analytics
Current Use
Location Intelligence
Trade Area within ½ mile
991
Businesses Nearby
Explore this area
Business Placement
Demographics for 25801, WV
31,369
Population
15,185
Households
2.1
Avg Household Size
43
Median Age
23%
College-Educated
88%
High-School Grad
99.1 sq mi
ZIP Area
317
Density / Sq Mi
$49,370
Median Household Income
$35,314
Median Earnings
$842
Median Rent
$151,000
Median Home Value
Check the figures for this property
Cap Rate, Value Estimation, Potential NOI and more
View Realmo Analytics
Market
Vacancy Rate% for Office in South region

Questions? Ask Rey
Realmo’s AI knows this listing — price, zoning, demand, history. Ask anything.


Frequently Asked Questions
What type of property is this?
Mixed-use property - Three-level commercial building combines entertainment, hospitality, office, and event-oriented improvements.
Where is this mixed-use property located?
The property is located at 403 NEVILLE STREET Beckley, WV.
What is the asking price?
The asking price for this property is $1,250,000.
What are key features of this property?
This property features: 8,808‑square‑foot mixed‑use property built in 1925; Theater with stadium seating, professional lighting and sound, acoustic treatments, and a stage; Lower‑level tavern includes hardwood bar, booth seating, commercial kitchen, and outdoor patio


