Two-Building Flex Industrial
For Sale
$1,950,000
400 E Industrial Boulevard S, Inola, OK 74036
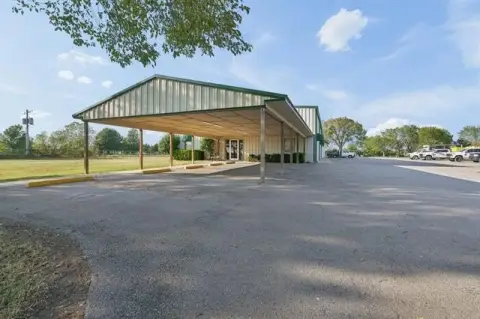
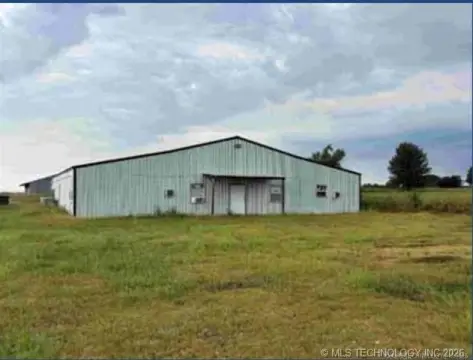
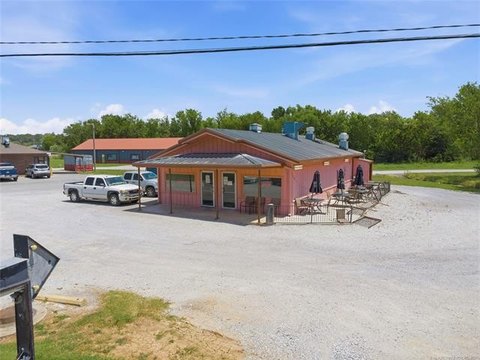
Two red-iron-frame buildings offer office space and flexible industrial layout on a fully fenced site in Inola.
Property Size19,600 SF
Price / SF$99.49
Days on Market146
Property Features for 400 E Industrial Boulevard S
General Information
Standard status
Active
Size
19,600 SF
Zoning
Industrial
Site & Location
Highway Access
Yes
Fenced Yard
Yes
Taxes and HOA fees
Annual Taxes
$43,364
Amenities
Other
Natural Gas, Electric, Other
High Speed Internet, Other
Chain Link
Other, Storage
Building Details
Building Size
19,600 SF
Year Built
1984
Listing Agency:
NAIL Realty Group
Listed By:
Sarah Nail
(918) 284-6245
Source:
Evrealestate
Added: Jun 1
Changed: Oct 15
Last Checked: Oct 23 at 7:27AM
Displayed information is deemed reliable but is not guaranteed and should be independently verified. All listing content including descriptions, pricing, images are the copyrighted material of NAIL Realty Group

Ask AI about this property
Review the available facts, identify missing information and prepare questions for the agent.
Investment Insights
Based on property information with market context.
This offering includes two separate buildings on more than 5 acres, each constructed with red iron frames. Building #1 features more than 12 offices, providing dedicated interior space for administrative functions or tenant use. Building #2 is currently occupied on a month-to-month lease. Both buildings have separate utilities, supporting independent operations. The property is connected to city sewer, and the site is fully fenced.
The buildings are located within the Jim Summerlin Industrial Park area in Inola, with proximity to Highway 88 and Highway 412. The remarks also note that port and railroad access are available nearby, which may be useful for logistics-focused users.
For tenants, buyers, or operators, the combination of office-intensive space in Building #1 and an independently metered, separately operating second building can fit a range of business models. The property’s fenced configuration and separate utilities may simplify day-to-day management, while the presence of a month-to-month tenant in Building #2 provides an additional consideration for buyers seeking an occupied component.
The buildings are located within the Jim Summerlin Industrial Park area in Inola, with proximity to Highway 88 and Highway 412. The remarks also note that port and railroad access are available nearby, which may be useful for logistics-focused users.
For tenants, buyers, or operators, the combination of office-intensive space in Building #1 and an independently metered, separately operating second building can fit a range of business models. The property’s fenced configuration and separate utilities may simplify day-to-day management, while the presence of a month-to-month tenant in Building #2 provides an additional consideration for buyers seeking an occupied component.
Key Highlights
- Two buildings in the Jim Summerlin Industrial Park in Inola, built in 1984
- Both buildings feature red iron frame construction
- Building #1 offers over 12 offices
Financial Insights
Estimated NOI and Cap Rate
NOI / Yr
$133,647
Cap Rate
6.85%
Suggested Prices Based on Cap Rates
Cap Rate 5%
$2,672,940
$2.7M
Cap Rate 7%
$1,909,243
$1.9M
Cap Rate 9%
$1,484,967
$1.5M
Market Conditions
NOI Build-Up for 19,600 SF
Gross rent
$164.6K $8.40/SF
− Vacancy
−$7.4K −$0.38/SF
EGI
$157.2K $8.02/SF
− OpEx
−$23.6K −$1.20/SF
NOI
$133.6K $6.82/SF
Area
Rogers County, OK
Vacancy
4.50%
Lease Rate
$8.40 /SF/Yr
Expense Ratio
15.00%
Simulate Cap Rate and NOI
Suggested Prices Based on Cap Rates
Cap Rate 5%
$2,672,940
Cap Rate 7%
$1,909,243
Cap Rate 9%
$1,484,967
Alternative Uses
Best Use
Office B
$3.69M
$3.23M – $4.31M
NOI $258,491 @ 7.0% cap · market cap 13.26%
Second Best
Warehouse
$1.91M
$1.67M – $2.23M
NOI $133,647 @ 7.0% cap · market cap 6.85%
Theoretical Best
Specialty Retail
$4.91M
$4.30M – $5.73M
NOI $343,627 @ 7.0% cap · market cap 17.62%
Zoning and permitted uses should be independently verified with authorities.
How Realmo checks its estimates
Property Analytics
Contact the owner directly
Get the owner's phone numbers and email
Open Analytics
Current Use
Lease Details
Yes
Fenced yard
Yes
Highway access
Location Intelligence
Trade Area within ½ mile
101
Businesses Nearby
Well-served
Demand for This Use
Explore this area
Business Placement
Demographics for 74036, OK
7,182
Population
2,858
Households
2.5
Avg Household Size
41
Median Age
19%
College-Educated
86%
High-School Grad
128.4 sq mi
ZIP Area
56
Density / Sq Mi
$78,187
Median Household Income
$43,585
Median Earnings
$938
Median Rent
$200,000
Median Home Value
Check the figures for this property
Cap Rate, Value Estimation, Potential NOI and more
View Realmo Analytics
Market
Vacancy Rate% for Office in South region


Frequently Asked Questions
What type of property is this?
Flex space - Two red-iron-frame buildings offer office space and flexible industrial layout on a fully fenced site in Inola.
Where is this flex space located?
The property is located at 400 E Industrial Boulevard S Inola, OK.
What is the asking price?
The asking price for this property is $1,950,000.
What are key features of this property?
This property features: Two buildings in the Jim Summerlin Industrial Park in Inola, built in 1984; Both buildings feature red iron frame construction; Building #1 offers over 12 offices


