Renovated Restaurant Near University of
For Sale
Contact for pricing
3915 University Blvd, Tyler, TX 75707
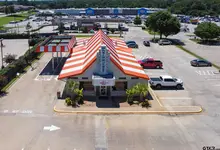
Recently renovated restaurant near UT Tyler with drive-thru.
Property Size3,275 SF
Price / SF$381.68
Days on Market214
Property Features for 3915 University Blvd
General Information
Standard status
Active
Size
3,275 SF
Property subtype
Retail
Zoning
Commercial (C-1)
Investment Type
Owner/User
Building Details
Year Built
2014
Year Renovated
2024
Buildings
1
Stories
1
Units
1
Tenancy
Single
Listing Agency:
Trade Properties
Listed By:
Chris Adams · License #619855
Source:
Crexi
Added: Mar 14
Changed: Oct 11
Last Checked: Oct 12 at 6:59PM
Displayed information is deemed reliable but is not guaranteed and should be independently verified. All listing content including descriptions, pricing, images are the copyrighted material of Trade Properties
Investment Insights
Based on property information with market context.
The property at 3915 W. University Blvd, Tyler, TX 75071 is a renovated restaurant in Tyler, the largest city in East Texas, which serves as an economic and medical hub. Originally constructed in 2014 and renovated in 2025, the property has highway visibility and is located directly across University Boulevard from the University of Texas at Tyler, which has an enrollment of 10,000 students, including the recently established School of Medicine. Fall 2025 enrollment set a record for UT Tyler with 11,600 students. Enrollment is expected to exceed 13,000 students by 2027 leading to large planned projects for the subject property intersection, including a pedestrian bridge and traffic signal that will soon connect the primary entrance to UT Tyler with the subject property and surrounding commercial properties. This will also help accommodate planned student housing projects to help facilitate the increased enrollment. The recently renovated restaurant features a relatively large interior and can support a variety of kitchen and dining arrangements. The property is a 3,275 square foot drive-thru restaurant. Expect traffic and demand for retail, student housing, and dining options to increase significantly in upcoming years. This is an opportunity for an owner/user or investor to acquire a drive-thru restaurant situated at the main entrance to a growing university with planned surrounding development poised to bring additional vehicle and foot traffic to the Property and surrounding retail in the near future.
Key Highlights
- Newly renovated restaurant (renovated in 2025) at the main entrance to the University of Texas at Tyler.
- High visibility location directly across from UT Tyler**, with record enrollment of 11,600 students (Fall 2025) expected to exceed 13,000 by 2027.
- Planned infrastructure improvements including a pedestrian bridge and traffic signal connecting the property to the university.
Financial Insights
Estimated NOI and Cap Rate
NOI / Yr
$40,882
Cap Rate
3.27%
Suggested Prices Based on Cap Rates
Cap Rate 5%
$817,640
$817.6K
Cap Rate 7%
$584,029
$584.0K
Cap Rate 9%
$454,244
$454.2K
Market Conditions
NOI Build-Up for 3,275 SF
Gross rent
$57.4K $17.52/SF
− Vacancy
−$2.9K −$0.88/SF
EGI
$54.5K $16.64/SF
− OpEx
−$13.6K −$4.16/SF
NOI
$40.9K $12.48/SF
Area
Tyler, TX
Vacancy
5.00%
Lease Rate
$17.52 /SF/Yr
Expense Ratio
25.00%
Simulate Cap Rate and NOI
Suggested Prices Based on Cap Rates
Cap Rate 5%
$817,640
Cap Rate 7%
$584,029
Cap Rate 9%
$454,244
Alternative Uses
Best Use
Specialty Retail
$584.0K
$511.0K – $681.4K
NOI $40,882 @ 7.0% cap · market cap 3.27%
Second Best
—
—
no second resolved use
Theoretical Best
Office A
$731.0K
$639.6K – $852.8K
NOI $51,168 @ 7.0% cap · market cap 4.09%
Zoning and permitted uses should be independently verified with authorities.
How Realmo checks its estimates
Property Analytics
Unlock full access to Insights
Subscribe to Realmo Intelligence
Open Analytics
Current Use
Location Intelligence
Trade Area within ½ mile
207
Businesses Nearby
7k
Monthly Visits Nearby
Explore this area
Business Placement
Foot Traffic Nearby
Shops & Services 53%
Dining 47%
CEFCO
Shops & Services
3,928 visits/mo
0.1 miles
Insomnia Cookies
Dining
2,277 visits/mo
0.3 miles
Pizza Hut
Dining
1,212 visits/mo
0.4 miles
Demographics for 75707, TX
16,620
Population
6,858
Households
2.4
Avg Household Size
42
Median Age
34%
College-Educated
92%
High-School Grad
52.4 sq mi
ZIP Area
317
Density / Sq Mi
$85,406
Median Household Income
$44,425
Median Earnings
$1,415
Median Rent
$256,300
Median Home Value
Check the figures for this property
Cap Rate, Value Estimation, Potential NOI and more
View Realmo Analytics
Market
Vacancy Rate% for Retail in South region

Questions? Ask Rey
Realmo’s AI knows this listing — price, zoning, demand, history. Ask anything.





Frequently Asked Questions
What type of property is this?
Drive through restaurant - Recently renovated restaurant near UT Tyler with drive-thru.
Where is this drive through restaurant located?
The property is located at 3915 University Blvd Tyler, TX.
What is the asking price?
The asking price for this property is $1,250,000.
What are key features of this property?
This property features: Newly renovated restaurant (renovated in 2025) at the main entrance to the University of Texas at Tyler.; High visibility location directly across from UT Tyler**, with record enrollment of 11,600 students (Fall 2025) expected to exceed 13,000 by 2027.; Planned infrastructure improvements including a pedestrian bridge and traffic signal connecting the property to the university.


