Historic Mixed-Use Building with
For Sale
$699,000
383 Park Avenue, Rochester, NY 14607
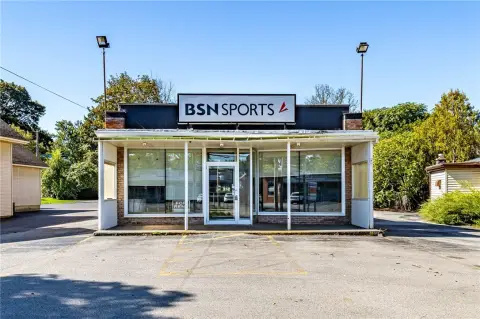
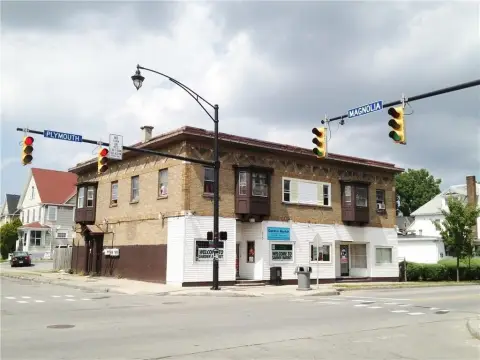
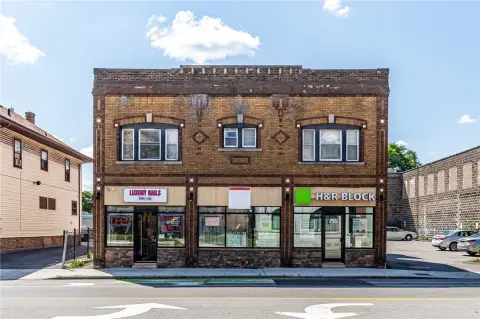
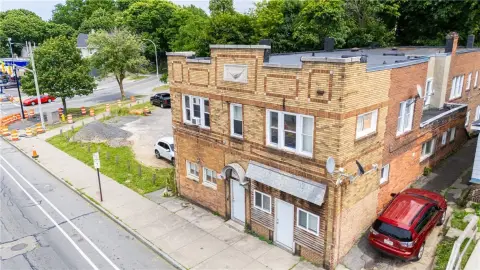
C-1-zoned property combines updated interiors with flexible two-level commercial space.
Property Size3,312 SF
Price / SF$211.05
Days on Market97
Property Features for 383 Park Avenue
General Information
Standard status
Active
Size
3,312 SF
Total Parking Spaces
9
Zoning
C-1
Amenities
brand-new furnace
newer AC units
updated mechanics
custom tile and hardwood flooring
updated bathrooms
updated kitchen
custom glass-enclosed first-floor office
separate conference room space with wet bar
Building Details
Year Renovated
2006
Buildings
1
Stories
2
Building Size
3,312 SF
Listing Agency:
Keller Williams Realty Greater Rochester
(585) 758-8400
Listed By:
Melissa S Regna · License #10401283514
(585) 978-0761
Source:
Nicholcityrealty
Added: Jul 10
Changed: Oct 10
Last Checked: Oct 12 at 8:07PM
Displayed information is deemed reliable but is not guaranteed and should be independently verified. All listing content including descriptions, pricing, images are the copyrighted material of Keller Williams Realty Greater Rochester
Investment Insights
Based on property information with market context.
This historic mixed-use building provides approximately 3,312 square feet across a flexible two-level layout. The property includes a custom glass-enclosed office and separate conference room with wet bar on the first floor, while the second floor contains four spacious rooms suitable for offices, treatment areas, retail or service functions. Recent improvements include custom tile and hardwood flooring, remodeled bathrooms and kitchen, updated mechanics, a brand-new furnace, and newer AC units. The effective year built is 2006.
C-1 zoning supports the property’s documented commercial use potential, including retail, salon, professional office, restaurant/bar, medical, wellness, and showroom applications. The building is positioned between Rutgers and Oxford on Park Avenue and includes 9 on-site parking spaces, with neighborhood walkability and access to the Park Avenue area.
C-1 zoning supports the property’s documented commercial use potential, including retail, salon, professional office, restaurant/bar, medical, wellness, and showroom applications. The building is positioned between Rutgers and Oxford on Park Avenue and includes 9 on-site parking spaces, with neighborhood walkability and access to the Park Avenue area.
Key Highlights
- Approximately 3,312 square feet in a flexible historic mixed‑use building
- C‑1 zoning supports retail, salon, office, restaurant/bar, medical, wellness, and showroom uses
- 9 on‑site parking spaces
Financial Insights
Estimated NOI and Cap Rate
NOI / Yr
$47,633
Cap Rate
6.81%
Suggested Prices Based on Cap Rates
Cap Rate 5%
$952,660
$952.7K
Cap Rate 7%
$680,471
$680.5K
Cap Rate 9%
$529,256
$529.3K
Market Conditions
NOI Build-Up for 3,312 SF
Gross rent
$79.5K $24.00/SF
− Vacancy
−$16.0K −$4.82/SF
EGI
$63.5K $19.18/SF
− OpEx
−$15.9K −$4.79/SF
NOI
$47.6K $14.38/SF
Area
Rochester, NY
Vacancy
20.10%
Lease Rate
$24.00 /SF/Yr
Expense Ratio
25.00%
Simulate Cap Rate and NOI
Suggested Prices Based on Cap Rates
Cap Rate 5%
$952,660
Cap Rate 7%
$680,471
Cap Rate 9%
$529,256
Alternative Uses
Best Use
Office B
$680.5K
$595.4K – $793.9K
NOI $47,633 @ 7.0% cap · market cap 6.81%
Second Best
Retail
$641.7K
$561.5K – $748.7K
NOI $44,919 @ 7.0% cap · market cap 6.43%
Theoretical Best
Office A
$907.3K
$793.9K – $1.06M
NOI $63,511 @ 7.0% cap · market cap 9.09%
Zoning and permitted uses should be independently verified with authorities.
How Realmo checks its estimates
Property Analytics
Unlock full access to Insights
Subscribe to Realmo Intelligence
Open Analytics
Current Use
Location Intelligence
Trade Area within ½ mile
1,943
Businesses Nearby
Explore this area
Business Placement
Demographics for 14607, NY
16,298
Population
11,971
Households
1.4
Avg Household Size
32
Median Age
60%
College-Educated
95%
High-School Grad
1.7 sq mi
ZIP Area
9,587
Density / Sq Mi
$56,270
Median Household Income
$44,018
Median Earnings
$1,129
Median Rent
$304,100
Median Home Value
Check the figures for this property
Cap Rate, Value Estimation, Potential NOI and more
View Realmo Analytics
Market
Vacancy Rate% for Office in Rochester, NY

Questions? Ask Rey
Realmo’s AI knows this listing — price, zoning, demand, history. Ask anything.






Frequently Asked Questions
What type of property is this?
Mixed-use property - C-1-zoned property combines updated interiors with flexible two-level commercial space.
Where is this mixed-use property located?
The property is located at 383 Park Avenue Rochester, NY.
What is the asking price?
The asking price for this property is $699,000.
What are key features of this property?
This property features: Approximately 3,312 square feet in a flexible historic mixed‑use building; C‑1 zoning supports retail, salon, office, restaurant/bar, medical, wellness, and showroom uses; 9 on‑site parking spaces