Detached Houses, Great Rental
For Sale
$1,050,000
Pending
3821-3823 Cottonwood Street, San Diego, CA 92113
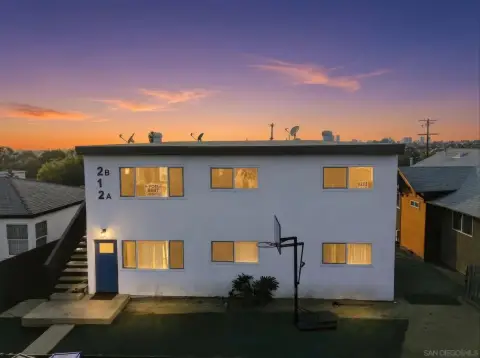
Two detached houses with separate water meters, great rental income.
Property Size3,050 SF
Days on Market235
Property Features for 3821-3823 Cottonwood Street
General Information
Standard status
Pending
Size
3,050 SF
Property subtype
Residential Income
Amenities
1 Story
Wall/Window
3.0
1
3
8
Composition
Gate
N/K
2
Wood/Stucco
Building Details
Year Built
1944
Listing Agency:
Allied Green Realty
Listed By:
Amar Harrag · License #01712576
(619) 573-0289
Source:
Compass
Added: Feb 21
Changed: Sep 30
Last Checked: Oct 12 at 10:16PM
Displayed information is deemed reliable but is not guaranteed and should be independently verified. All listing content including descriptions, pricing, images are the copyrighted material of Allied Green Realty
Investment Insights
Based on property information with market context.
This property presents a rental investment opportunity featuring two completely detached houses. Each house has separate water meters, allowing tenants to pay all utilities. The property is currently occupied by long-term tenants who are willing to stay and are open to signing long-term leases. The first unit, remodeled 5 years ago, includes new plumbing and electrical systems, and features 5 bedrooms and 2 bathrooms. The second unit has also been remodeled and contains 3 bedrooms and 1 full bathroom. The property size is 3050 square feet. Rents can be increased under new ownership. The property is located in San Diego, CA and is shown by appointment only; tenants should not be disturbed.
Key Highlights
- Two Detached Houses on One Property: Offers dual rental income streams.
- Tenants Pay All Utilities: Significantly reduces landlord expenses and increases profit margin.
- Remodeled Units: Unit one fully remodeled 5 years ago with new plumbing and electrical.
Financial Insights
Estimated NOI and Cap Rate
NOI / Yr
$50,411
Cap Rate
4.80%
Suggested Prices Based on Cap Rates
Cap Rate 5%
$1,008,220
$1.0M
Cap Rate 7%
$720,157
$720.2K
Cap Rate 9%
$560,122
$560.1K
Market Conditions
NOI Build-Up for 3,050 SF
Gross rent
$97.0K $31.80/SF
− Vacancy
−$5.3K −$1.75/SF
EGI
$91.7K $30.05/SF
− OpEx
−$41.2K −$13.52/SF
NOI
$50.4K $16.53/SF
Area
San Diego, CA
Vacancy
5.50%
Lease Rate
$31.80 /SF/Yr
Expense Ratio
45.00%
Simulate Cap Rate and NOI
Suggested Prices Based on Cap Rates
Cap Rate 5%
$1,008,220
Cap Rate 7%
$720,157
Cap Rate 9%
$560,122
Alternative Uses
Best Use
Apartment 5plus
$720.2K
$630.1K – $840.2K
NOI $50,411 @ 7.0% cap · market cap 4.80%
Second Best
—
—
no second resolved use
Theoretical Best
Specialty Retail
$1.20M
$1.05M – $1.41M
NOI $84,326 @ 7.0% cap · market cap 8.03%
Zoning and permitted uses should be independently verified with authorities.
How Realmo checks its estimates
Property Analytics
Unlock full access to Insights
Subscribe to Realmo Intelligence
Open Analytics
Current Use
Location Intelligence
Trade Area within ½ mile
1,065
Businesses Nearby
Explore this area
Business Placement
Demographics for 92113, CA
50,457
Population
14,443
Households
3.5
Avg Household Size
32
Median Age
11%
College-Educated
69%
High-School Grad
4.5 sq mi
ZIP Area
11,213
Density / Sq Mi
$59,177
Median Household Income
$31,099
Median Earnings
$1,608
Median Rent
$559,100
Median Home Value
Check the figures for this property
Cap Rate, Value Estimation, Potential NOI and more
View Realmo Analytics
Market
Vacancy Rate% for Multifamily in West region

Questions? Ask Rey
Realmo’s AI knows this listing — price, zoning, demand, history. Ask anything.




Frequently Asked Questions
What type of property is this?
Multifamily property - Two detached houses with separate water meters, great rental income.
Where is this multifamily property located?
The property is located at 3821-3823 Cottonwood Street San Diego, CA.
What is the asking price?
The asking price for this property is $1,050,000.
What are key features of this property?
This property features: Two Detached Houses on One Property: Offers dual rental income streams.; Tenants Pay All Utilities: Significantly reduces landlord expenses and increases profit margin.; Remodeled Units: Unit one fully remodeled 5 years ago with new plumbing and electrical.


