Three-Unit Waterfront Restaurant
For Sale
$1,395,000
382 Thames Street Bristol, Bristol, RI 02809
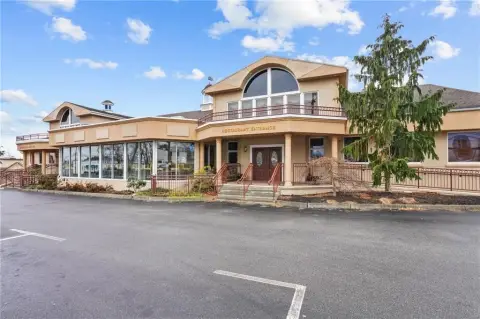
Standalone three-unit property with two long-term NNN restaurant tenants and a third warehouse unit available for lease.
Property Size8,514 SF
Price / SF$214.09
Days on Market138
Property Features for 382 Thames Street Bristol
General Information
Standard status
Active
Size
8,514 SF
Total Parking Spaces
10
Zoning
W
Taxes and HOA fees
Annual Taxes
$16,197
Building Details
Building Size
8,514 SF
Year Built
1900
Buildings
1
Stories
1
Tenancy
Multi
Listed By:
Debra Viveiros
(774) 309-3101
Source:
Milestonerealtyinc
Added: Jun 4
Changed: Oct 7
Last Checked: Oct 7 at 8:47AM
Displayed information is deemed reliable but is not guaranteed and should be independently verified. All listing content including descriptions, pricing, images are the copyrighted material of Debra Viveiros

Ask AI about this property
Review the available facts, identify missing information and prepare questions for the agent.
Investment Insights
Based on property information with market context.
This free-standing three-unit building includes two spaces currently occupied by independent restaurants under long-term NNN leases, plus a third warehouse-type unit presently occupied by the owner and offered for lease at a size of over 2,500 square feet. The property is configured as separate units with separate utilities and includes off-street parking for easy customer and employee access. The building offers more than one operating option within the same asset, with the third unit intended for future tenancy.
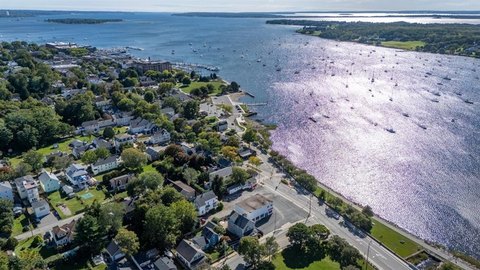
Located in the Waterfront District, the property provides over 115 feet of frontage directly across from Bristol Harbor, the East Bay bike path, and Independence Park. It is also described as being within walking distance to the Bristol Harbor Inn Hotel and Event Center and other downtown attractions, supporting straightforward access by car, bike, or foot in a high-traffic downtown setting.
For restaurant operators, investors, or buyers seeking a mixed-use configuration, the current arrangement provides in-place restaurant occupancy on NNN terms while also leaving the remaining unit available to lease. Prospective purchasers should perform their own due diligence regarding any potential alternative uses or legislative changes discussed in the remarks, including confirming feasibility, approvals, and requirements on their own.
Located in the Waterfront District, the property provides over 115 feet of frontage directly across from Bristol Harbor, the East Bay bike path, and Independence Park. It is also described as being within walking distance to the Bristol Harbor Inn Hotel and Event Center and other downtown attractions, supporting straightforward access by car, bike, or foot in a high-traffic downtown setting.
For restaurant operators, investors, or buyers seeking a mixed-use configuration, the current arrangement provides in-place restaurant occupancy on NNN terms while also leaving the remaining unit available to lease. Prospective purchasers should perform their own due diligence regarding any potential alternative uses or legislative changes discussed in the remarks, including confirming feasibility, approvals, and requirements on their own.
Key Highlights
- Free‑standing three‑unit building in Bristol’s Waterfront District
- Two units are currently occupied by independent restaurants with long‑term NNN leases
- Third unit is a warehouse‑type space available for lease with over 2,500 SF
Financial Insights
Estimated NOI and Cap Rate
NOI / Yr
$115,652
Cap Rate
8.29%
Suggested Prices Based on Cap Rates
Cap Rate 5%
$2,313,040
$2.3M
Cap Rate 7%
$1,652,171
$1.7M
Cap Rate 9%
$1,285,022
$1.3M
Market Conditions
NOI Build-Up for 6,516 SF
Gross rent
$160.3K $24.60/SF
− Vacancy
−$6.1K −$0.93/SF
EGI
$154.2K $23.67/SF
− OpEx
−$38.6K −$5.92/SF
NOI
$115.7K $17.75/SF
Area
Bristol County, RI
Vacancy
3.80%
Lease Rate
$24.60 /SF/Yr
Expense Ratio
25.00%
Simulate Cap Rate and NOI
Suggested Prices Based on Cap Rates
Cap Rate 5%
$2,313,040
Cap Rate 7%
$1,652,171
Cap Rate 9%
$1,285,022
Alternative Uses
Best Use
Specialty Retail
$1.65M
$1.45M – $1.93M
NOI $115,652 @ 7.0% cap · market cap 8.29%
Second Best
Warehouse
$1.03M
$898.1K – $1.20M
NOI $71,847 @ 7.0% cap · market cap 5.15%
Theoretical Best
Office A
$2.18M
$1.91M – $2.54M
NOI $152,597 @ 7.0% cap · market cap 10.94%
Zoning and permitted uses should be independently verified with authorities.
How Realmo checks its estimates
Property Analytics
Unlock full access to Insights
Subscribe to Realmo Intelligence
Open Analytics
Current Use
Lease Details
Multi-tenant
Tenancy
Location Intelligence
Trade Area within ½ mile
643
Businesses Nearby
Under-served
Demand for This Use
Explore this area
Business Placement
Demographics for 02809, RI
22,493
Population
9,670
Households
2.3
Avg Household Size
44
Median Age
46%
College-Educated
92%
High-School Grad
9.8 sq mi
ZIP Area
2,295
Density / Sq Mi
$96,005
Median Household Income
$41,266
Median Earnings
$1,352
Median Rent
$447,500
Median Home Value
Check the figures for this property
Cap Rate, Value Estimation, Potential NOI and more
View Realmo Analytics
Market
Vacancy Rate% for Industrial in Northeast region




Frequently Asked Questions
What type of property is this?
Conventional restaurant - Standalone three-unit property with two long-term NNN restaurant tenants and a third warehouse unit available for lease.
Where is this conventional restaurant located?
The property is located at 382 Thames Street Bristol Bristol, RI.
What is the asking price?
The asking price for this property is $1,395,000.
What are key features of this property?
This property features: Free‑standing three‑unit building in Bristol’s Waterfront District; Two units are currently occupied by independent restaurants with long‑term NNN leases; Third unit is a warehouse‑type space available for lease with over 2,500 SF


