Lansing Airport Hangar with
For Sale
$649,000
3800 Capital City Blvd, Lansing, MI 48906
Versatile aviation property with hangar and office suites for sale.
Property Size2,400 SF
Lot Size0.66 Acres
Days on Market312
Property Features for 3800 Capital City Blvd
General Information
Standard status
Active
Size
2,400 SF
Lot size
0.66 Acres
Property subtype
Commercial
Taxes and HOA fees
Annual Taxes
$15,660
Building Details
Building Size
2,400 SF
Year Built
1972
Listing Agency:
Exclusive House of Real Estate
Listed By:
Ashley Andrews · License #6501418707
(810) 498-4016
Source:
Elliman
Added: Nov 28, 2025
Changed: Oct 4
Last Checked: Oct 5 at 7:23PM
Displayed information is deemed reliable but is not guaranteed and should be independently verified. All listing content including descriptions, pricing, images are the copyrighted material of Exclusive House of Real Estate
Investment Insights
Based on property information with market context.
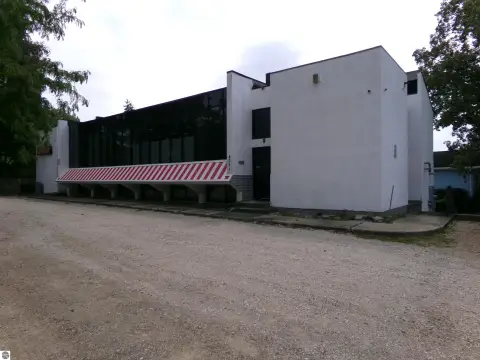
Located on Lansing Airport property with secured airfield access, this 10,880 SF building offers versatility and unmatched convenience for aviation-aligned businesses or corporate users. The property includes a fully occupied office suite (Suite A), a 2,400 SF professional office (Suite B) available for lease at $1/SF/month NNN, and a 5,760 SF private hangar with an attached office and half bath. The hangar features private access and connects directly to the airport apron. Lansing’s central location provides immediate access to I-96, I-69, and US-127—just over an hour from both Detroit and Grand Rapids, and a straight shot north to Traverse City. Whether for private aviation, executive travel, or strategic business expansion, this property offers a rare opportunity to establish a foothold in the heart of Michigan.
Key Highlights
- Secured airfield access on Lansing Airport property.
- 5,760 SF private hangar with direct apron access.**
- 2,400 SF professional office suite available for lease.
Financial Insights
Estimated NOI and Cap Rate
NOI / Yr
$23,155
Cap Rate
3.57%
Suggested Prices Based on Cap Rates
Cap Rate 5%
$463,100
$463.1K
Cap Rate 7%
$330,786
$330.8K
Cap Rate 9%
$257,278
$257.3K
Market Conditions
NOI Build-Up for 2,400 SF
Gross rent
$38.6K $16.08/SF
− Vacancy
−$7.7K −$3.22/SF
EGI
$30.9K $12.86/SF
− OpEx
−$7.7K −$3.22/SF
NOI
$23.2K $9.65/SF
Area
Lansing, MI
Vacancy
20.00%
Lease Rate
$16.08 /SF/Yr
Expense Ratio
25.00%
Simulate Cap Rate and NOI
Suggested Prices Based on Cap Rates
Cap Rate 5%
$463,100
Cap Rate 7%
$330,786
Cap Rate 9%
$257,278
Alternative Uses
Best Use
Office B
$330.8K
$289.4K – $385.9K
NOI $23,155 @ 7.0% cap · market cap 3.57%
Second Best
—
—
no second resolved use
Theoretical Best
Office A
$494.0K
$432.3K – $576.4K
NOI $34,581 @ 7.0% cap · market cap 5.33%
Zoning and permitted uses should be independently verified with authorities.
Property Analytics
Current Use
Location Intelligence
Trade Area within ½ mile
19
Businesses Nearby
Explore this area
Business Placement
Demographics for 48906, MI
25,674
Population
12,180
Households
2.1
Avg Household Size
37
Median Age
29%
College-Educated
91%
High-School Grad
32.5 sq mi
ZIP Area
790
Density / Sq Mi
$61,533
Median Household Income
$38,551
Median Earnings
$1,033
Median Rent
$128,600
Median Home Value
Market
Vacancy Rate% for Office in Midwest region

Questions? Ask Rey
Realmo’s AI knows this listing — price, zoning, demand, history. Ask anything.






Frequently Asked Questions
What type of property is this?
Aviation real estate - Versatile aviation property with hangar and office suites for sale.
Where is this aviation real estate located?
The property is located at 3800 Capital City Blvd Lansing, MI.
What is the asking price?
The asking price for this property is $649,000.
What are key features of this property?
This property features: Secured airfield access on Lansing Airport property.; 5,760 SF private hangar with direct apron access.**; 2,400 SF professional office suite available for lease.



