Turnkey Restaurant with Full
For Sale
$1,650,000
38 Dike Street, Providence, RI 02909
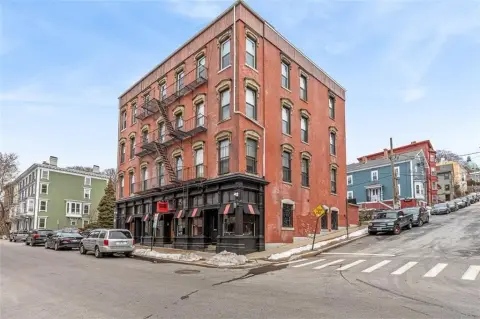
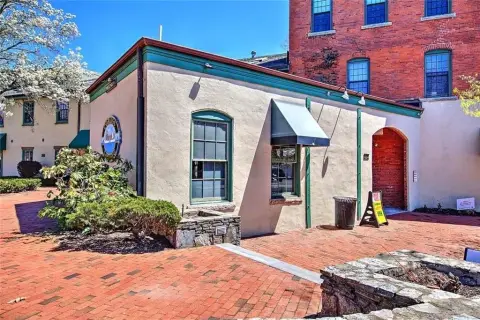
Recently renovated restaurant with full kitchen, two bars, and dining seating for 150+ plus an upper floor for redevelopment.
Property Size11,000 SF
Days on Market119
Property Features for 38 Dike Street
General Information
Standard status
Active
Size
11,000 SF
Total Parking Spaces
35
Property subtype
Retail
Additional Details
Business Included
Yes
Building Details
Building Size
11,000 SF
Year Built
1900
Stories
2
Listing Agency:
MG Commercial
Listed By:
Leeds Mitchell IV, SIOR · License #RI #REB.0019529
(401) 261-5804
Source:
Mgcommercial
Added: Jun 24
Changed: Oct 3
Last Checked: Oct 19 at 4:11AM
Displayed information is deemed reliable but is not guaranteed and should be independently verified. All listing content including descriptions, pricing, images are the copyrighted material of MG Commercial

Ask AI about this property
Review the available facts, identify missing information and prepare questions for the agent.
Investment Insights
Based on property information with market context.
Located at 38 Dike Street in Providence, the former Wes' Rib House is offered for sale as a turnkey restaurant operation. The property includes a full kitchen with new restaurant equipment, two full bars, and a spacious dining area with tables, chairs, and banquets. A recent renovation is complemented by a new roof, new windows, and HVAC updates. The offering also includes all FF&E, with additional items available upon request.
In addition to the main dining and service spaces, there is extra space on the upper floor that may be redeveloped. The property is supported by 35+ on-site parking spaces. The surrounding area features numerous active redevelopments, which may support continued interest in food and beverage uses.
This is a practical fit for an operator seeking a ready-to-run restaurant with in-place kitchen infrastructure, bar programs, and established dining capacity. The current seating is for over 150 guests, and the layout accommodates both banquets and regular table service. Ownership also includes trademark, website, and IP (details available upon request), which may be relevant for buyers looking to maintain brand continuity while leveraging the additional upper-floor space for future improvements.
In addition to the main dining and service spaces, there is extra space on the upper floor that may be redeveloped. The property is supported by 35+ on-site parking spaces. The surrounding area features numerous active redevelopments, which may support continued interest in food and beverage uses.
This is a practical fit for an operator seeking a ready-to-run restaurant with in-place kitchen infrastructure, bar programs, and established dining capacity. The current seating is for over 150 guests, and the layout accommodates both banquets and regular table service. Ownership also includes trademark, website, and IP (details available upon request), which may be relevant for buyers looking to maintain brand continuity while leveraging the additional upper-floor space for future improvements.
Key Highlights
- Recently renovated turnkey restaurant featuring a full kitchen with new restaurant equipment
- Includes two (2) full bars and a spacious dining area with tables, chairs, and banquets
- Current seating for 150+ customers
Financial Insights
Estimated NOI and Cap Rate
NOI / Yr
$108,801
Cap Rate
6.59%
Suggested Prices Based on Cap Rates
Cap Rate 5%
$2,176,020
$2.2M
Cap Rate 7%
$1,554,300
$1.6M
Cap Rate 9%
$1,208,900
$1.2M
Market Conditions
NOI Build-Up for 11,000 SF
Gross rent
$165.0K $15.00/SF
− Vacancy
−$9.6K −$0.87/SF
EGI
$155.4K $14.13/SF
− OpEx
−$46.6K −$4.24/SF
NOI
$108.8K $9.89/SF
Area
Providence, RI
Vacancy
5.80%
Lease Rate
$15.00 /SF/Yr
Expense Ratio
30.00%
Simulate Cap Rate and NOI
Suggested Prices Based on Cap Rates
Cap Rate 5%
$2,176,020
Cap Rate 7%
$1,554,300
Cap Rate 9%
$1,208,900
Alternative Uses
Best Use
Specialty Retail
$2.79M
$2.44M – $3.25M
NOI $195,238 @ 7.0% cap · market cap 11.83%
Second Best
Industrial
$1.55M
$1.36M – $1.81M
NOI $108,801 @ 7.0% cap · market cap 6.59%
Theoretical Best
Office A
$3.68M
$3.22M – $4.29M
NOI $257,607 @ 7.0% cap · market cap 15.61%
Zoning and permitted uses should be independently verified with authorities.
How Realmo checks its estimates
Property Analytics
Unlock full access to Insights
Subscribe to Realmo Intelligence
Open Analytics
Current Use
Lease Details
Turnkey business
Opportunity
Location Intelligence
Trade Area within ½ mile
1,395
Businesses Nearby
117k
Monthly Visits Nearby
Under-served
Demand for This Use
Explore this area
Business Placement
Foot Traffic Nearby
Shops & Services 50%
Dining 46%
Electronics 3%
Home Improvements & Furnishings 1%
McDonald's
Dining
22,557 visits/mo
0.1 miles
Bank of America
Shops & Services
18,247 visits/mo
0.1 miles
Dunkin' Donuts
Dining
14,816 visits/mo
0.2 miles
Family Dollar
Shops & Services
13,690 visits/mo
0.2 miles
Burger King
Dining
12,060 visits/mo
0.2 miles
Demographics for 02909, RI
46,119
Population
18,602
Households
2.5
Avg Household Size
31
Median Age
24%
College-Educated
80%
High-School Grad
3.1 sq mi
ZIP Area
14,877
Density / Sq Mi
$63,950
Median Household Income
$37,090
Median Earnings
$1,258
Median Rent
$283,800
Median Home Value
Check the figures for this property
Cap Rate, Value Estimation, Potential NOI and more
View Realmo Analytics
Market
Vacancy Rate% for Retail in Providence, RI



Frequently Asked Questions
What type of property is this?
Conventional restaurant - Recently renovated restaurant with full kitchen, two bars, and dining seating for 150+ plus an upper floor for redevelopment.
Where is this conventional restaurant located?
The property is located at 38 Dike Street Providence, RI.
What is the asking price?
The asking price for this property is $1,650,000.
What are key features of this property?
This property features: Recently renovated turnkey restaurant featuring a full kitchen with new restaurant equipment; Includes two (2) full bars and a spacious dining area with tables, chairs, and banquets; Current seating for 150+ customers