Industrial Flex Facility with Corner
For Sale
$600,000
377 Highway 40 W, Inglis, FL 34449
CommercialSale, Inglis, FL
Property Size7,614 SF
Lot Size2.50 Acres
Price / SF$78.80
Days on Market367
Property Features for 377 Highway 40 W
General Information
Property type
Commercial Sale
Property subtype
Other
Zoning
C1,IND
Parking features
Parking Lot, Driveway
Interior features
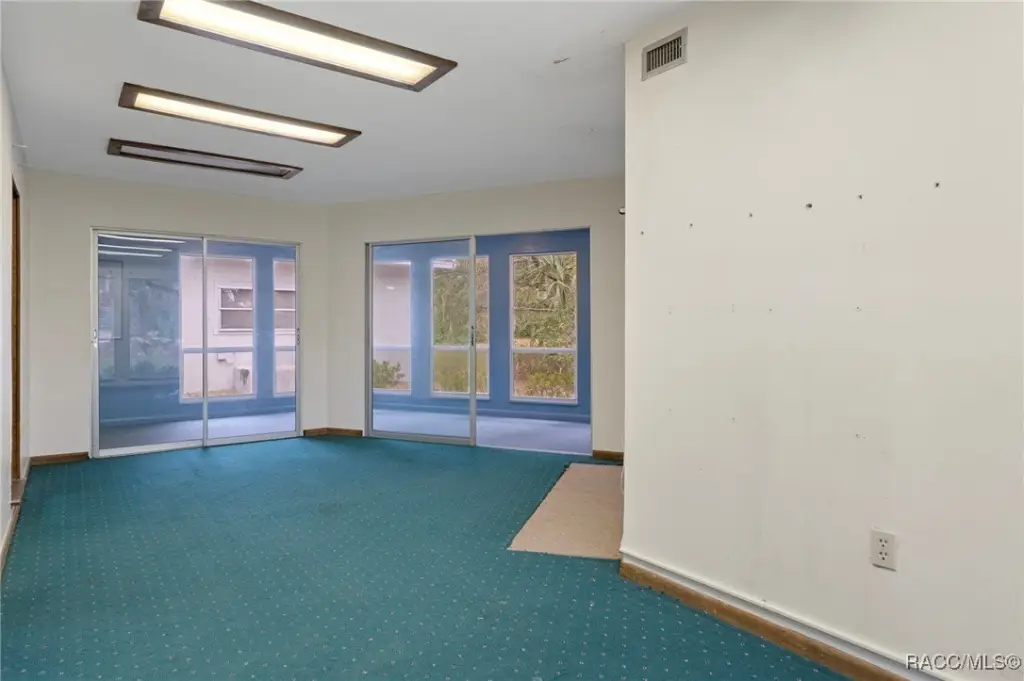
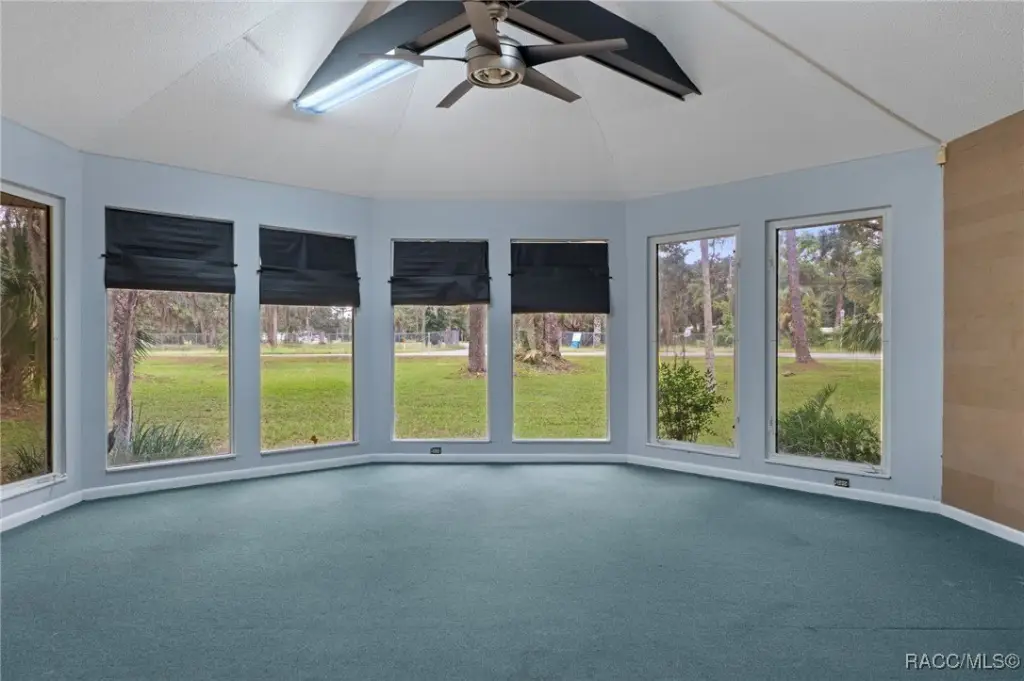
HighCeilings, SolidSurfaceCounters, SlidingGlassDoors
Exterior features
BlacktopDriveway
Subdivision
Cason Inglis Acres
Lot features
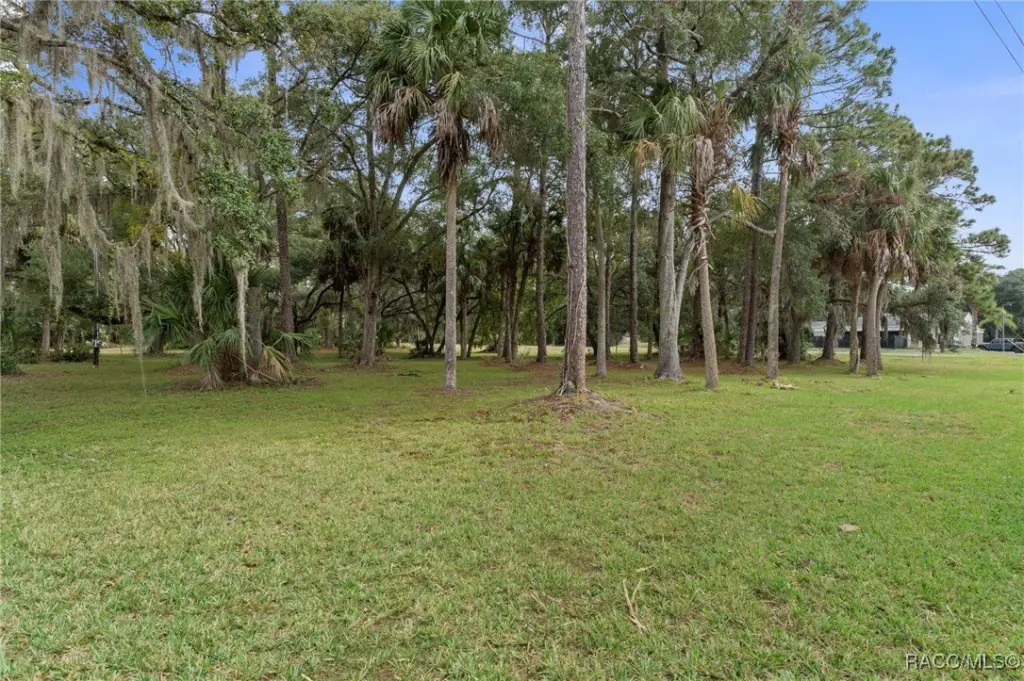
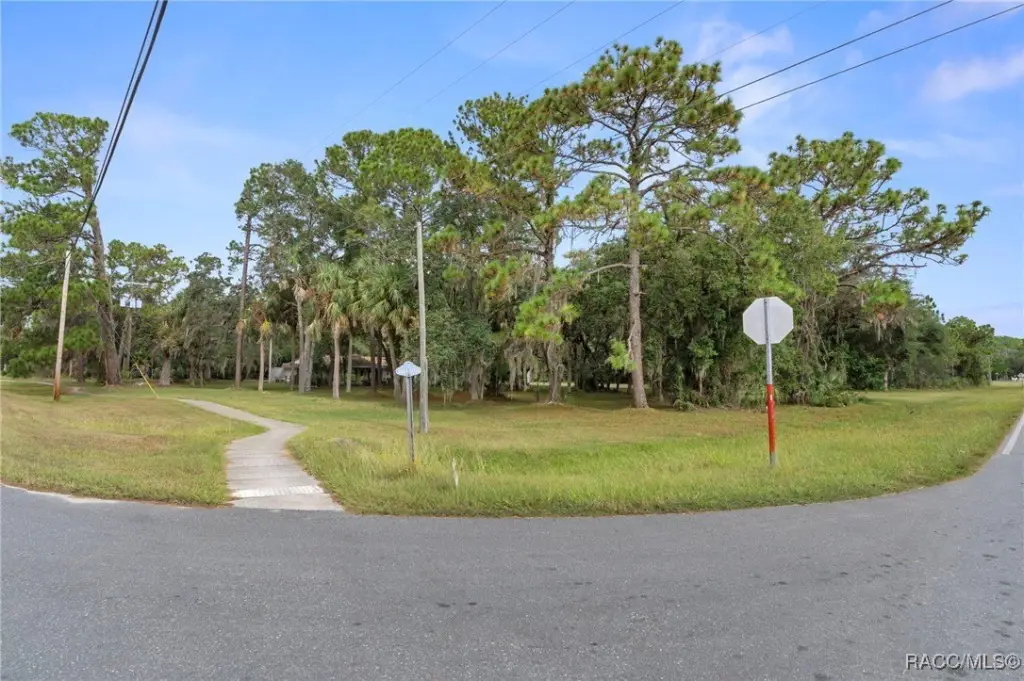
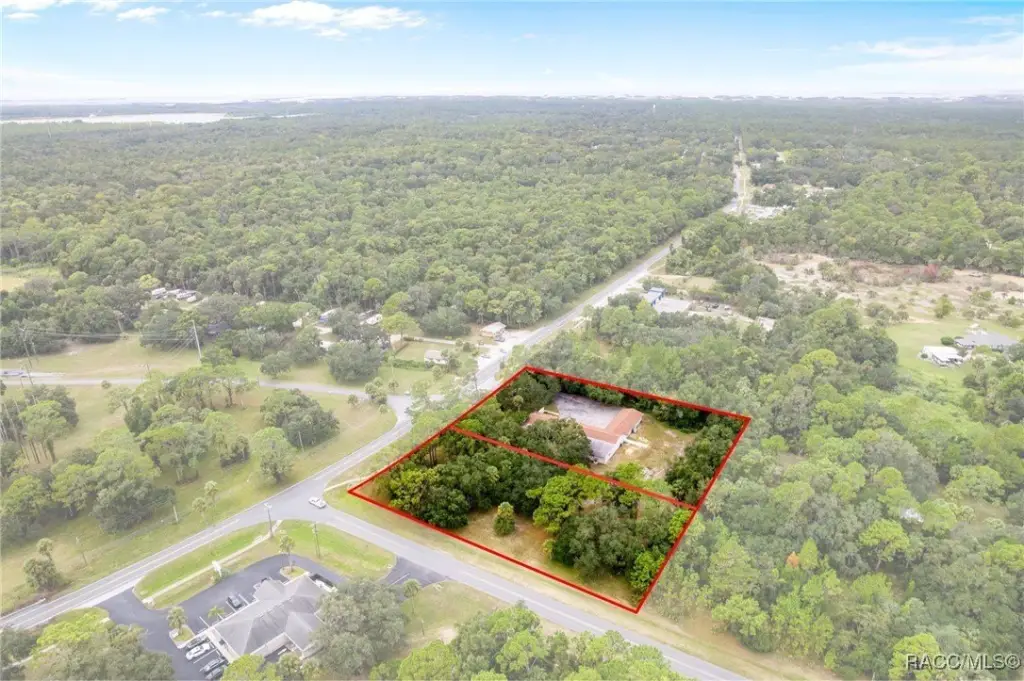
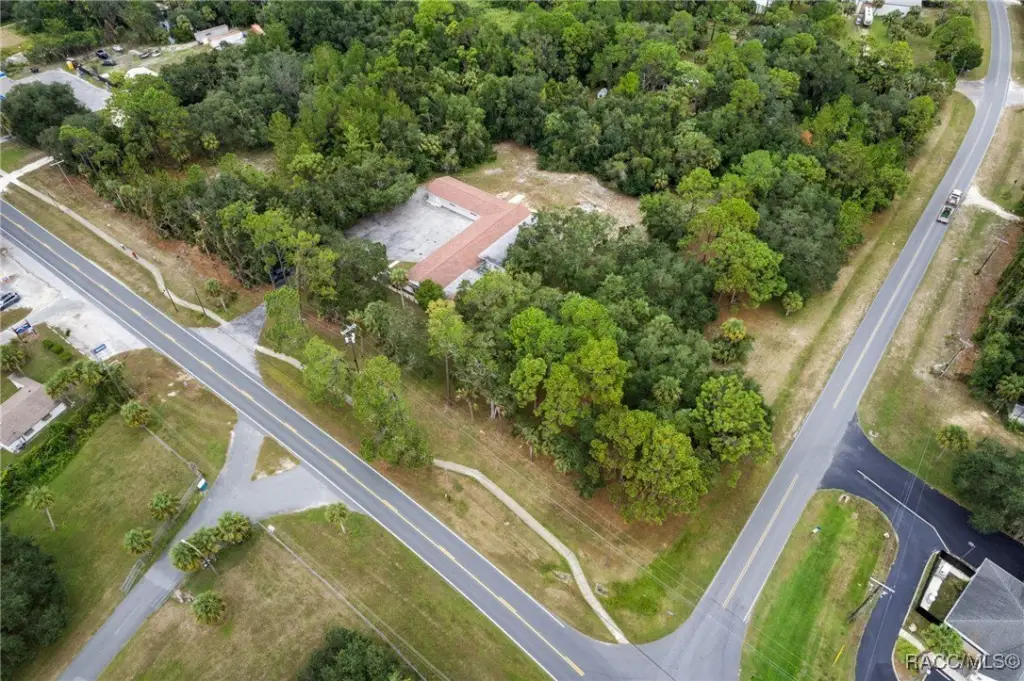
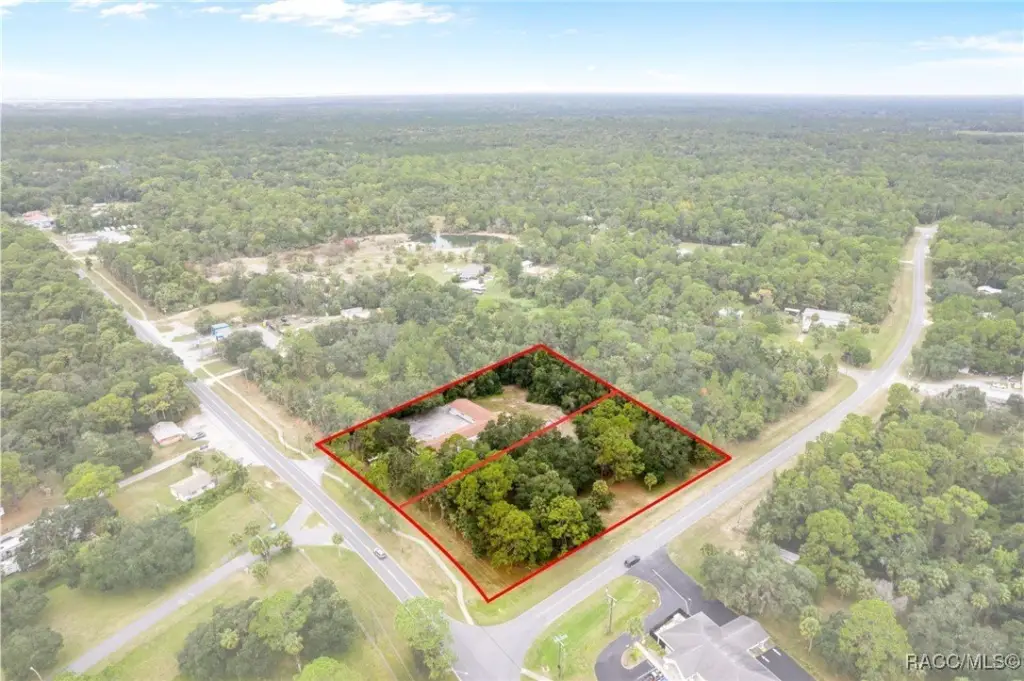
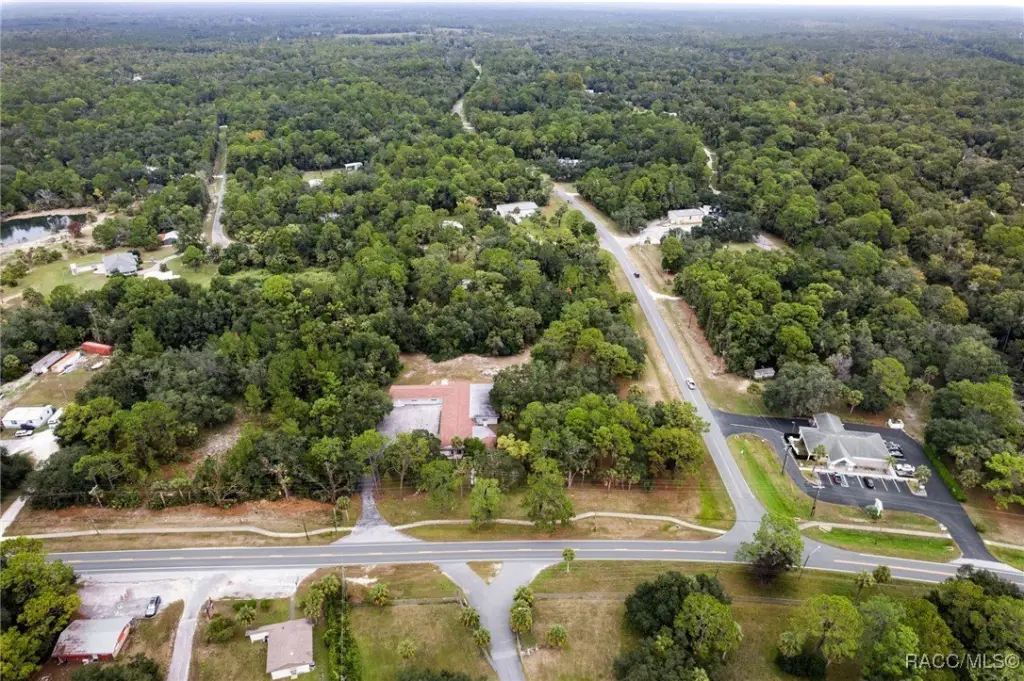
Acreage, Corner Lot, Flat, Rectangular, Trees
Directions
US Hwy 19/98 North, turn left onto CR 40, asset is on the right.
Standard status
Active
APN
1247200000
Lot size
2.50 Acres
Taxes and HOA fees
Tax Year
2025
Tax Description
34-16-16 CASONS INGLIS ACRES UNIT 1 BLK A LOT 2 OR BOOK 636 PAGE 177 & 34-16-16 CASONS INGLIS ACRES UNIT 1 BLK A LOT 1 OR BOOK 667 PAGE 532
Tax Annual Amount
4454
Legal Description
34-16-16 CASONS INGLIS ACRES UNIT 1 BLK A LOT 2 OR BOOK 636 PAGE 177 & 34-16-16 CASONS INGLIS ACRES UNIT 1 BLK A LOT 1 OR BOOK 667 PAGE 532
Utilities
Sewer type
Septic Tank
Heating system
Heat Pump (Heating)
Cooling system
Ductless, Window Unit(s), Central Air
Water source
Public
Building Details
Year built
1981
Floors in Building
1
Flooring type
Tile, Concrete, Vinyl, Carpet
Building materials
Brick, Stucco
Roof type
Asphalt, Shingle
Listing Agency:
Century 21 J.W.Morton R.E. · Century 21 Real Estate
(352) 726-6668
Listed By:
Richard Fernley · License #3602811
(352) 464-2664
Added: Oct 7, 2025
Changed: Oct 7
Last Checked: Oct 8 at 7:06AM
MLS# 848792
Copyright © 2026 REALTORS Association of Citrus County, Inc. All rights reserved. All information provided by the listing agent/broker is deemed reliable but is not guaranteed and should be independently verified.
Investment Insights
Based on property information with market context.
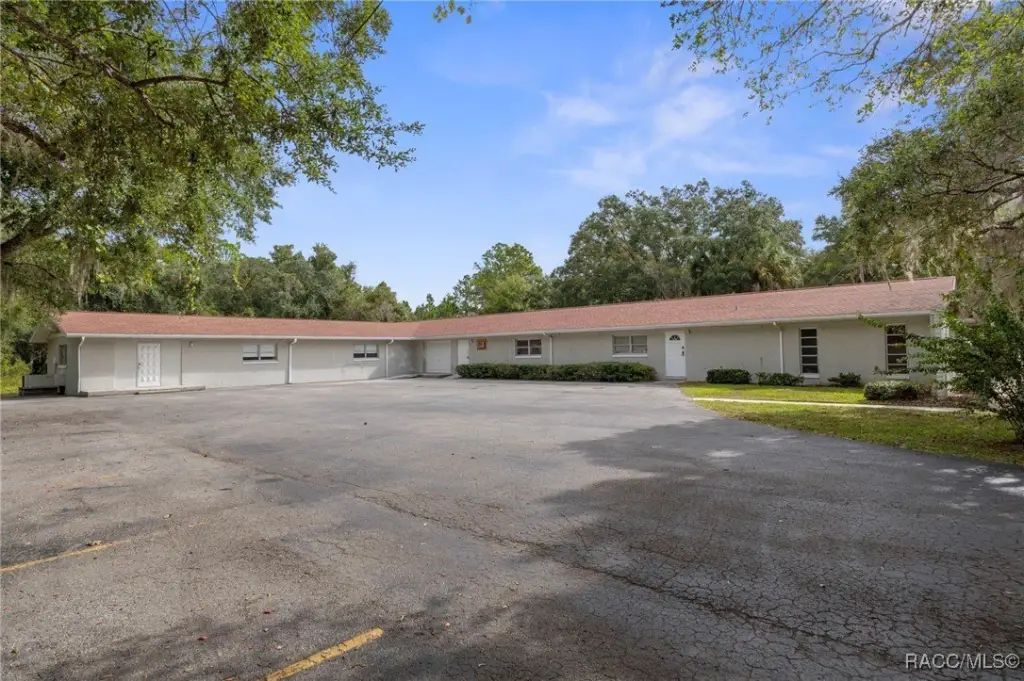
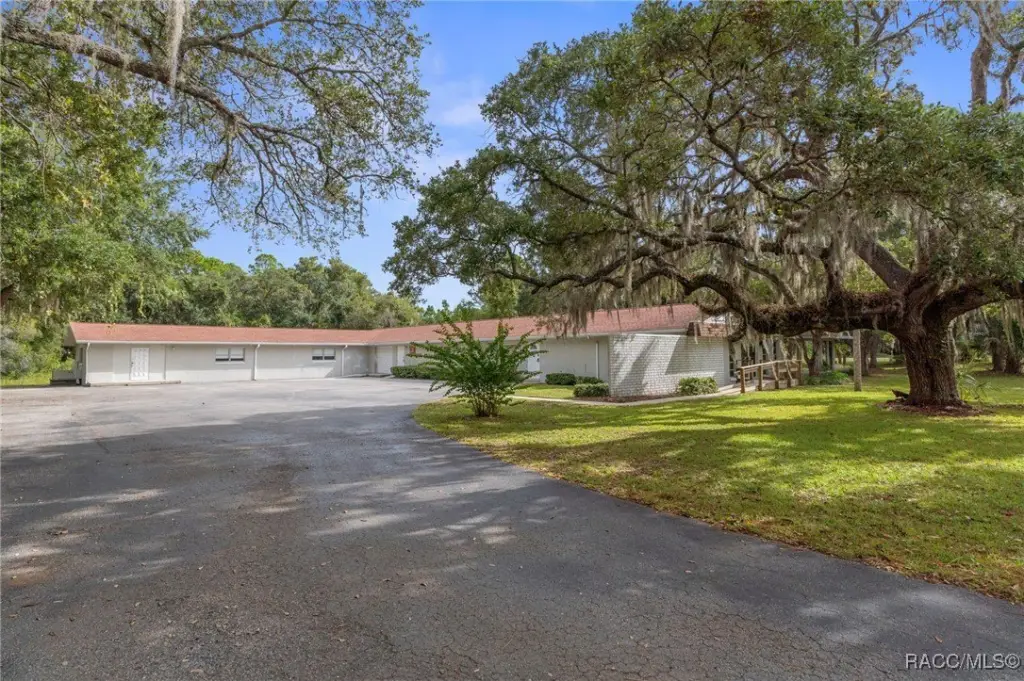
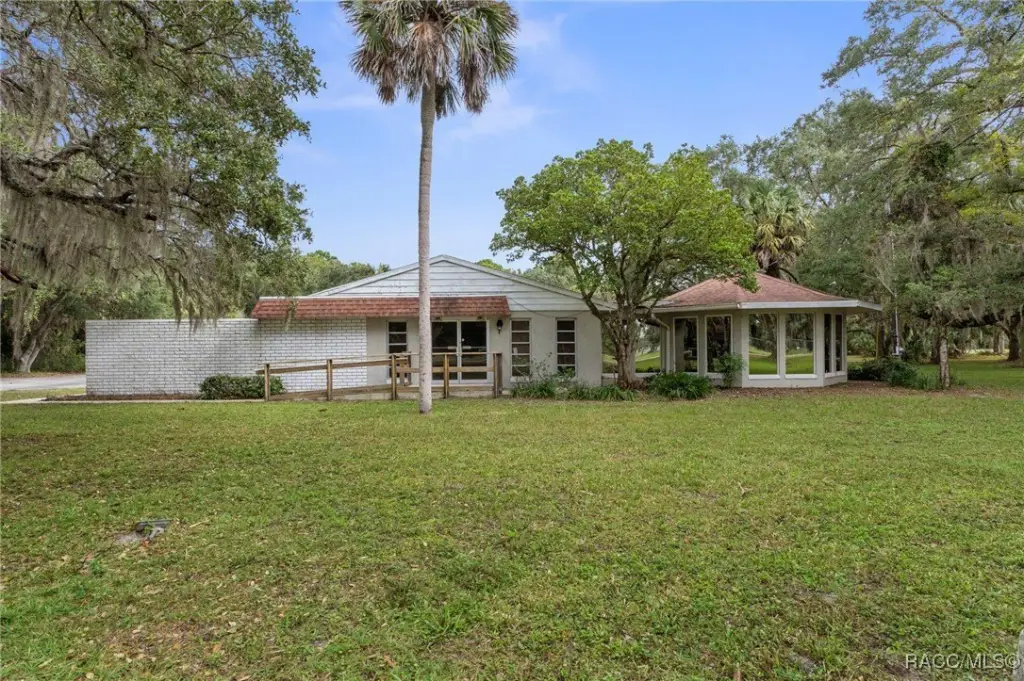
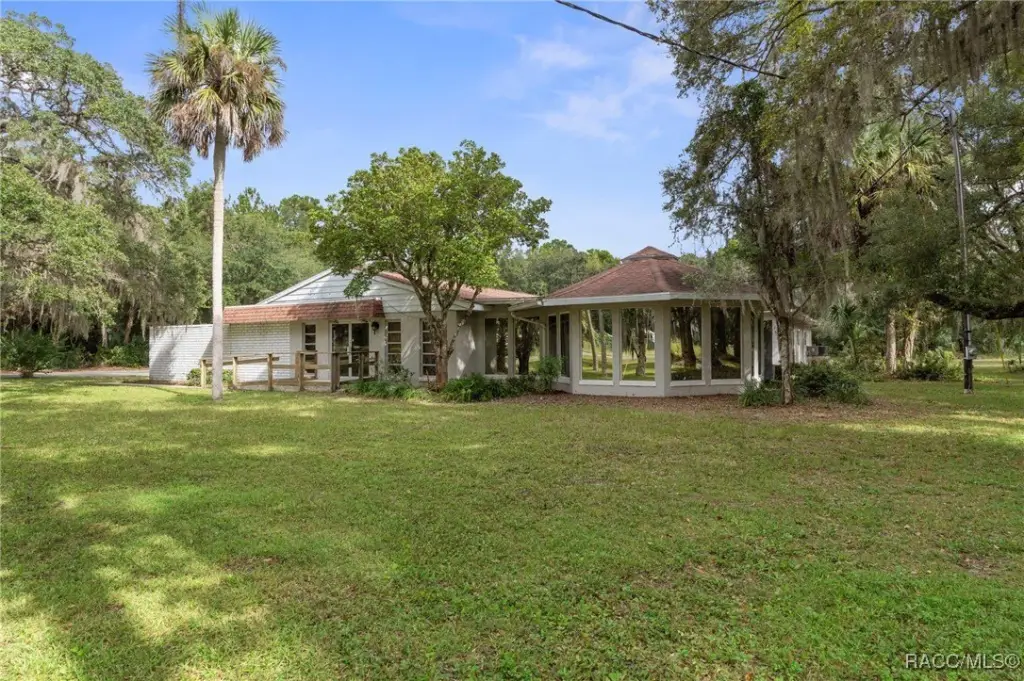
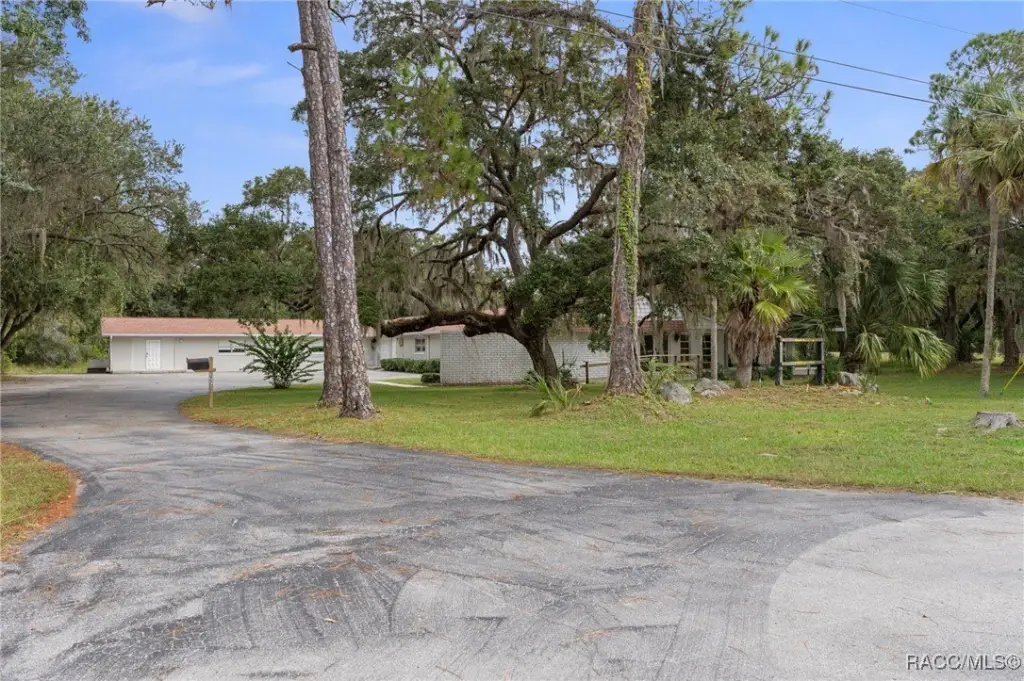
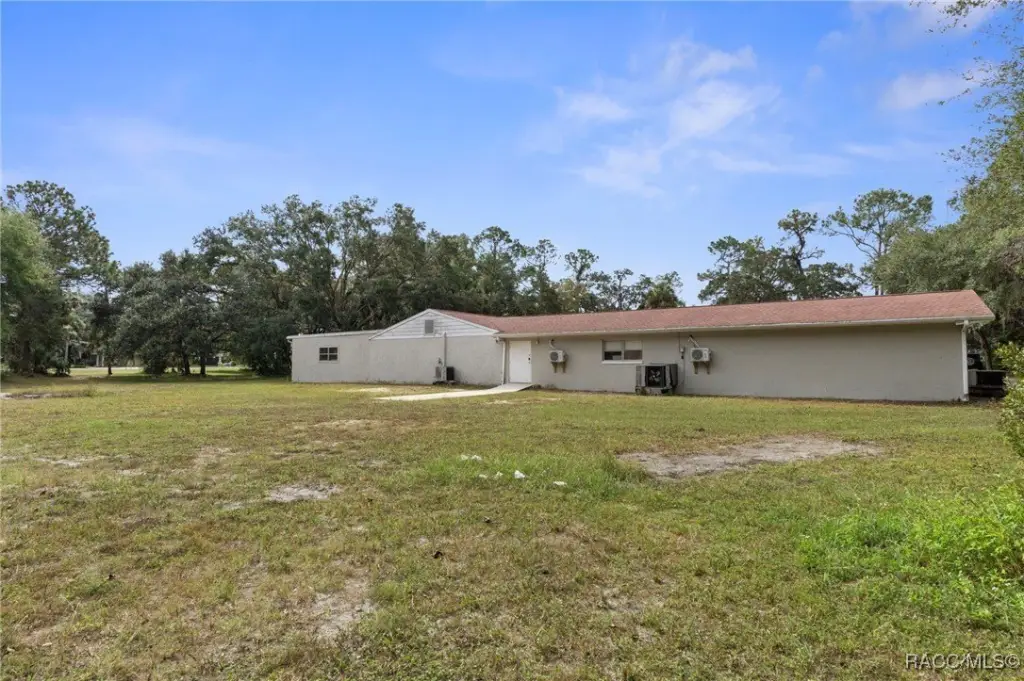
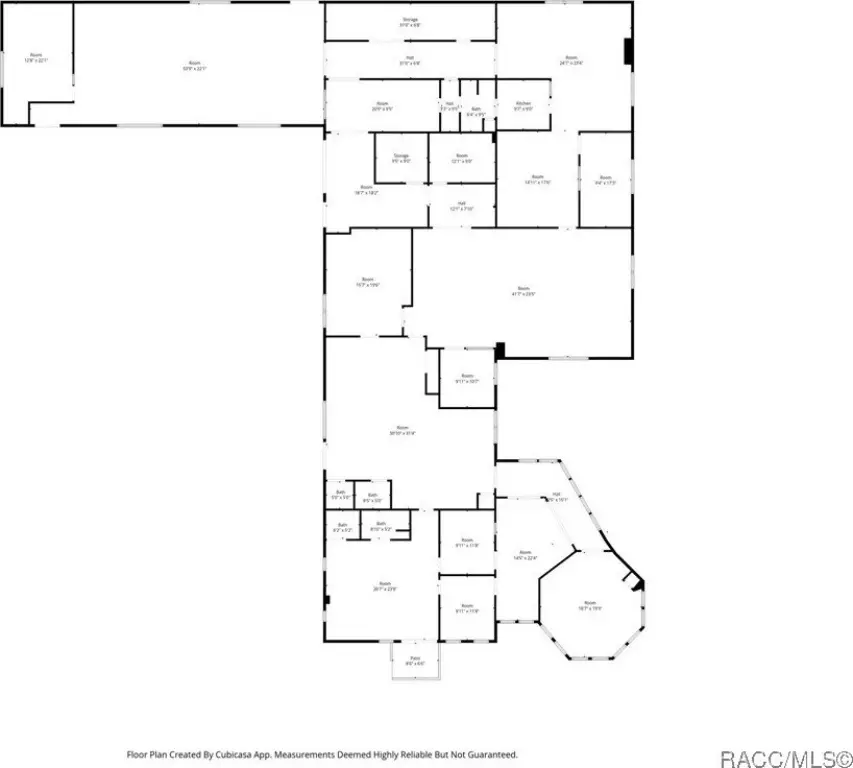
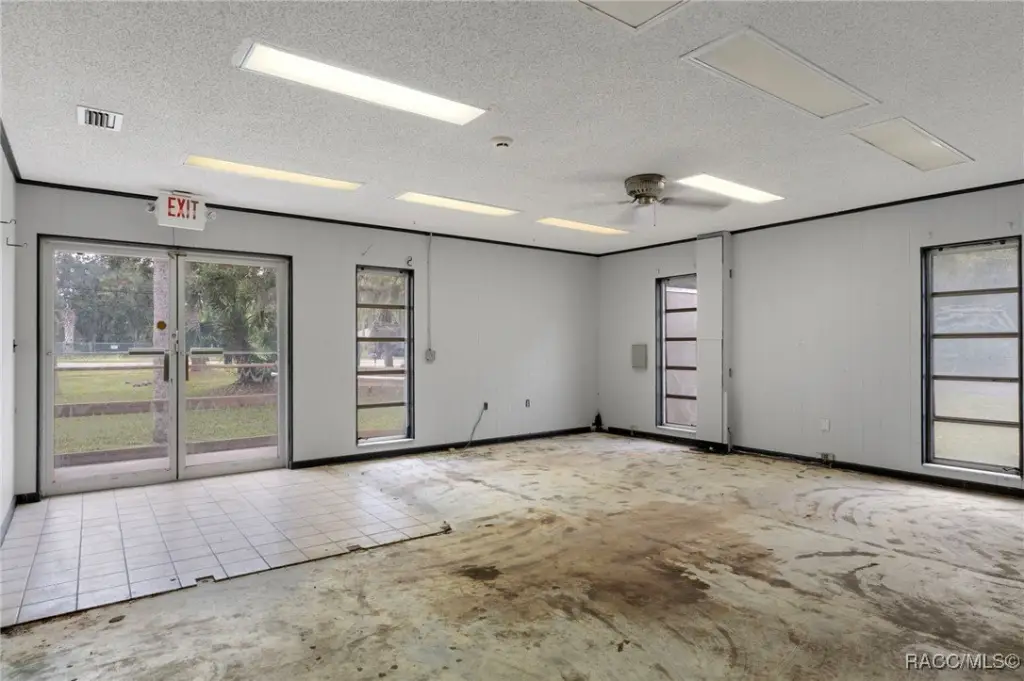
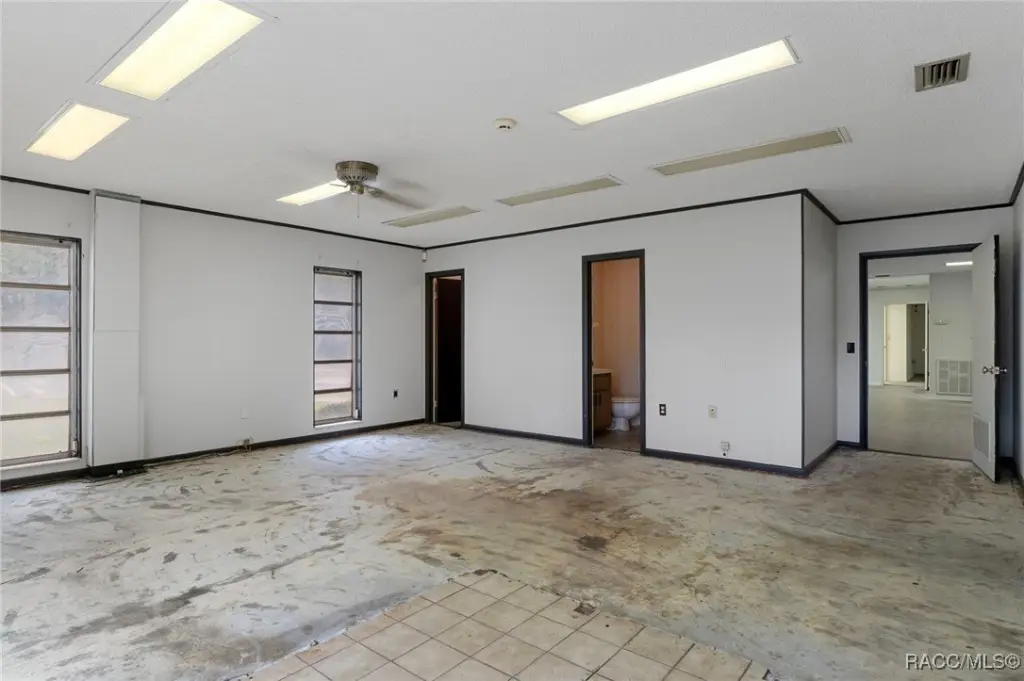
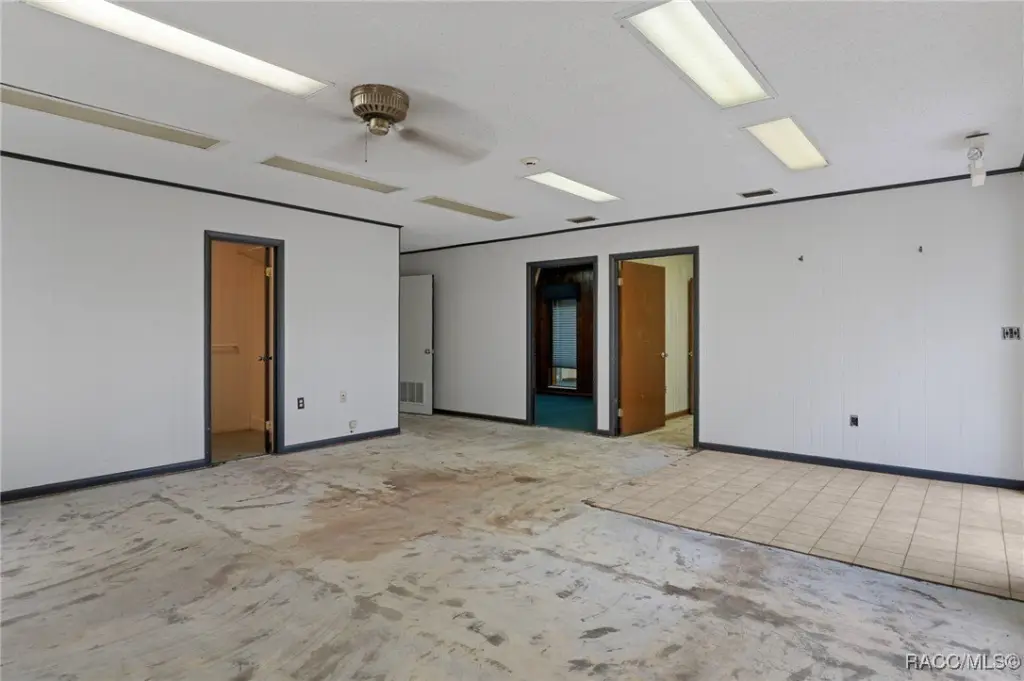
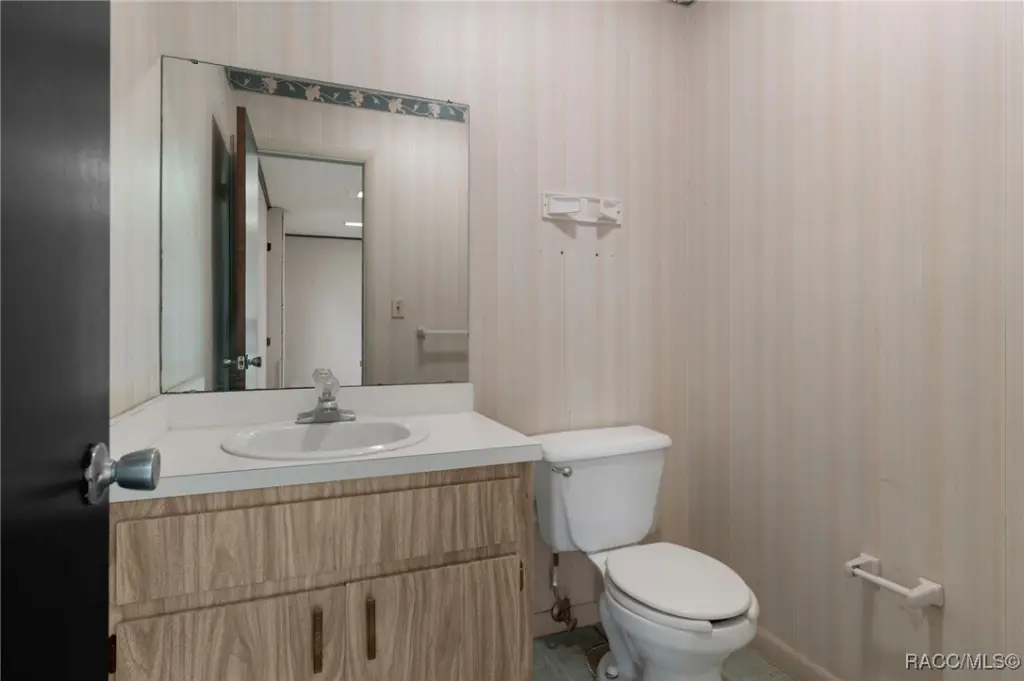
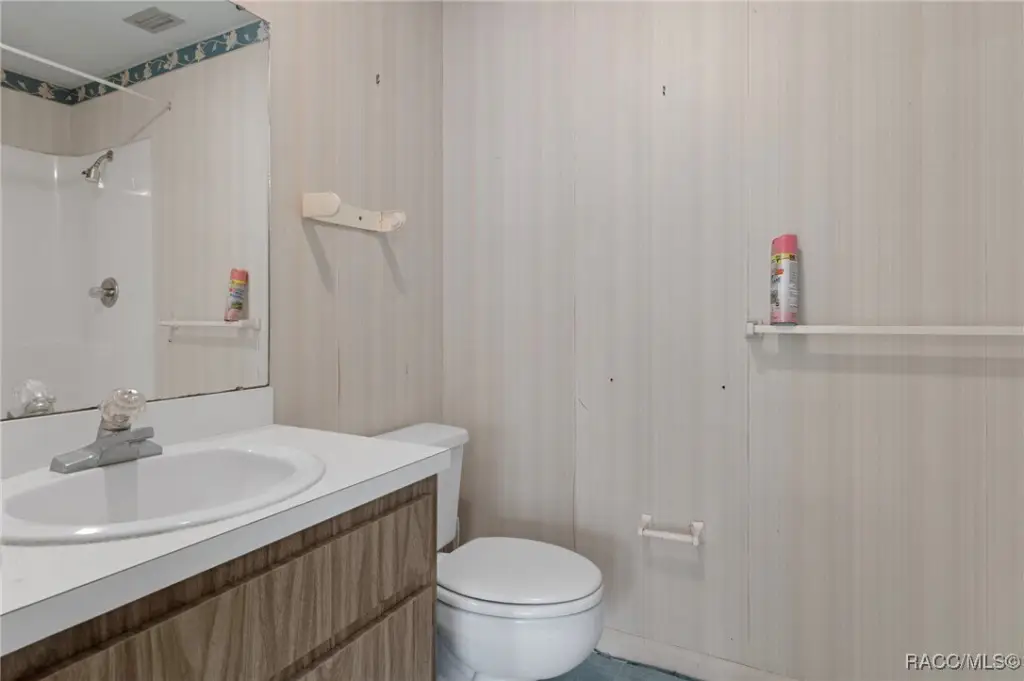
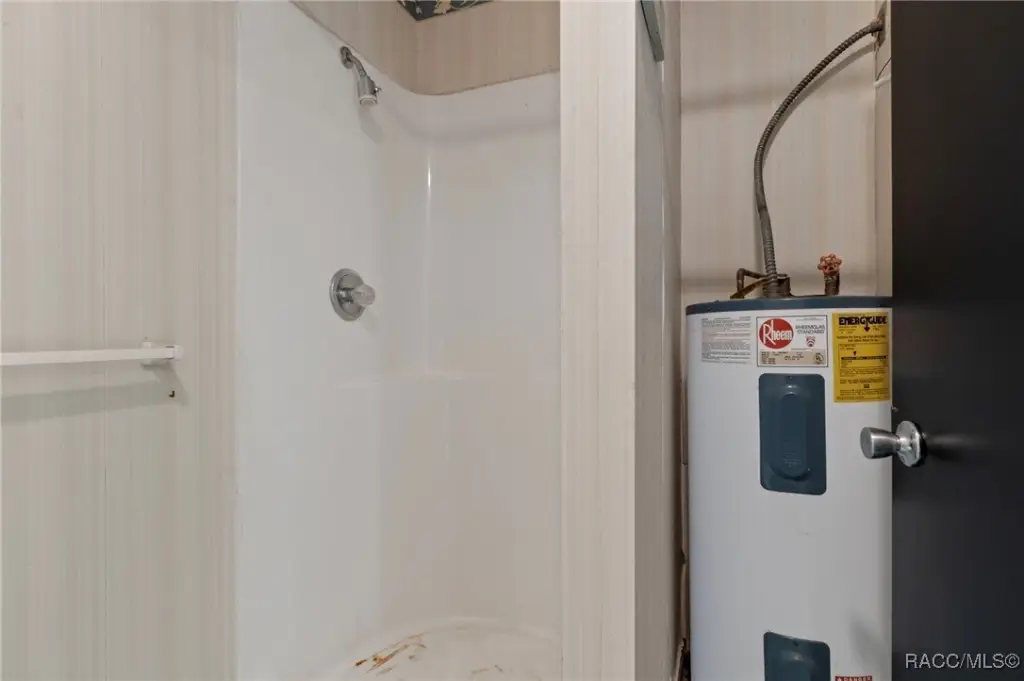
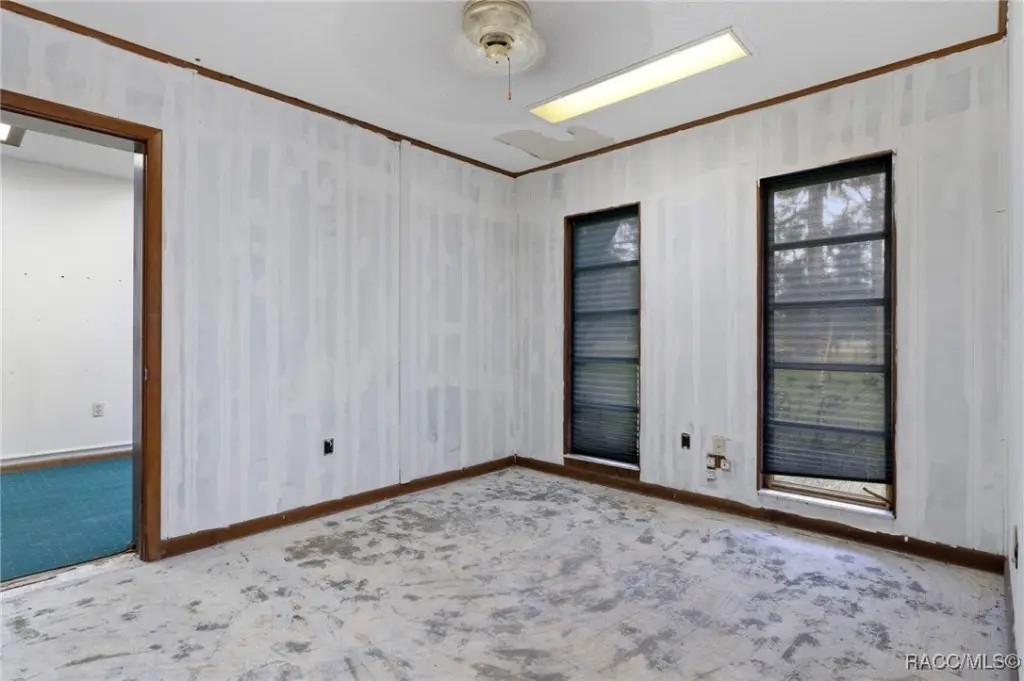
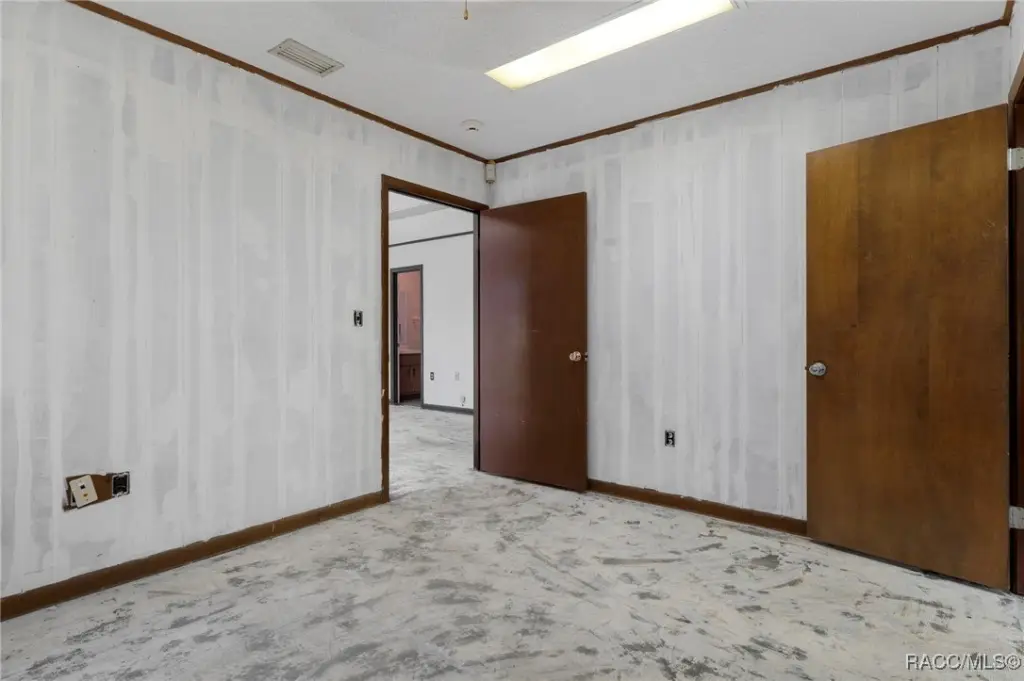
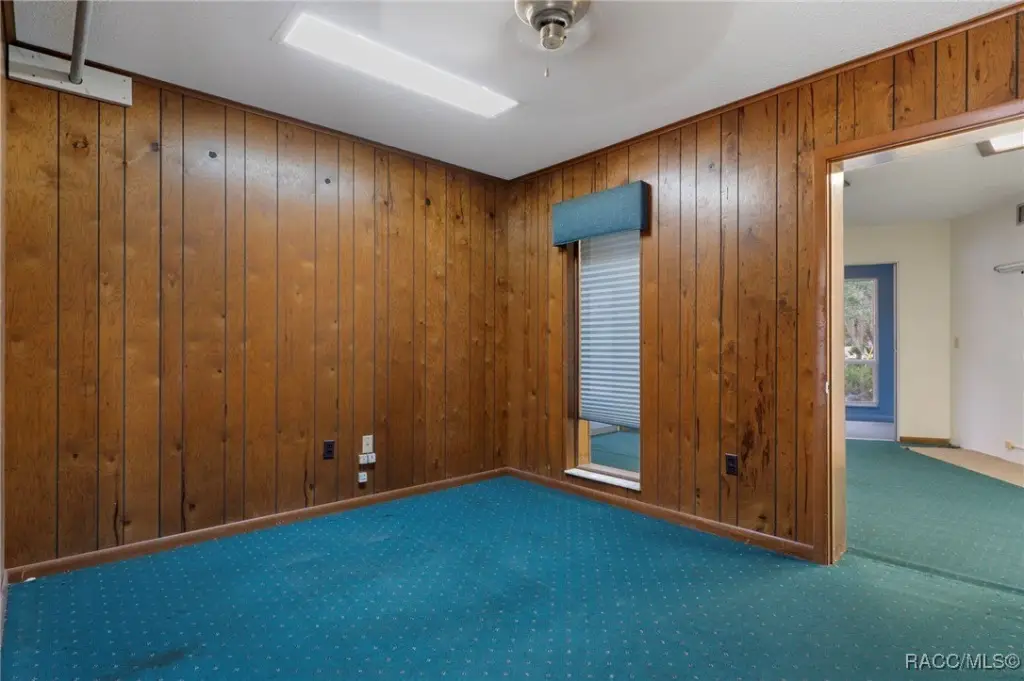
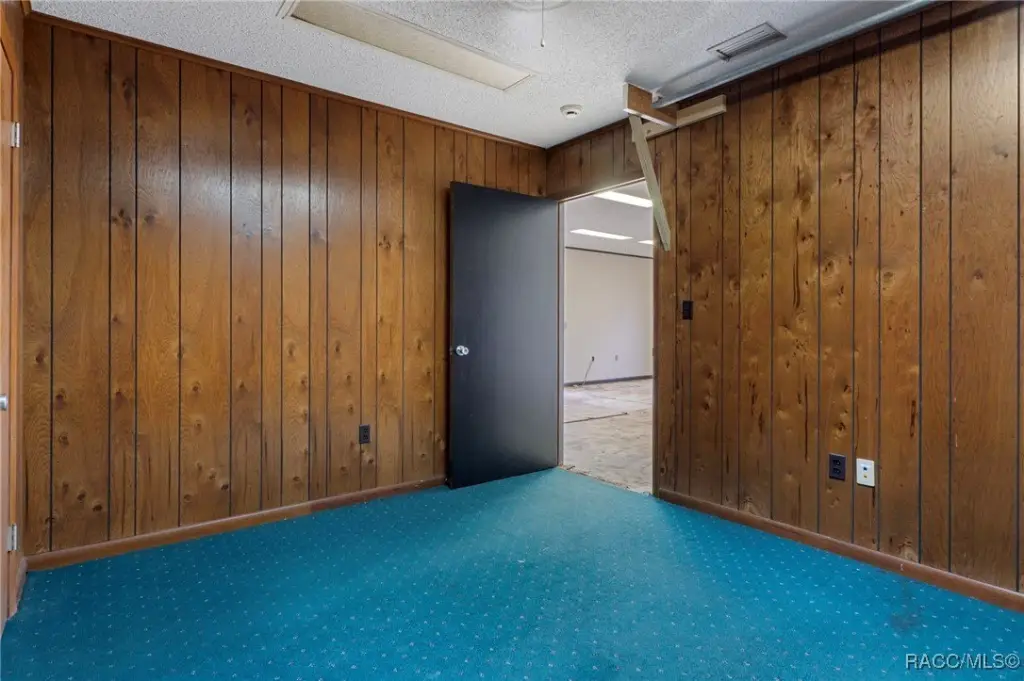
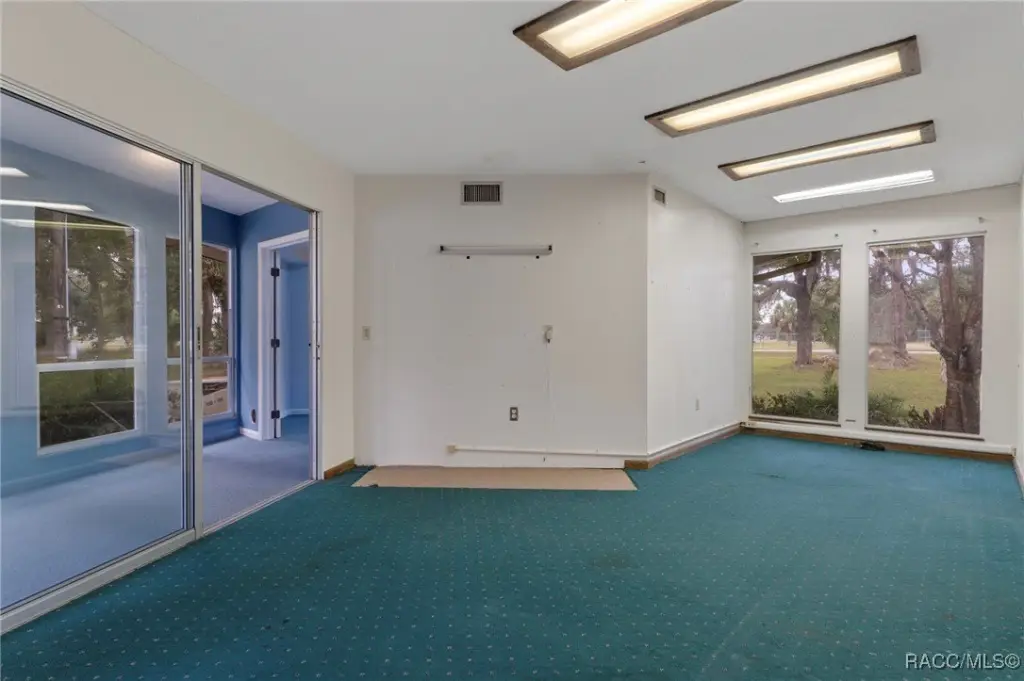
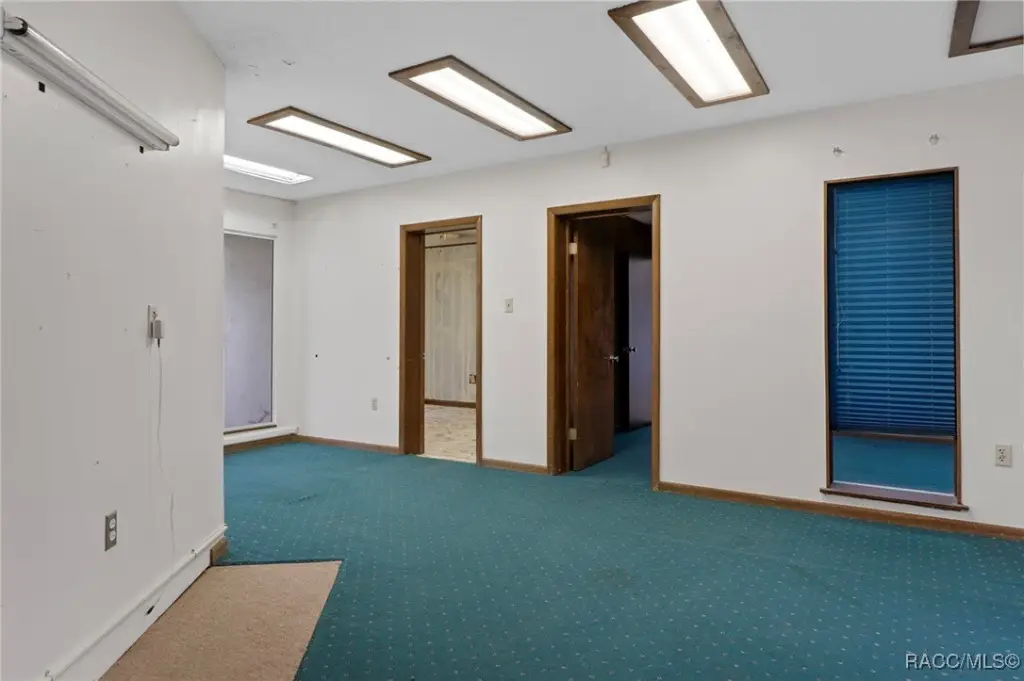
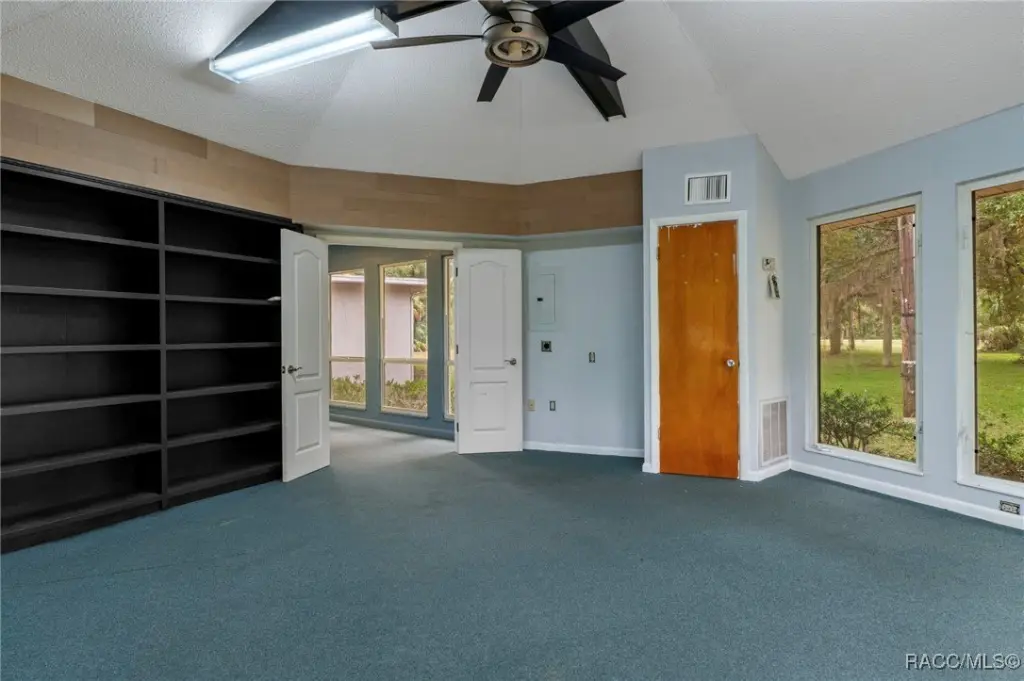
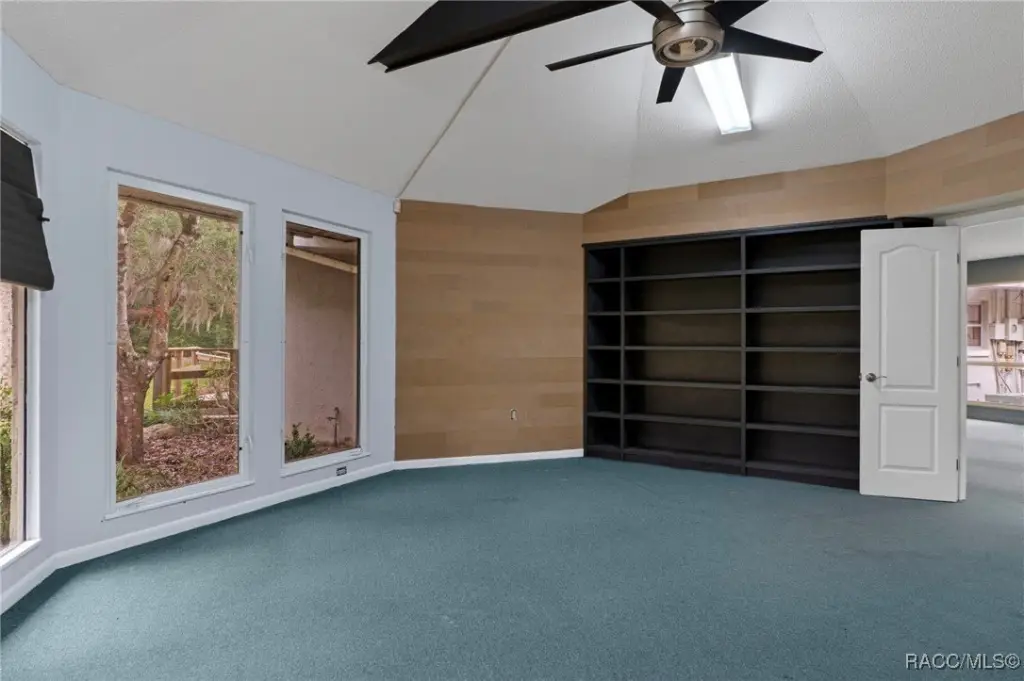
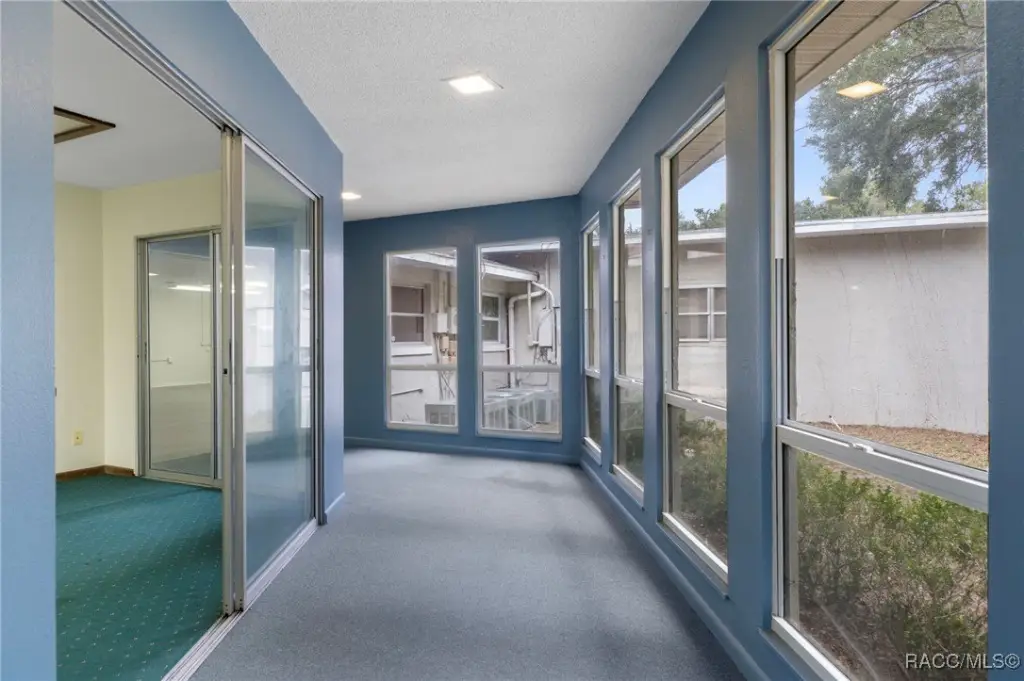
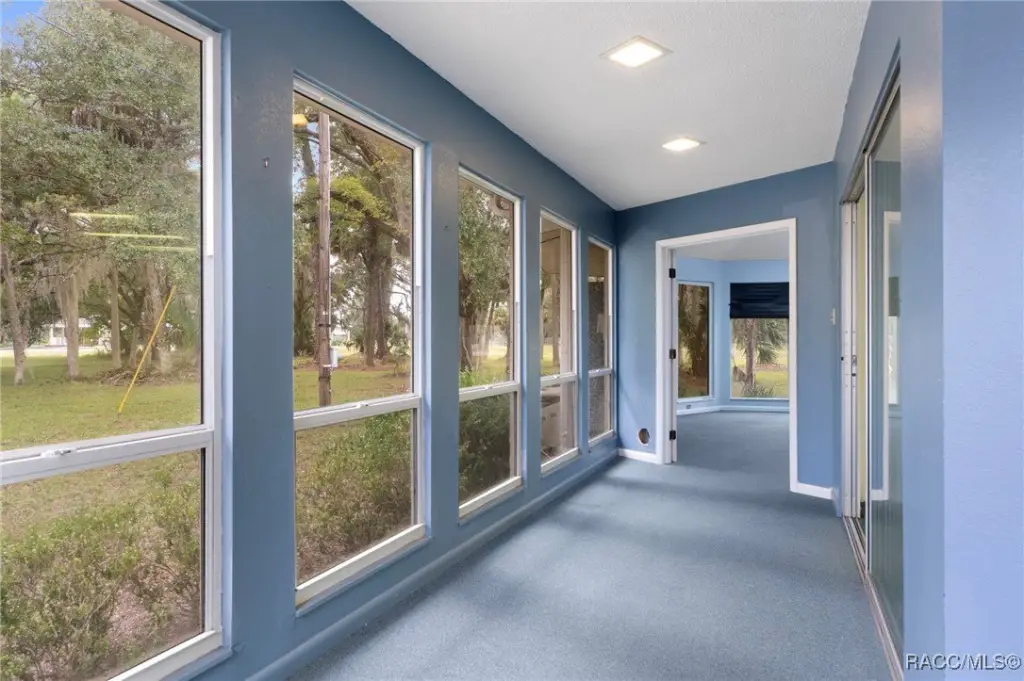
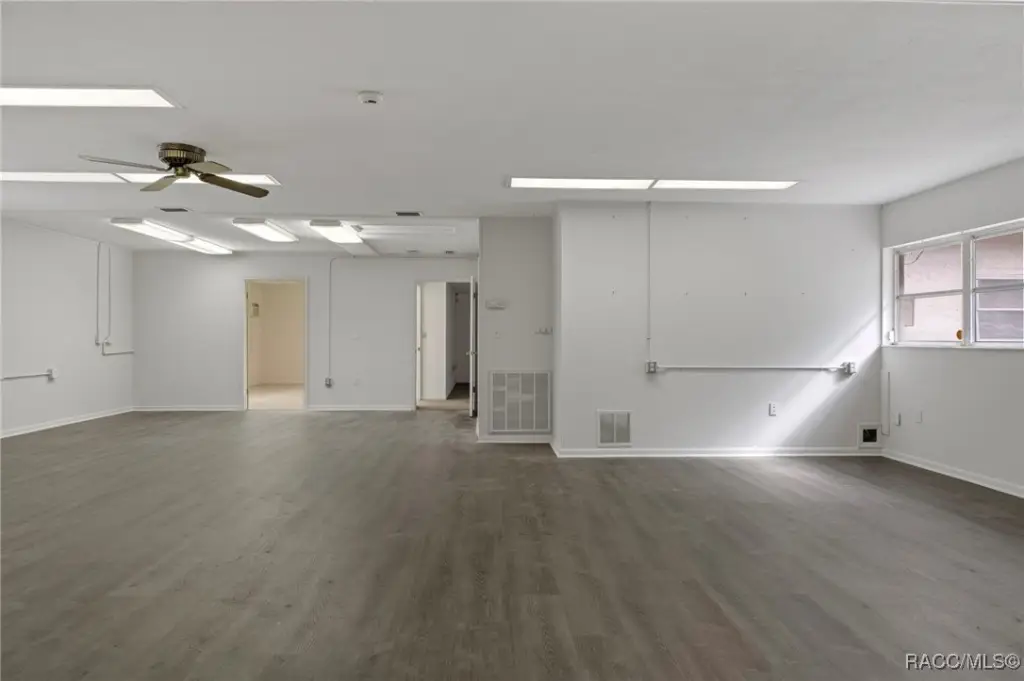
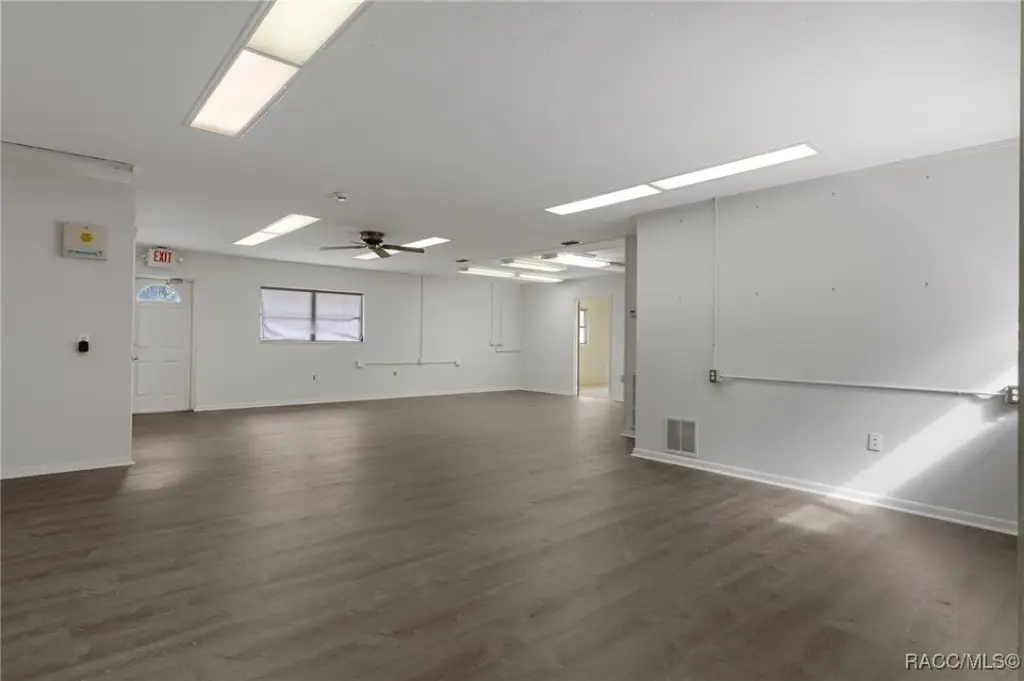
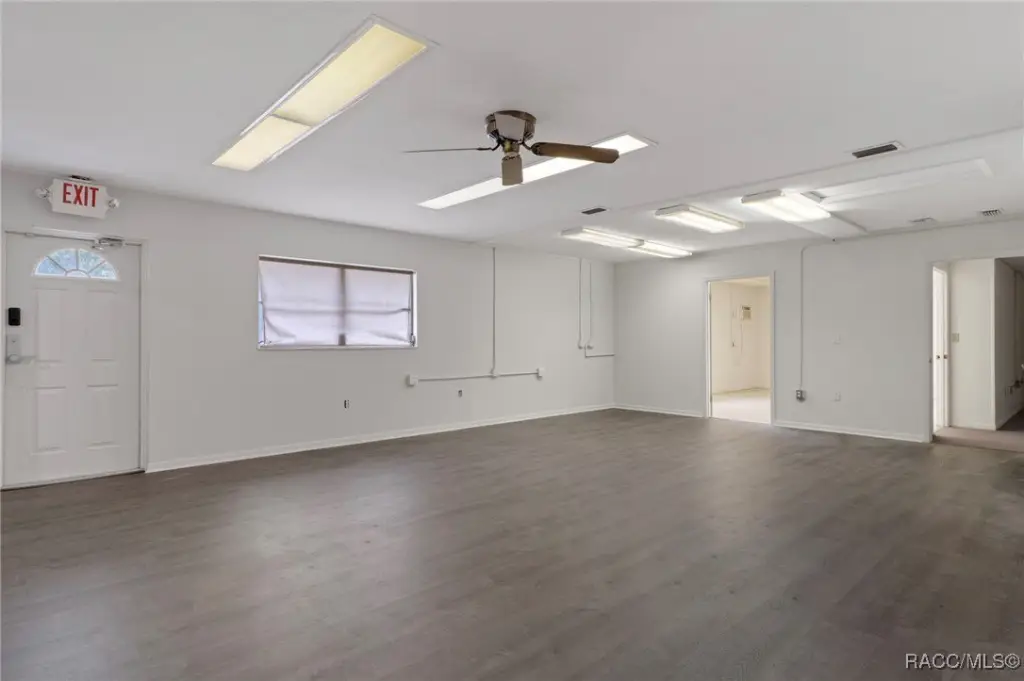
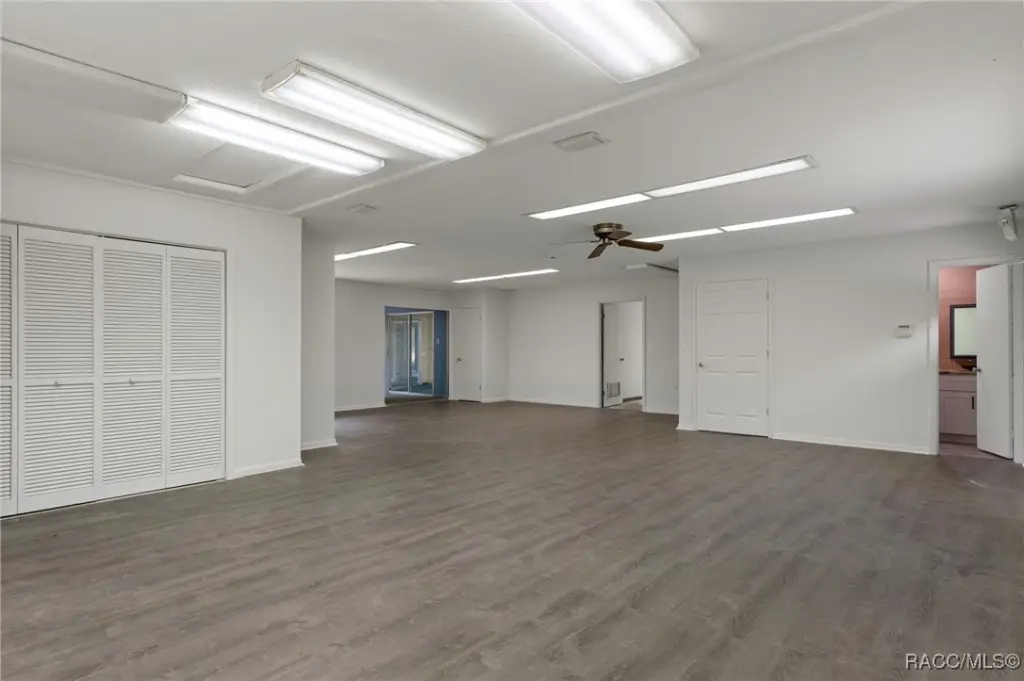
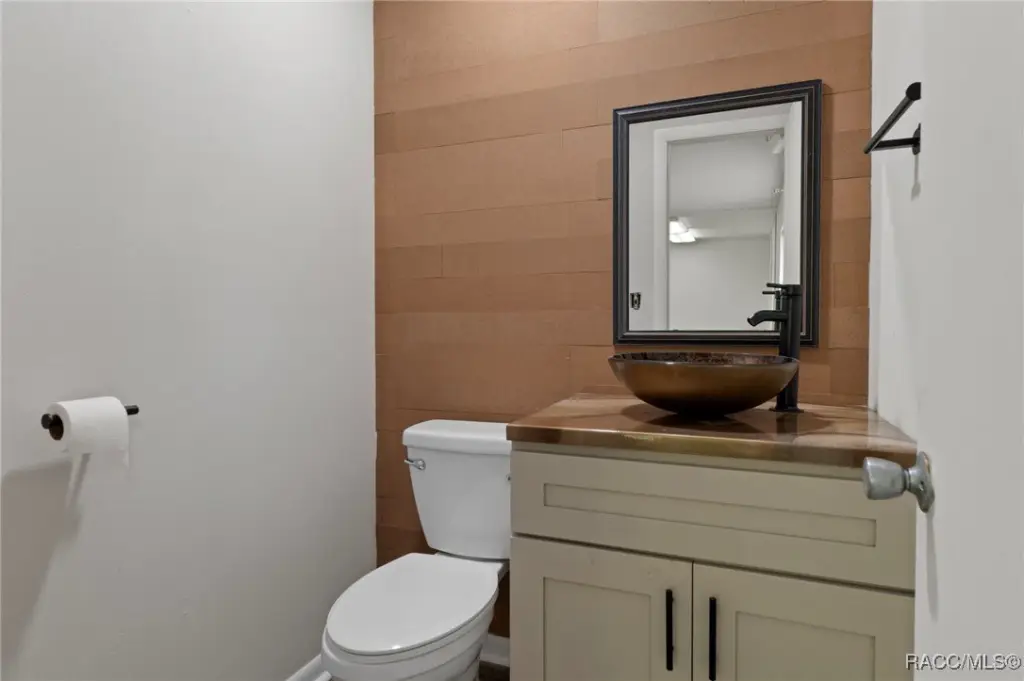
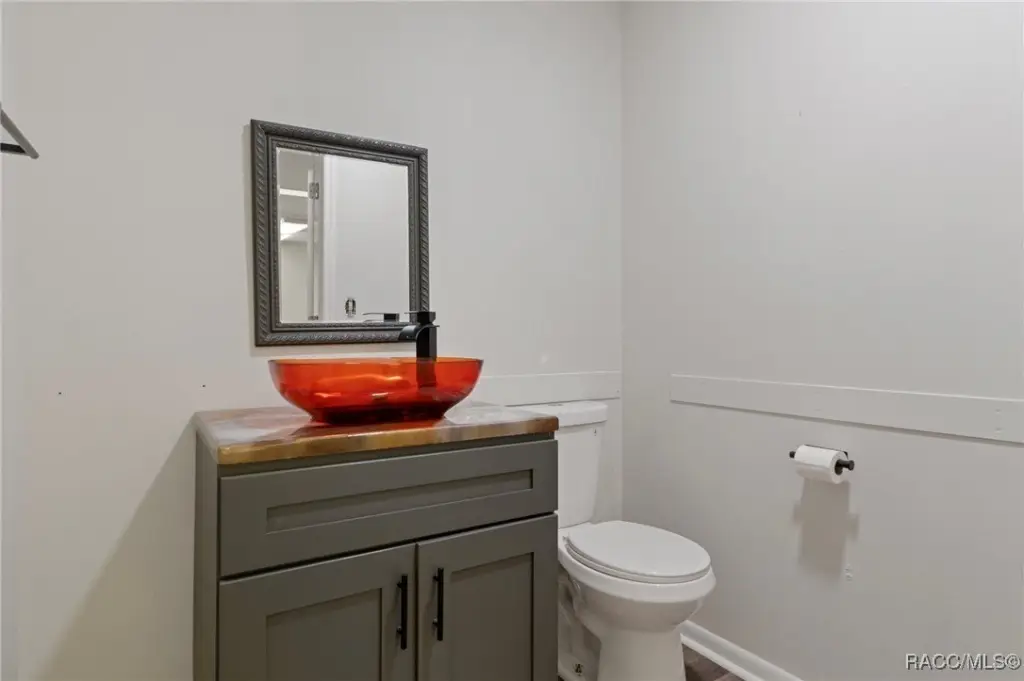
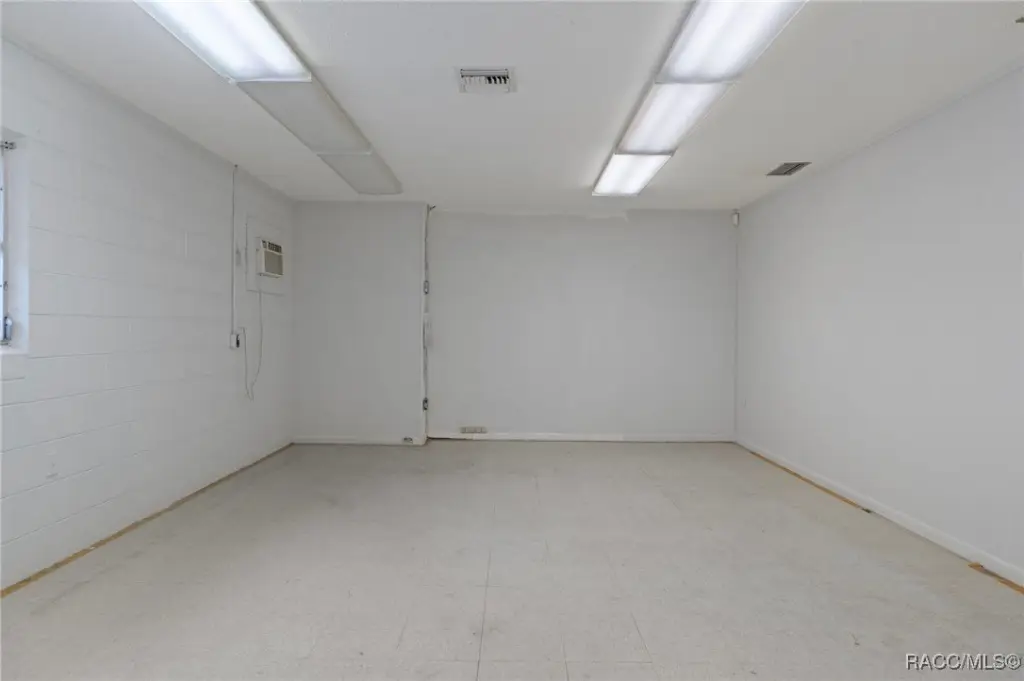
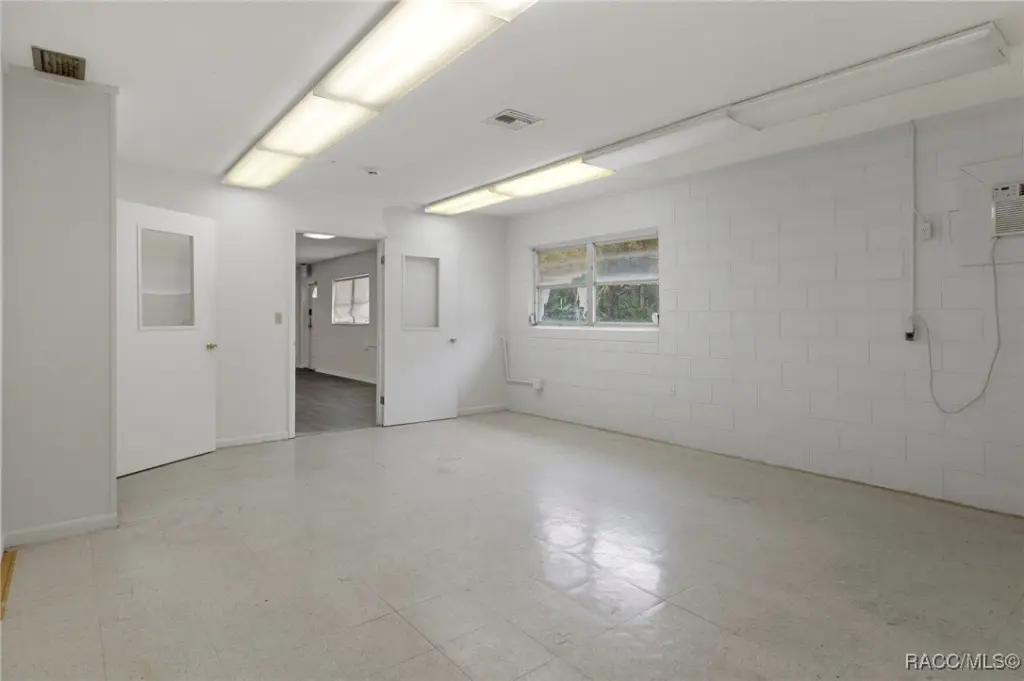
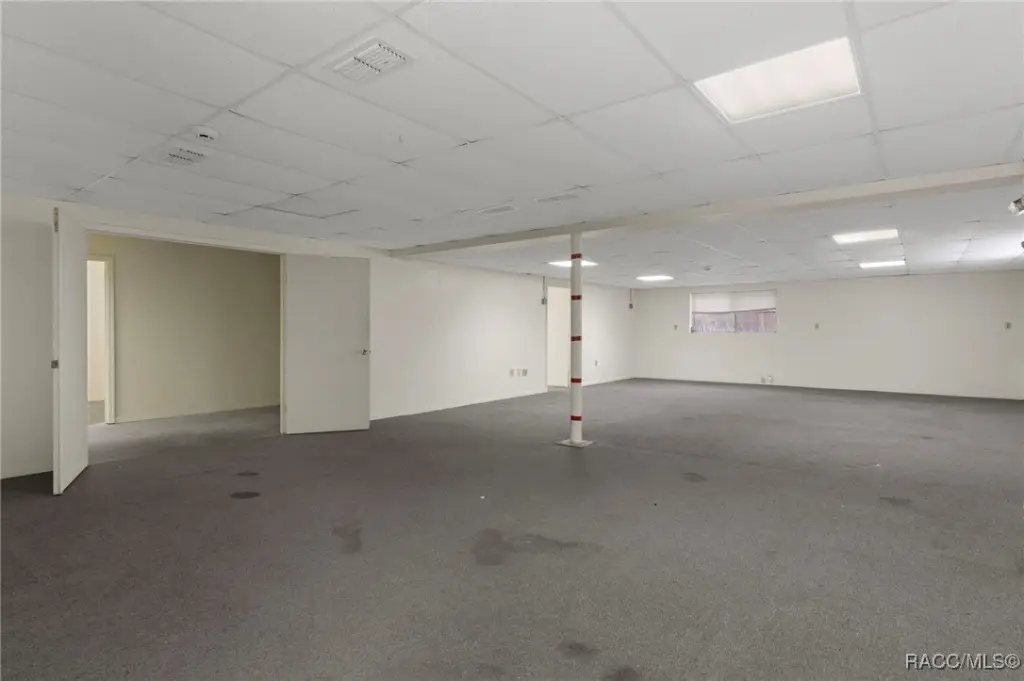
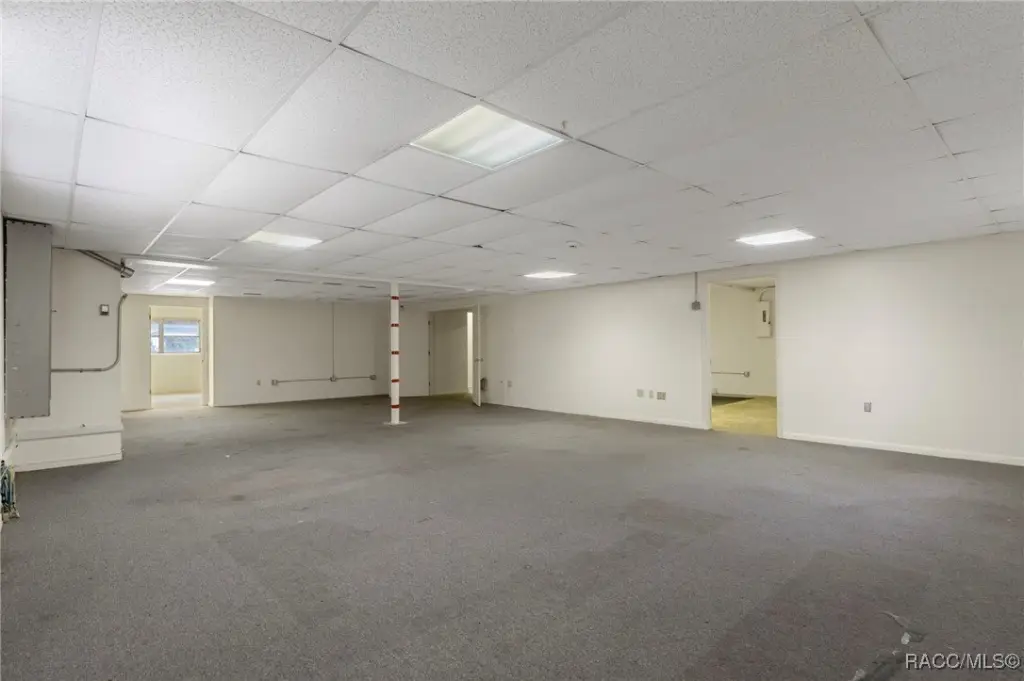
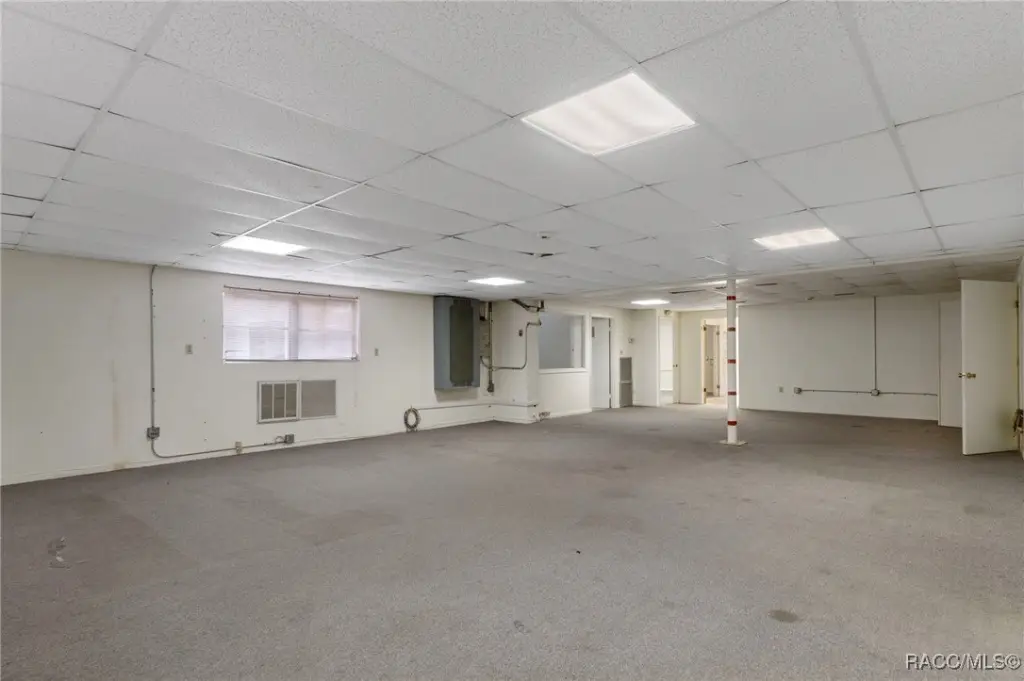
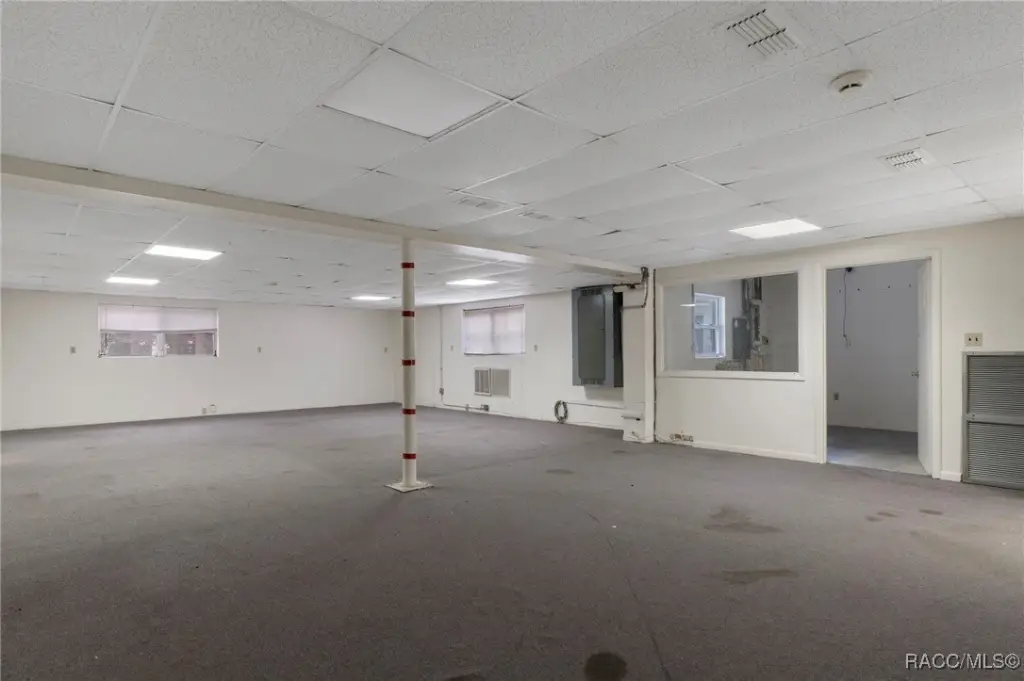
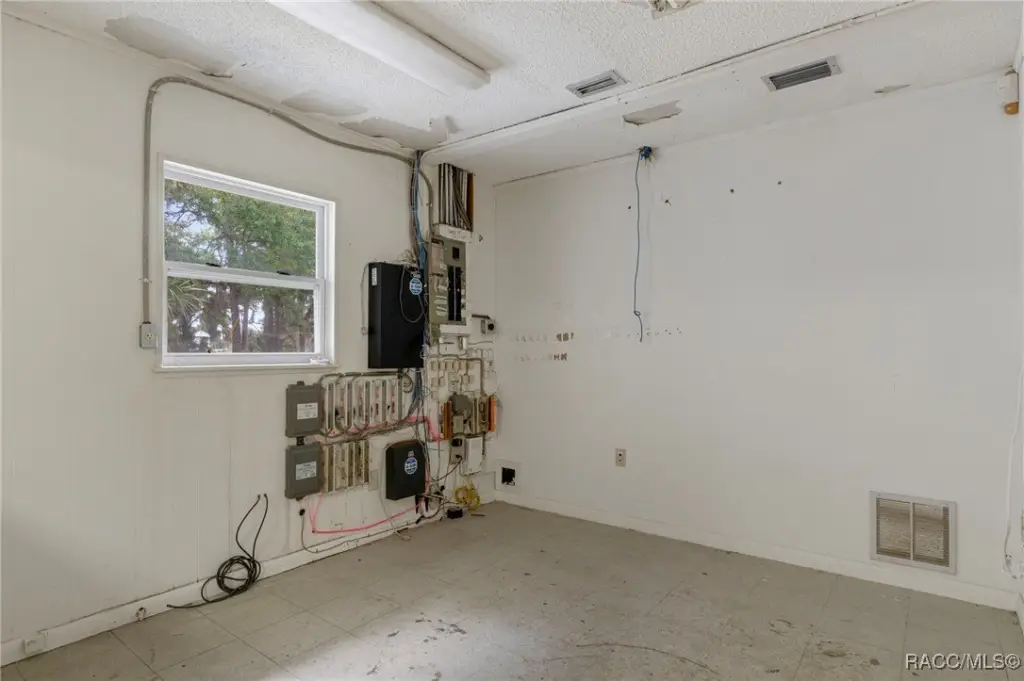
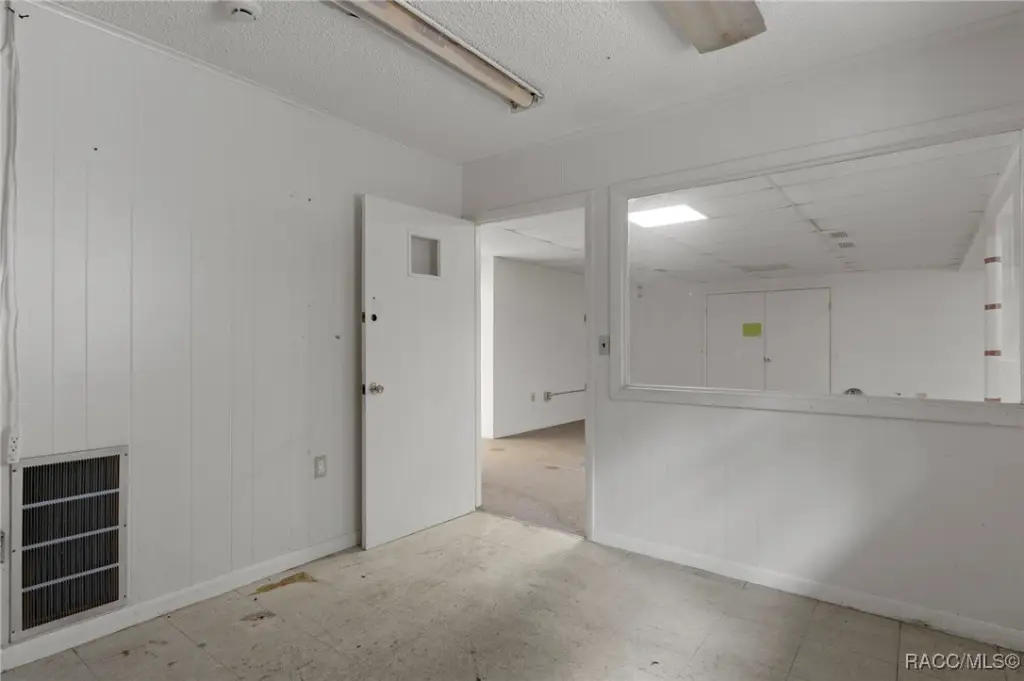
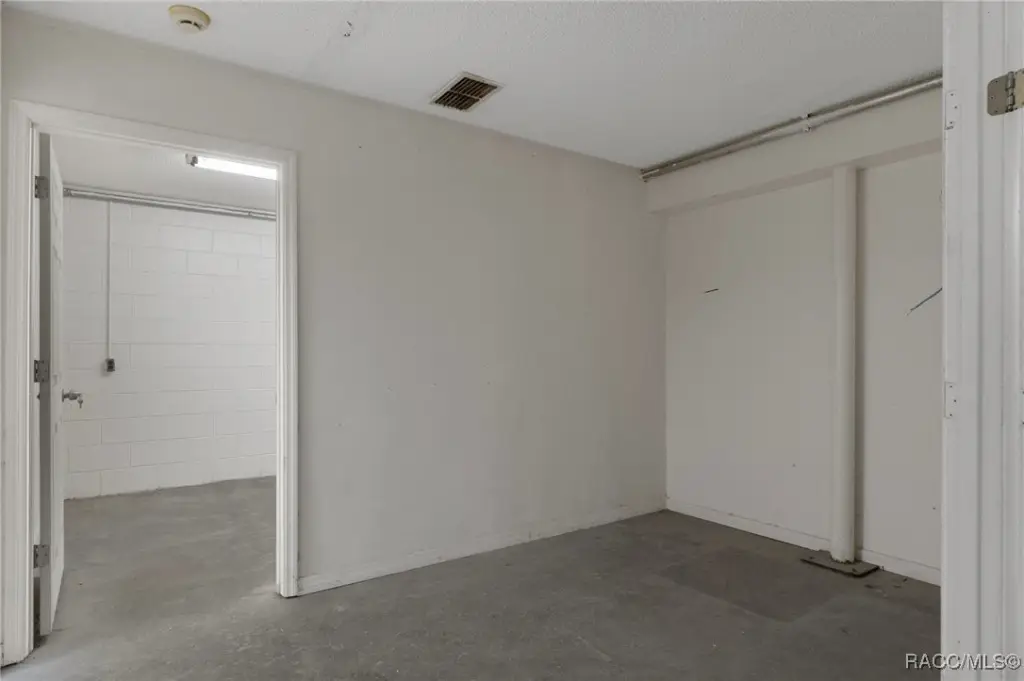
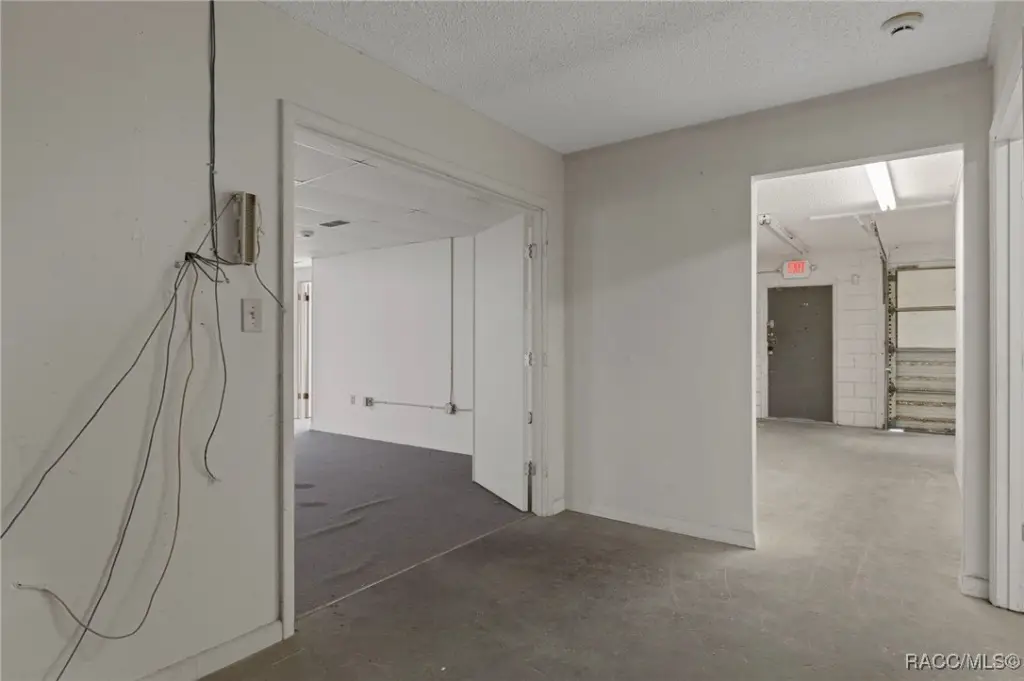
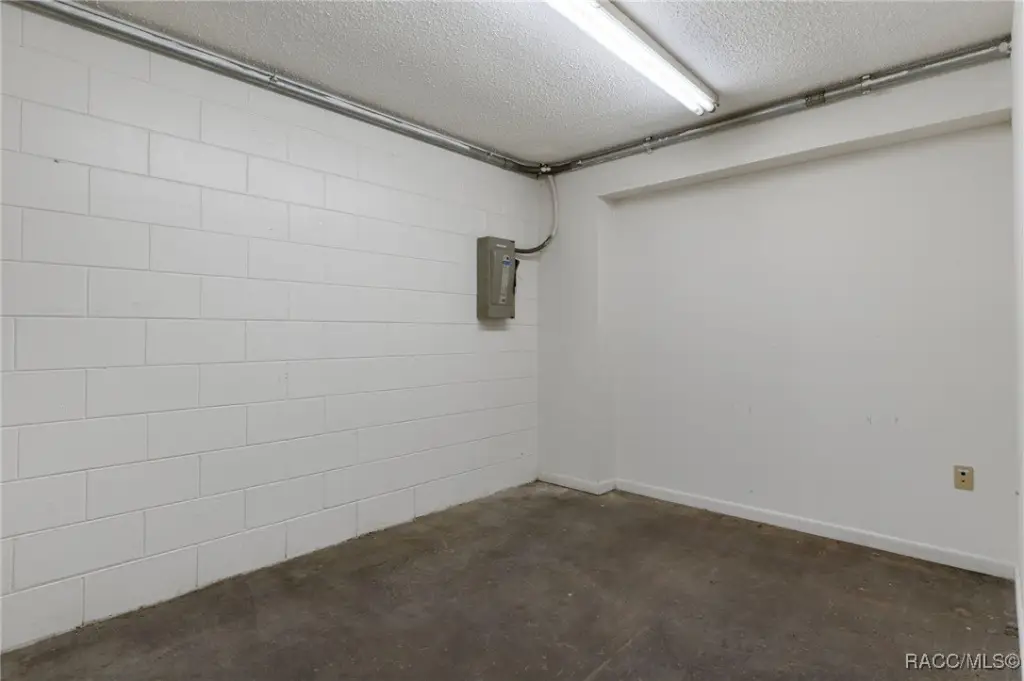
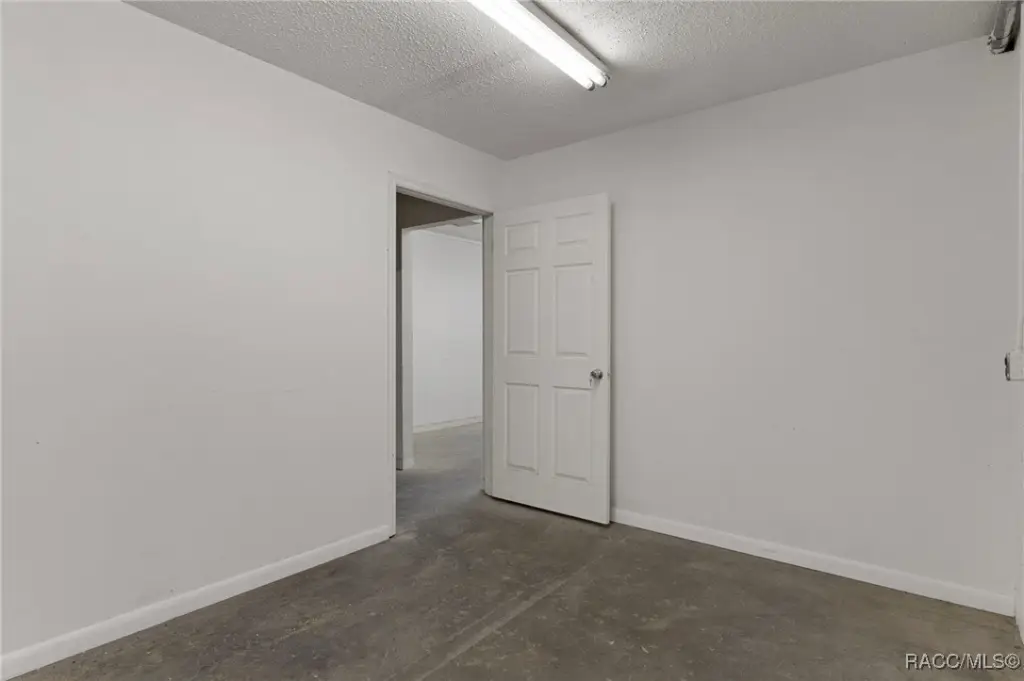
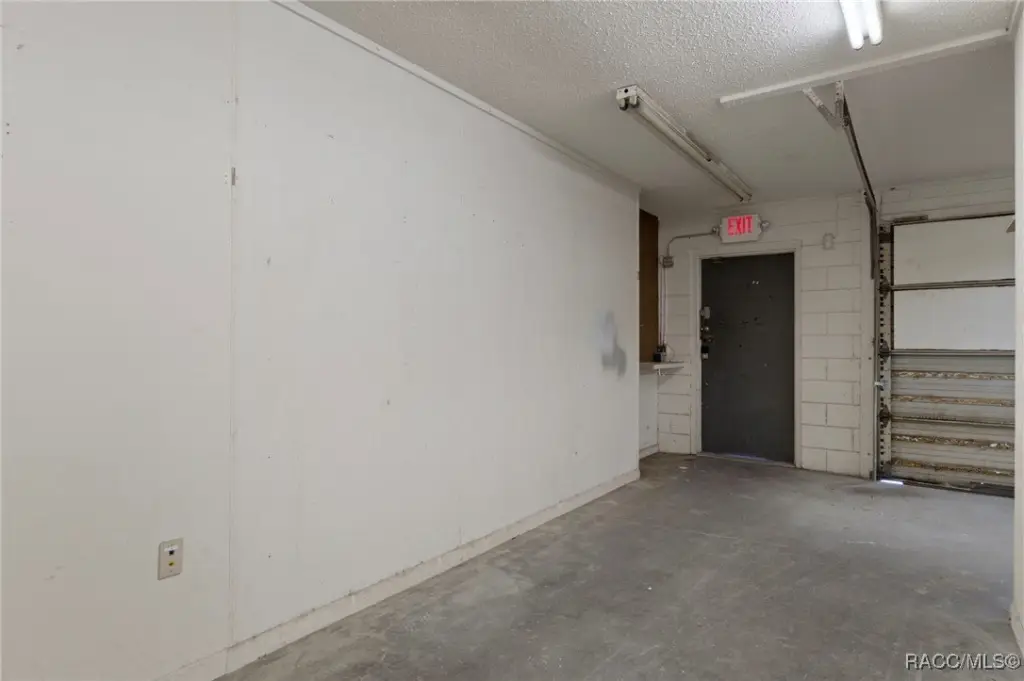
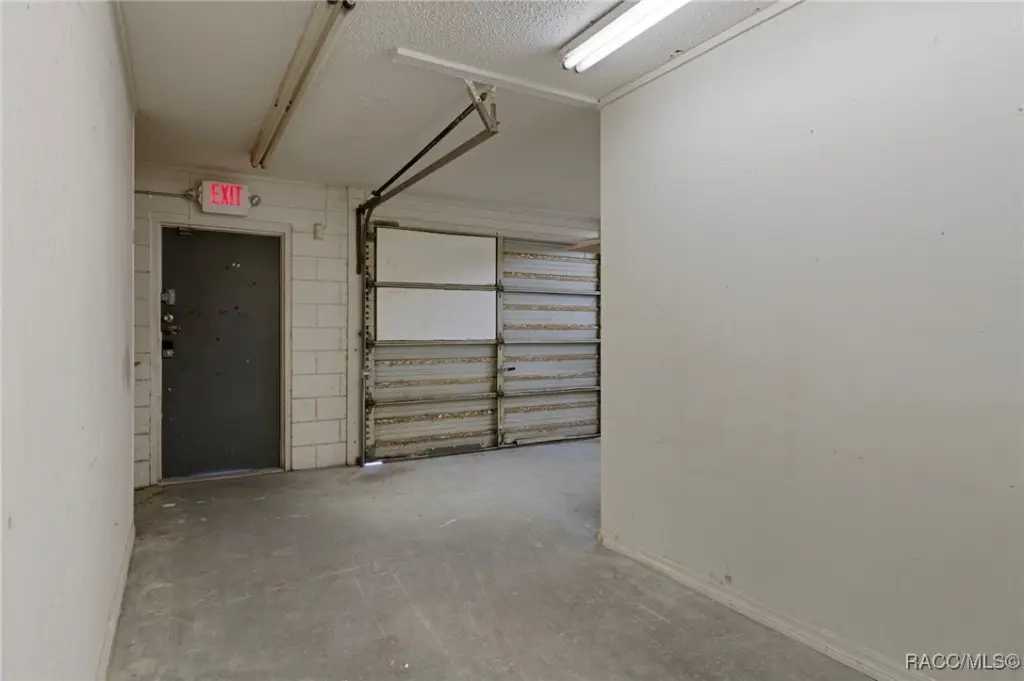
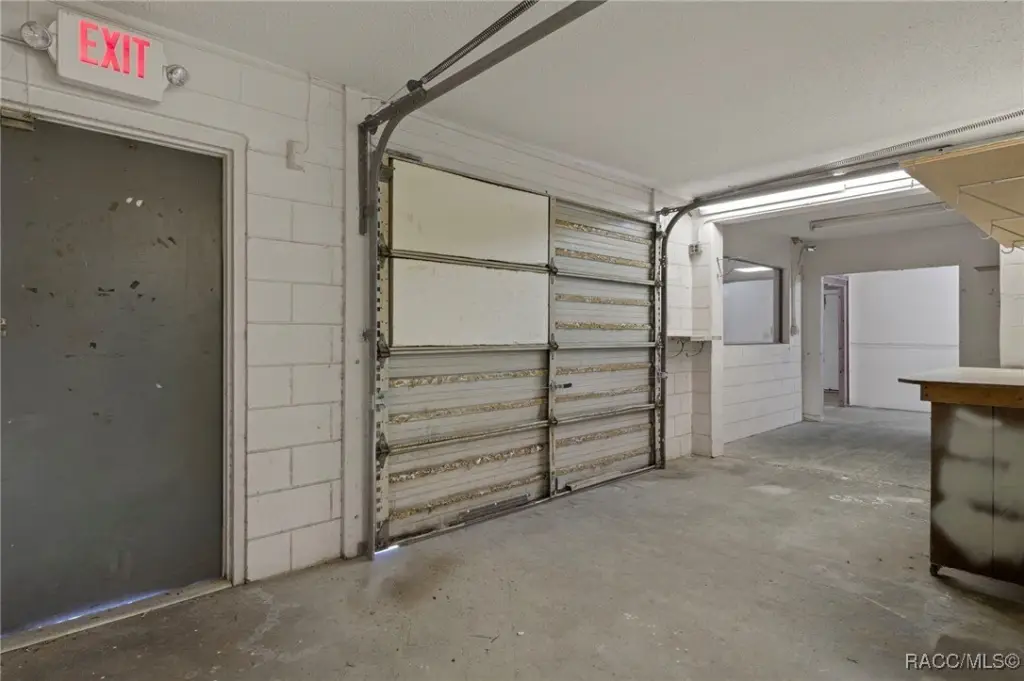
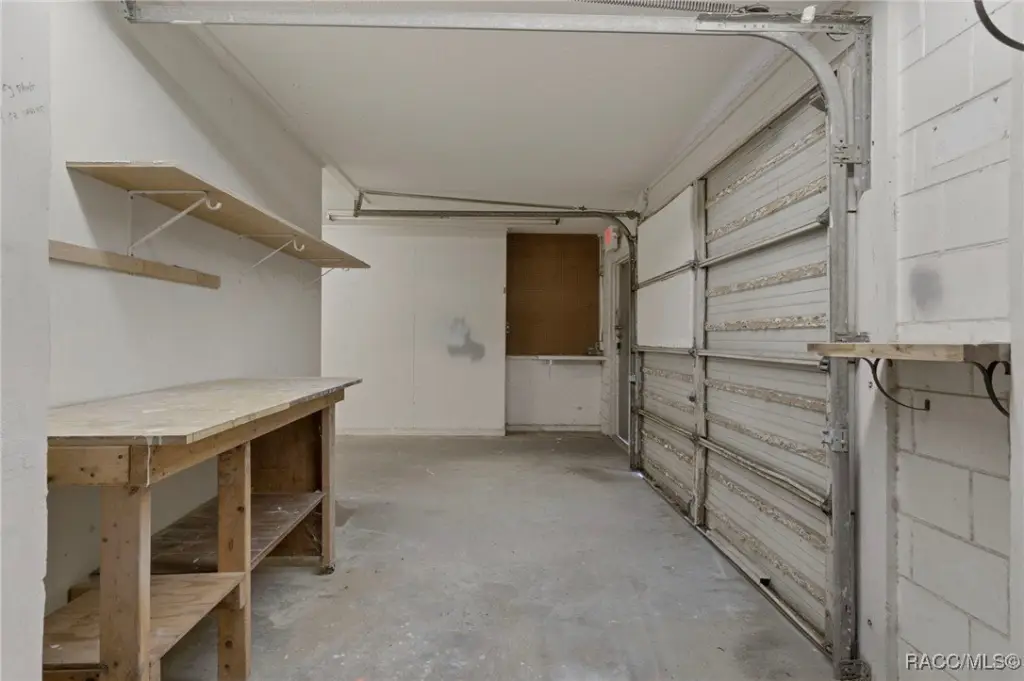
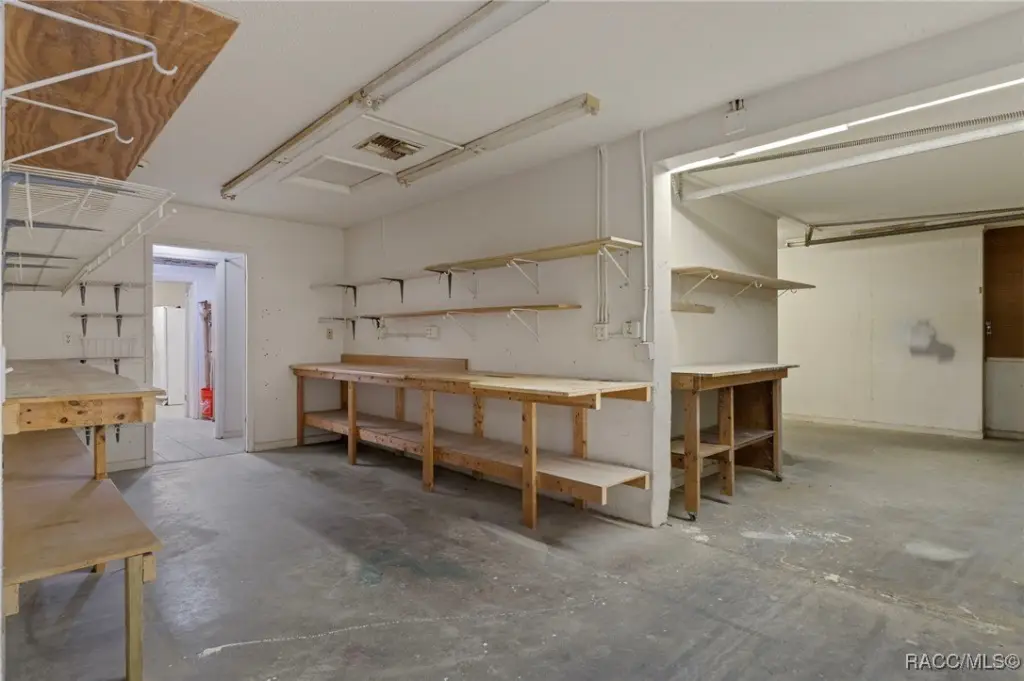
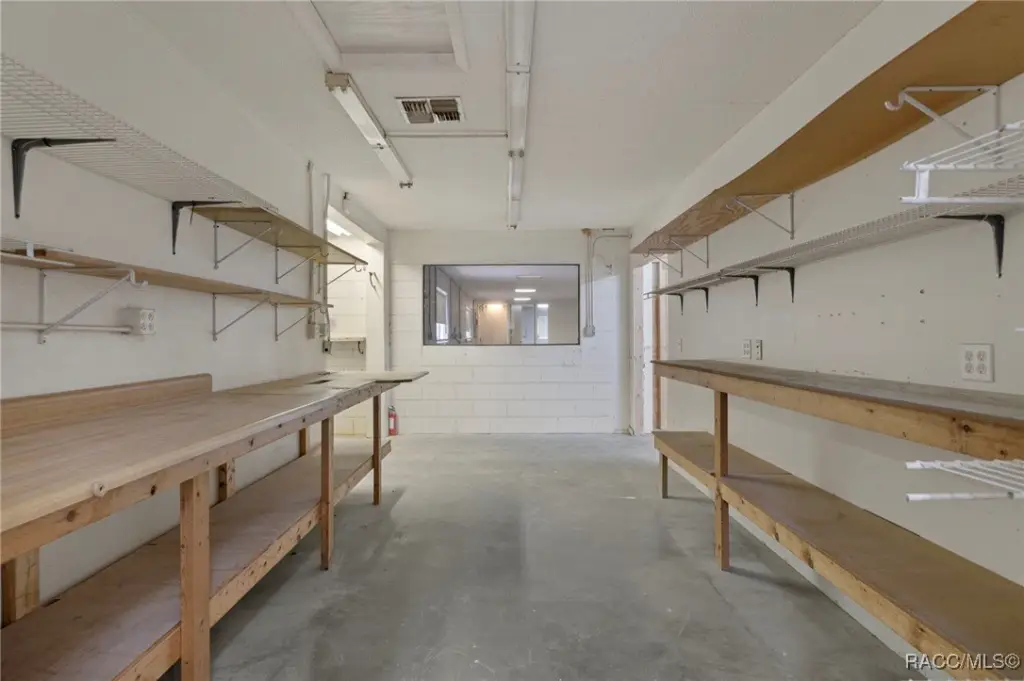
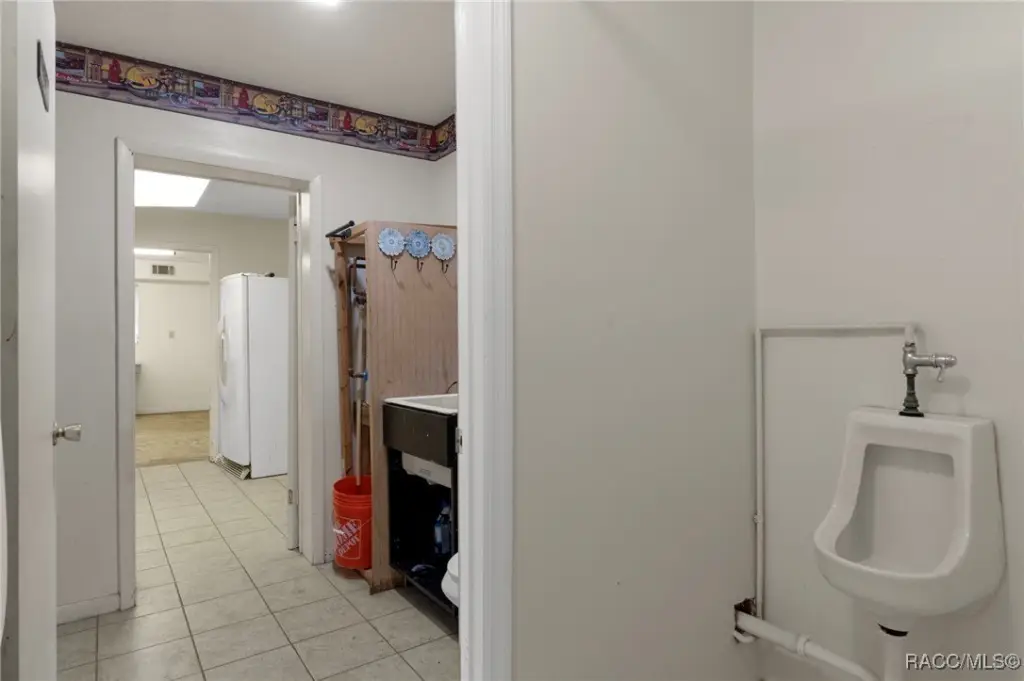
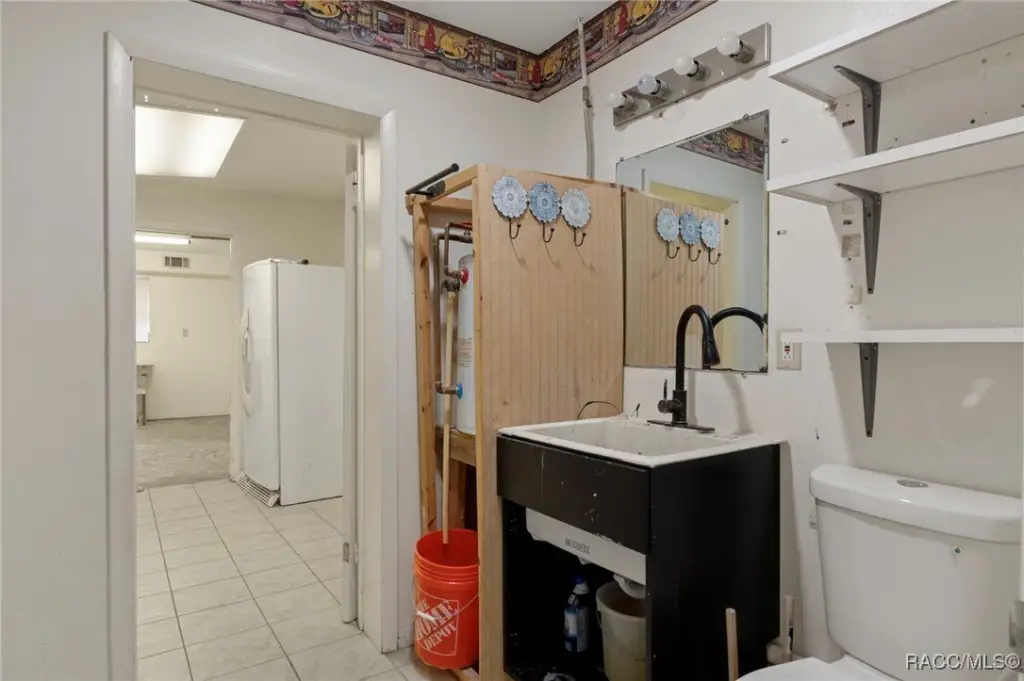
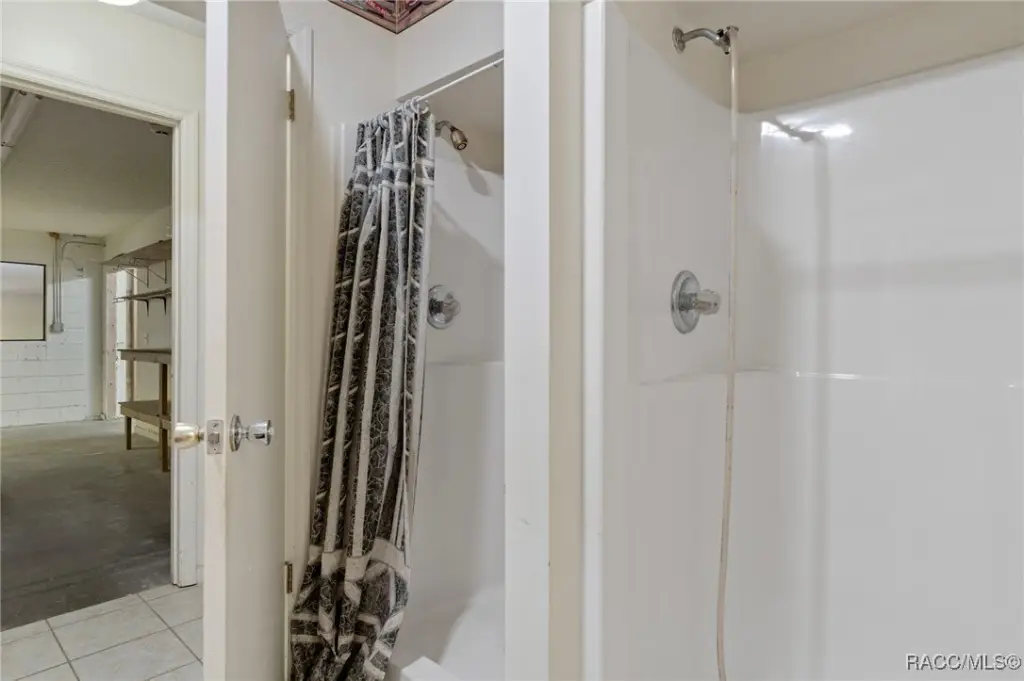
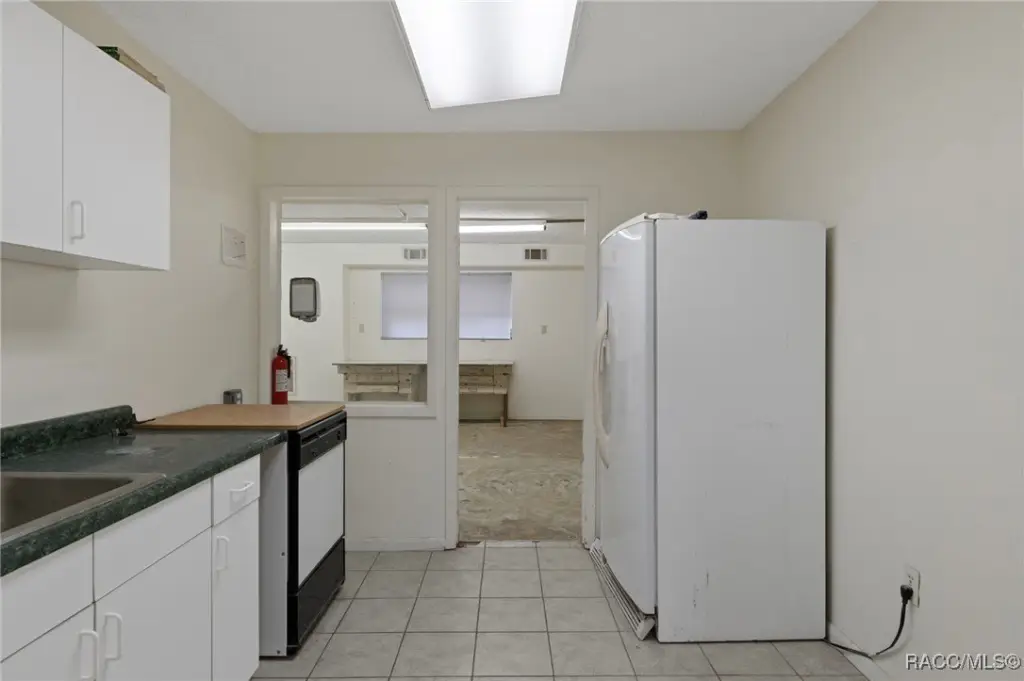
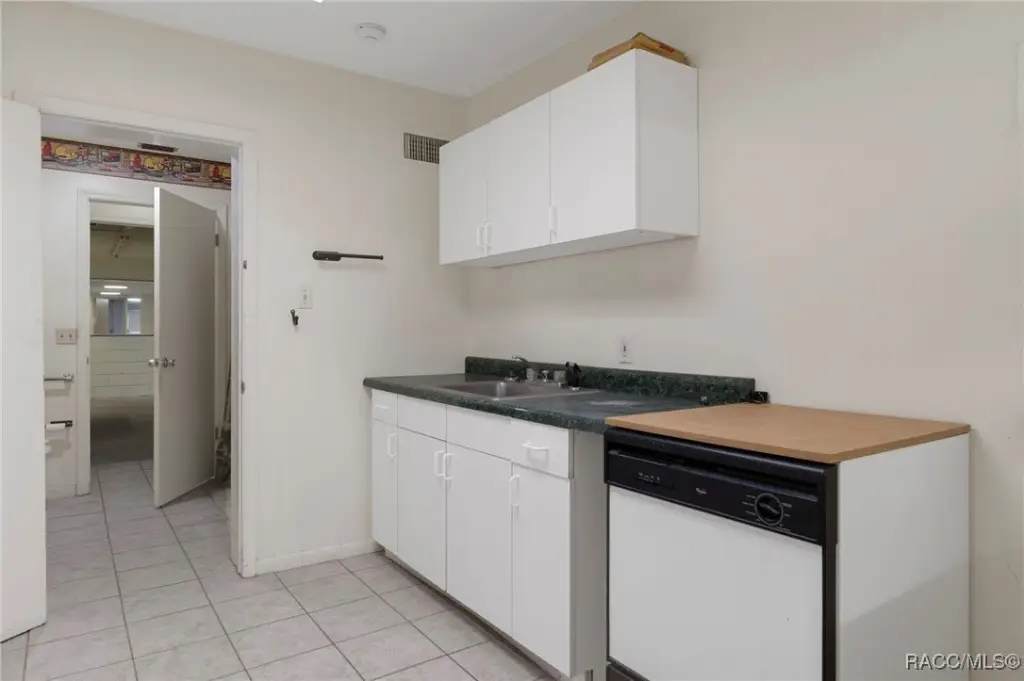
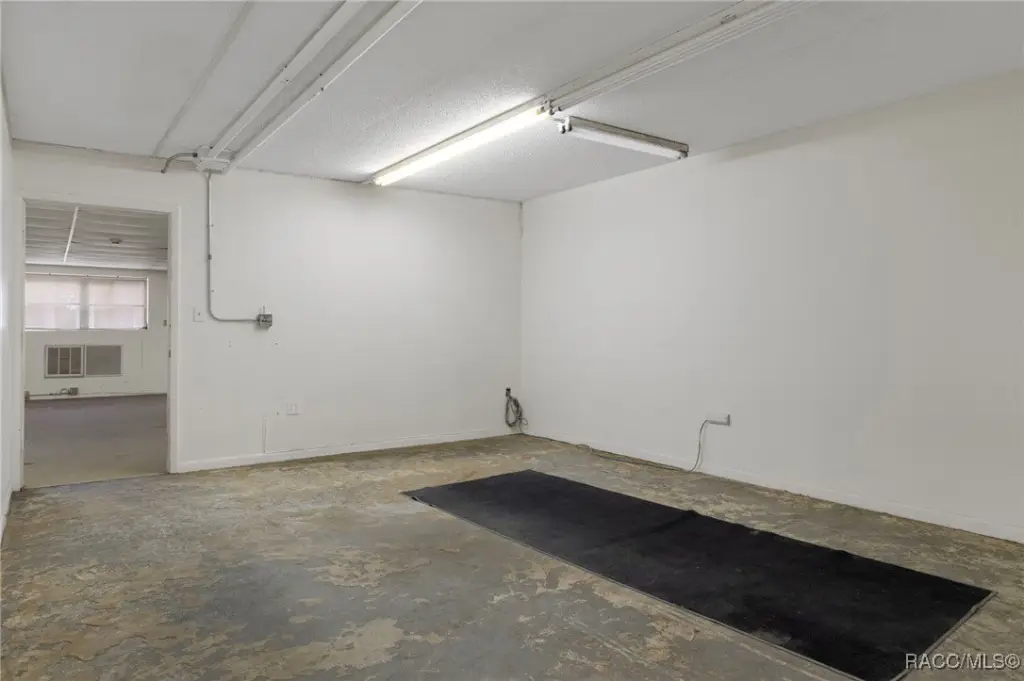
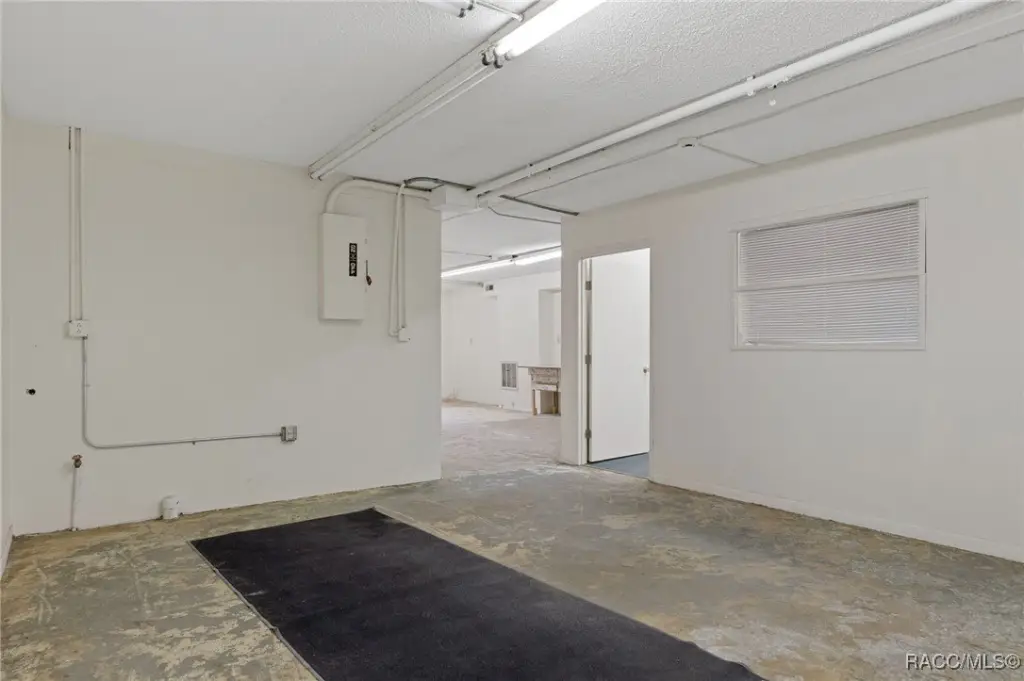
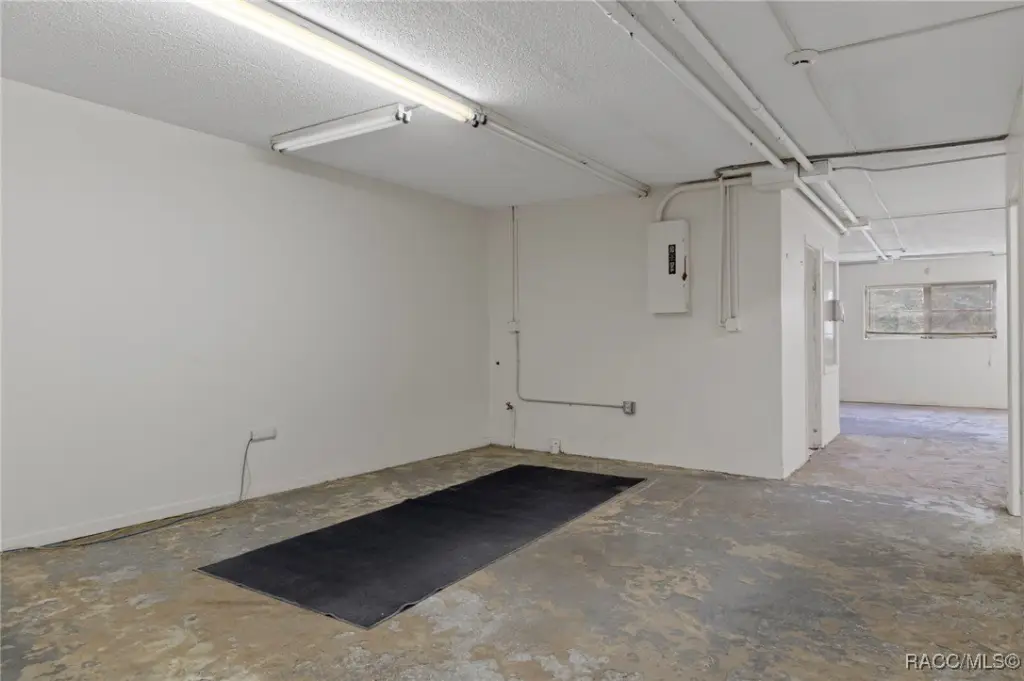
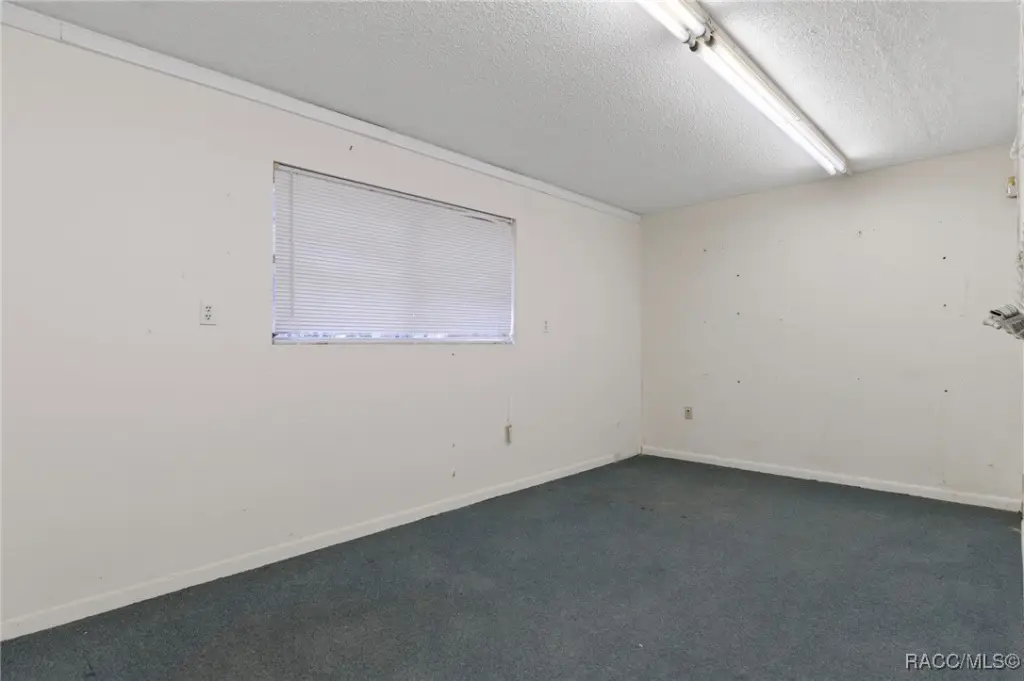
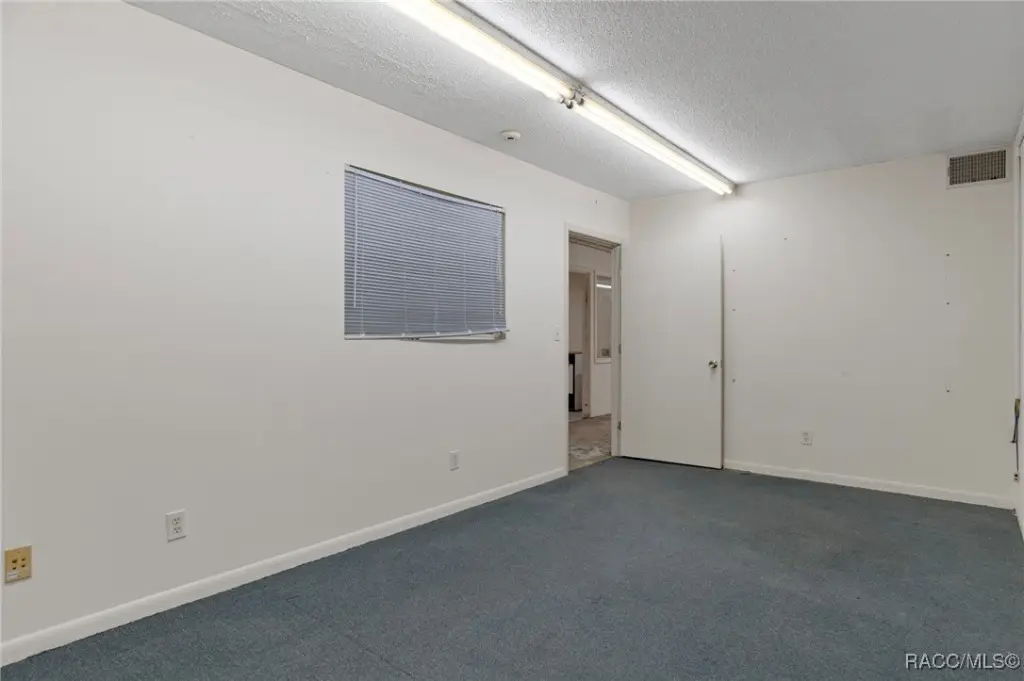
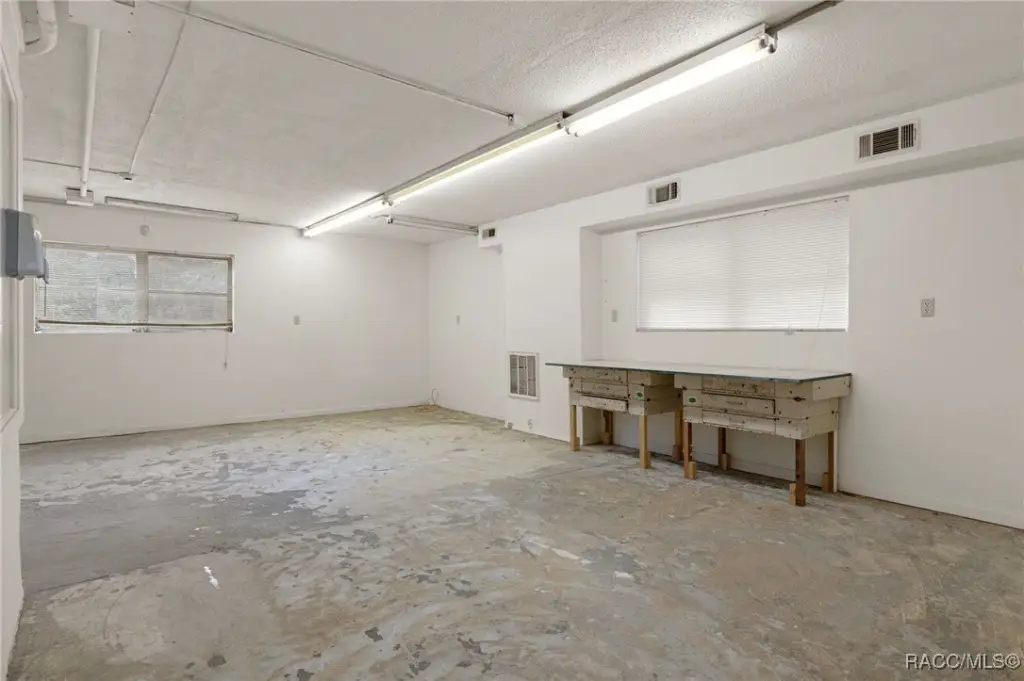
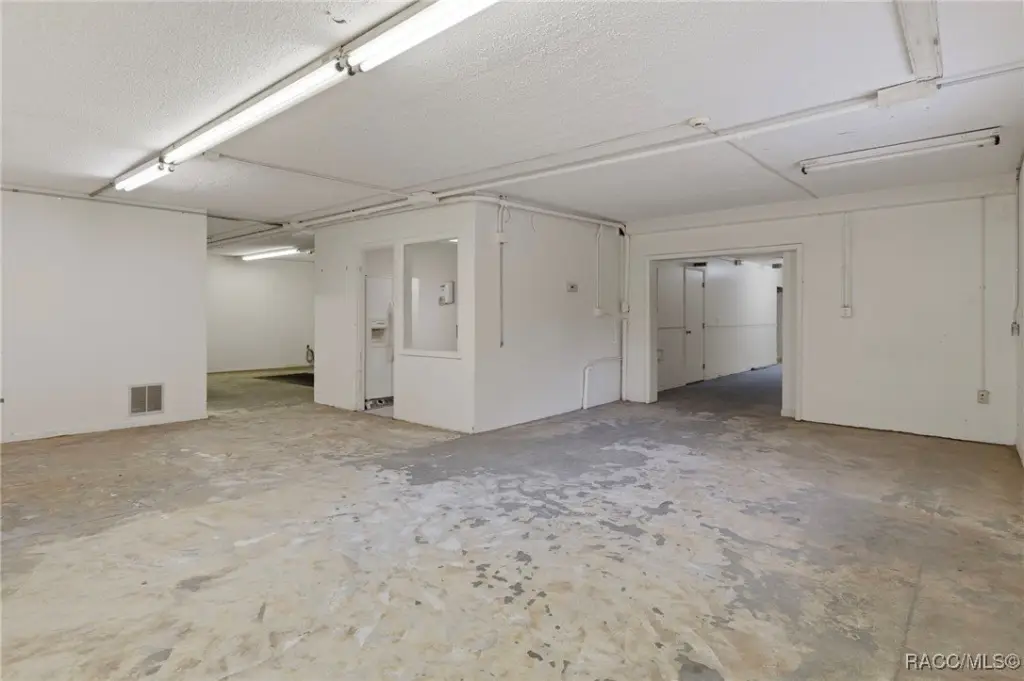
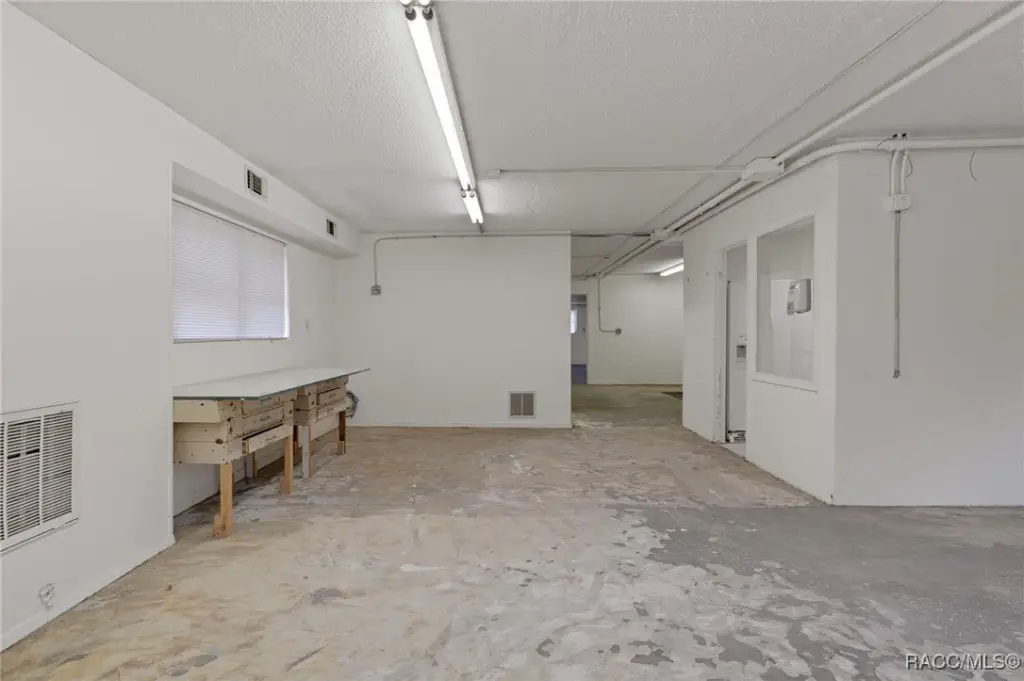
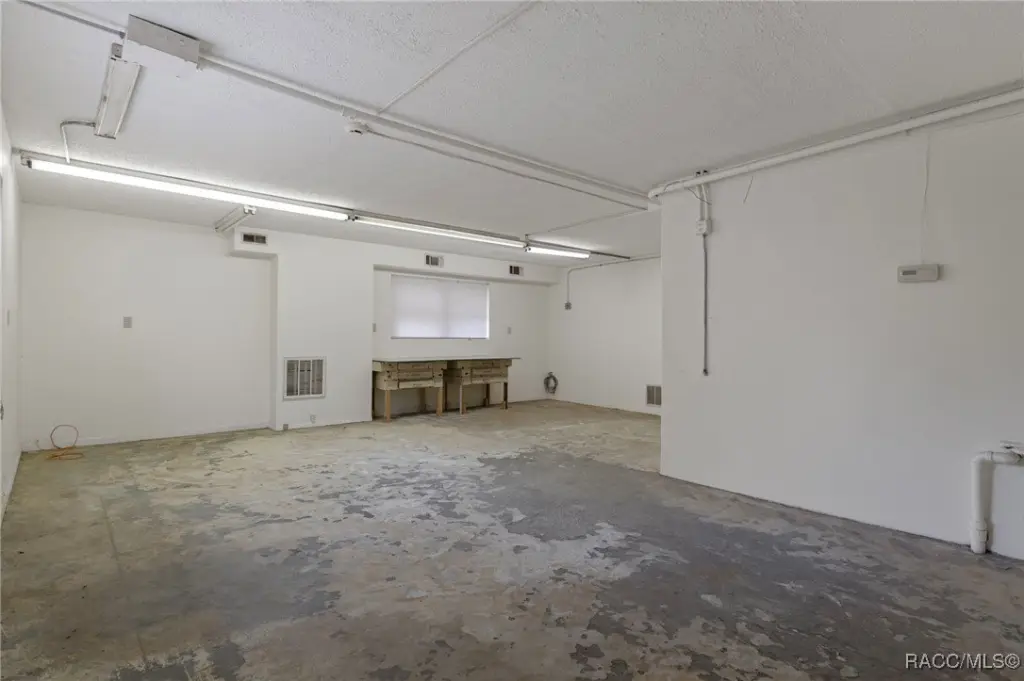
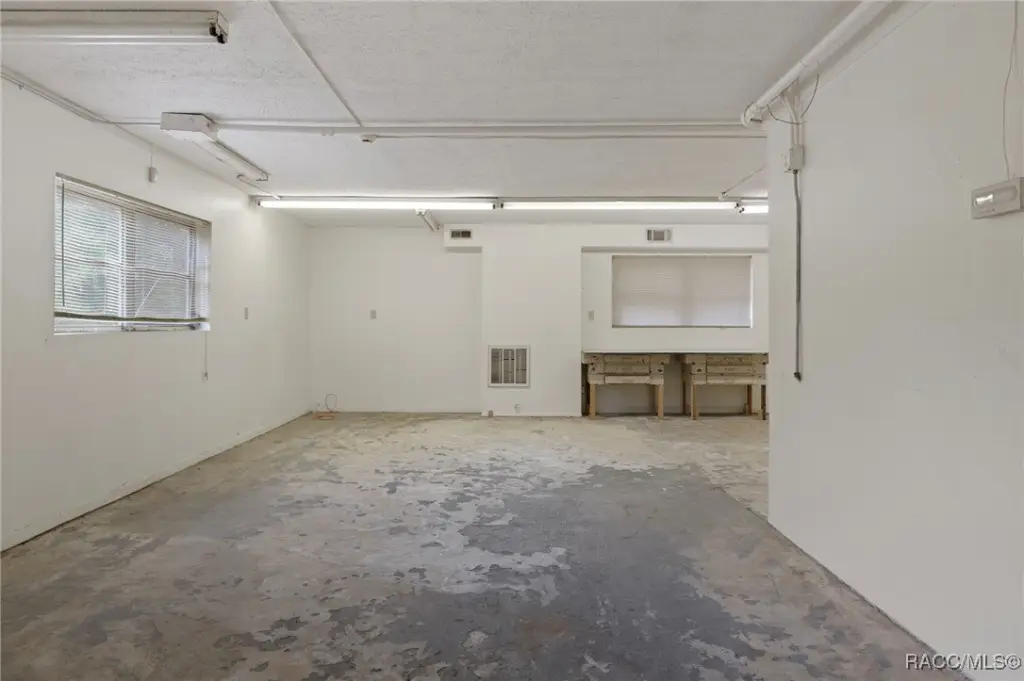
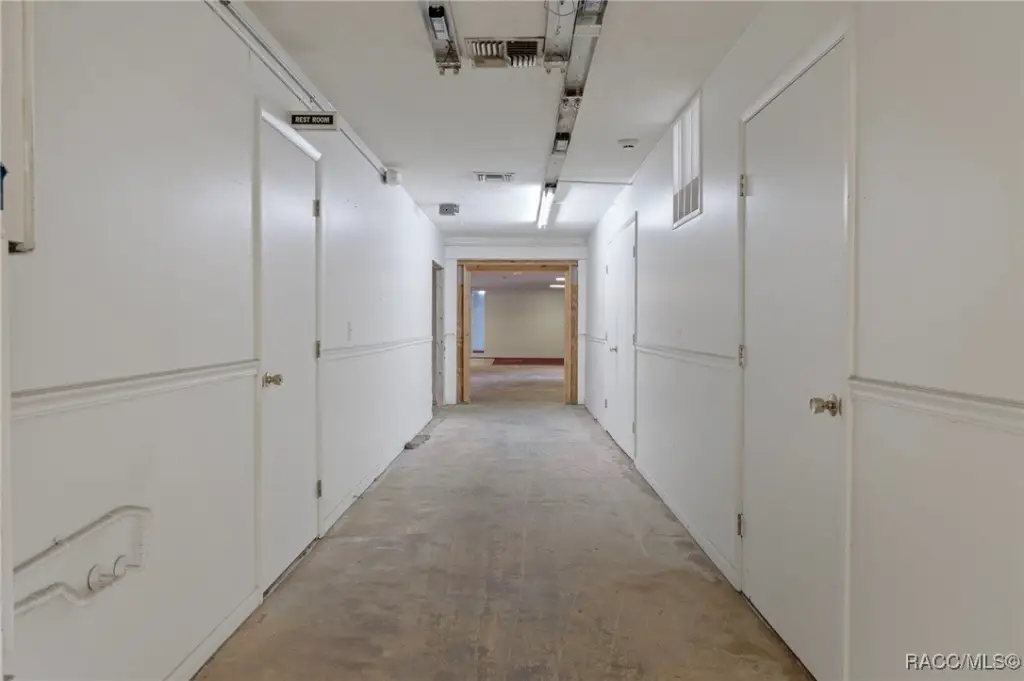
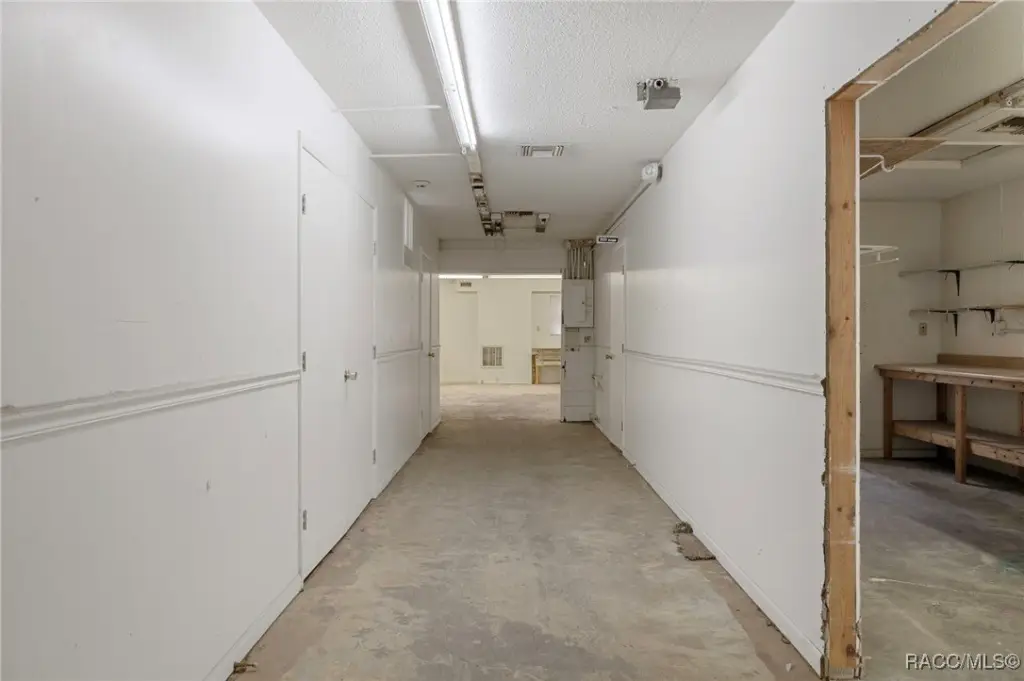
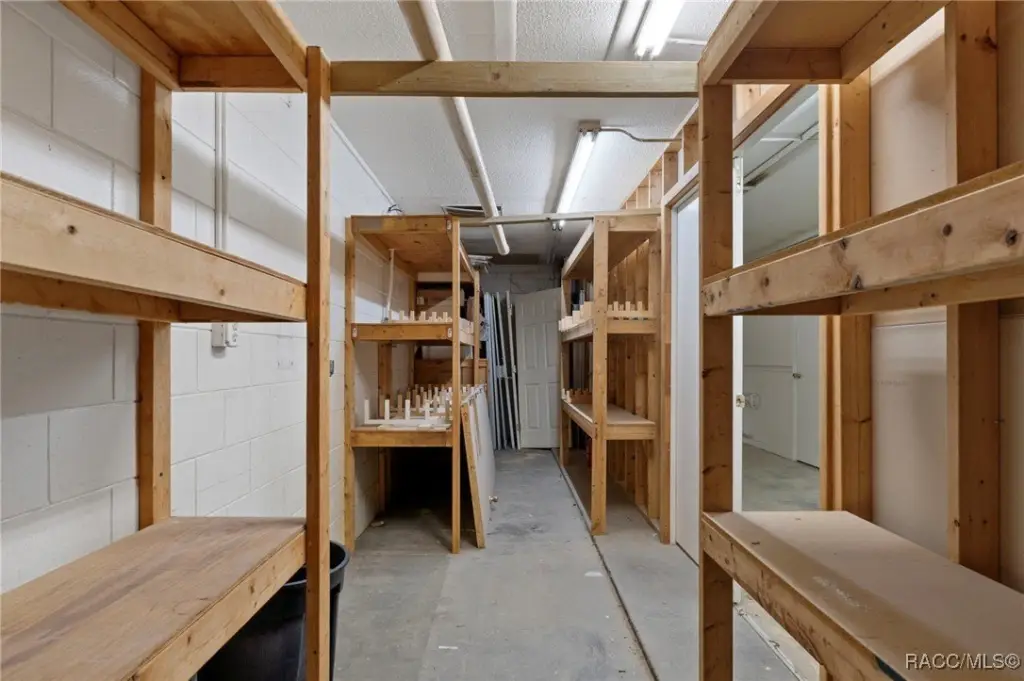
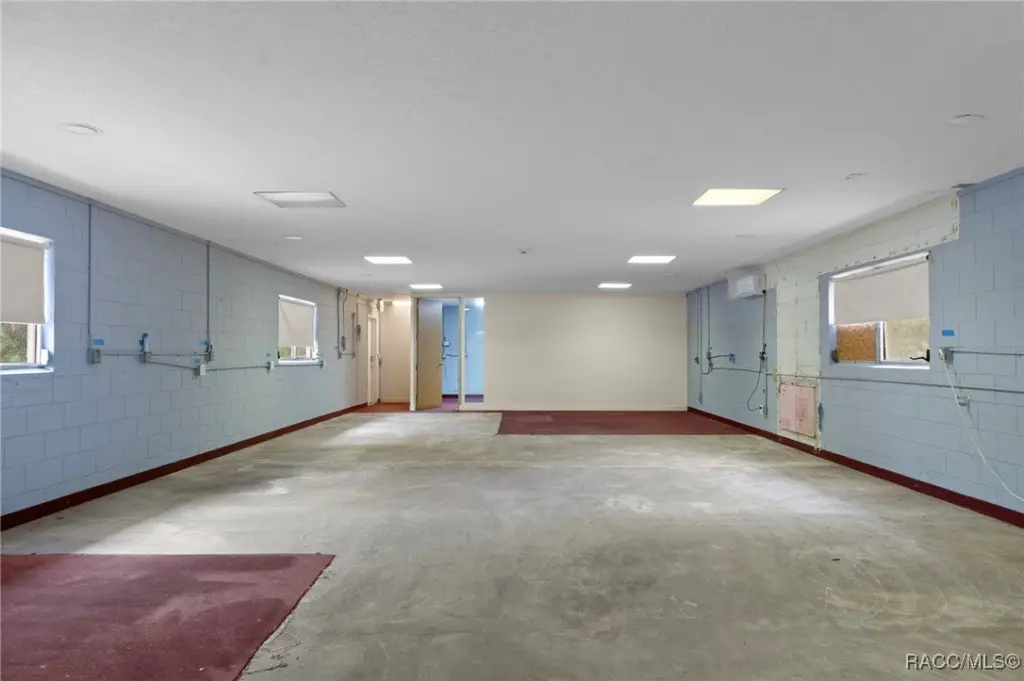
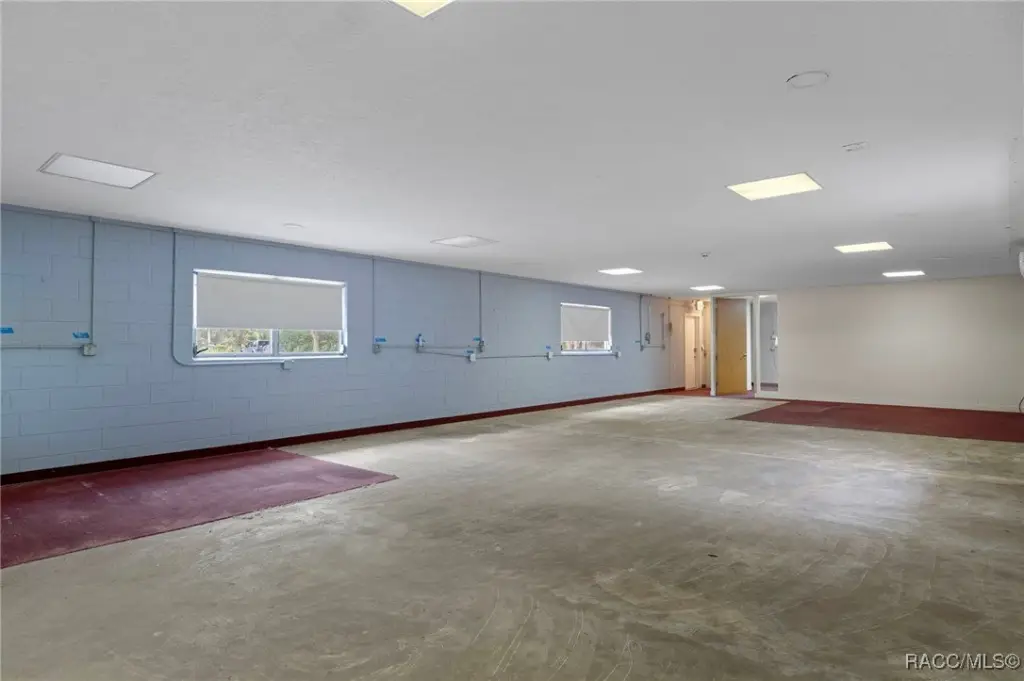
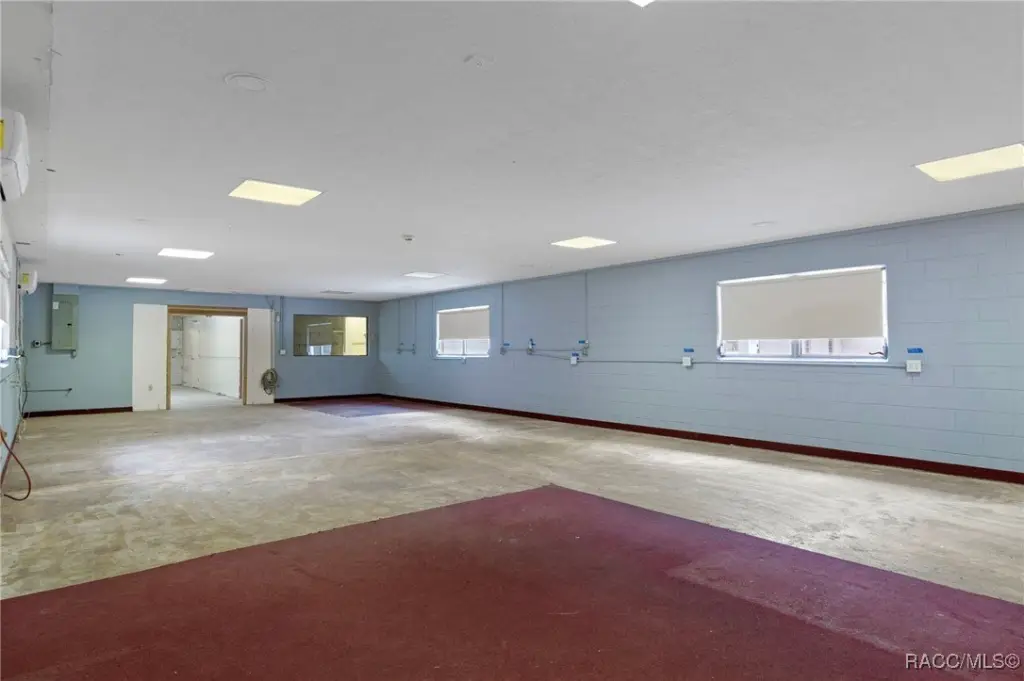
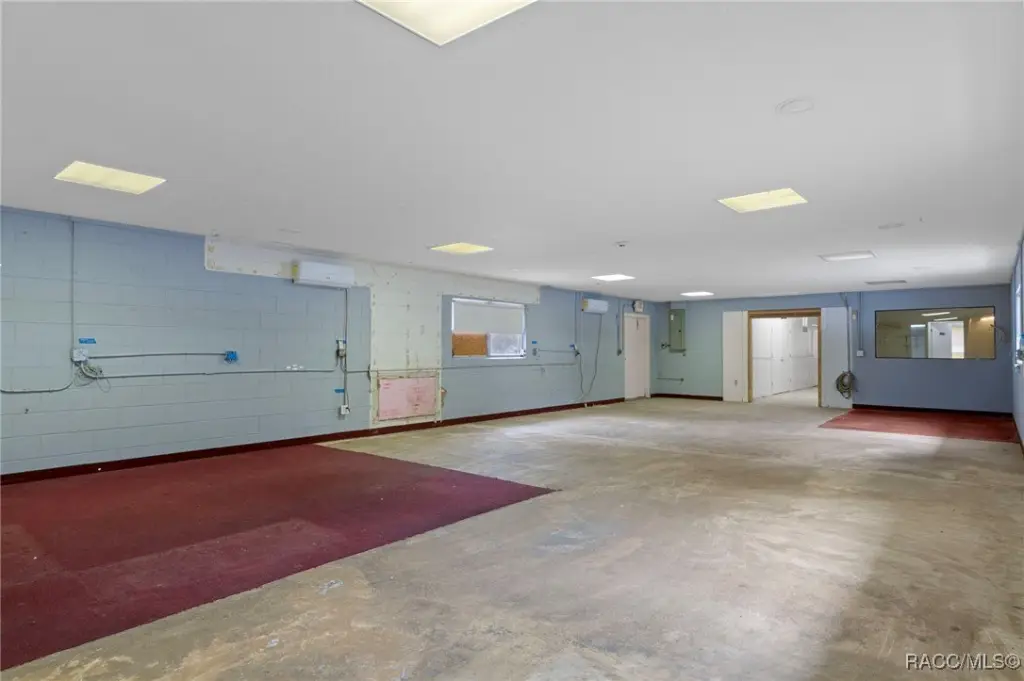
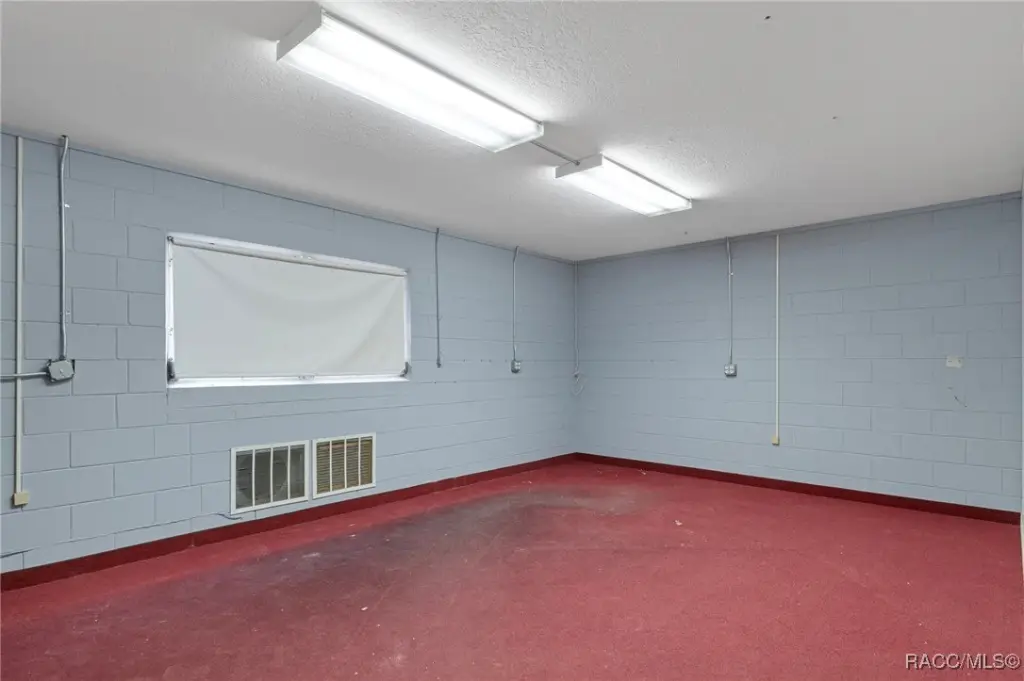
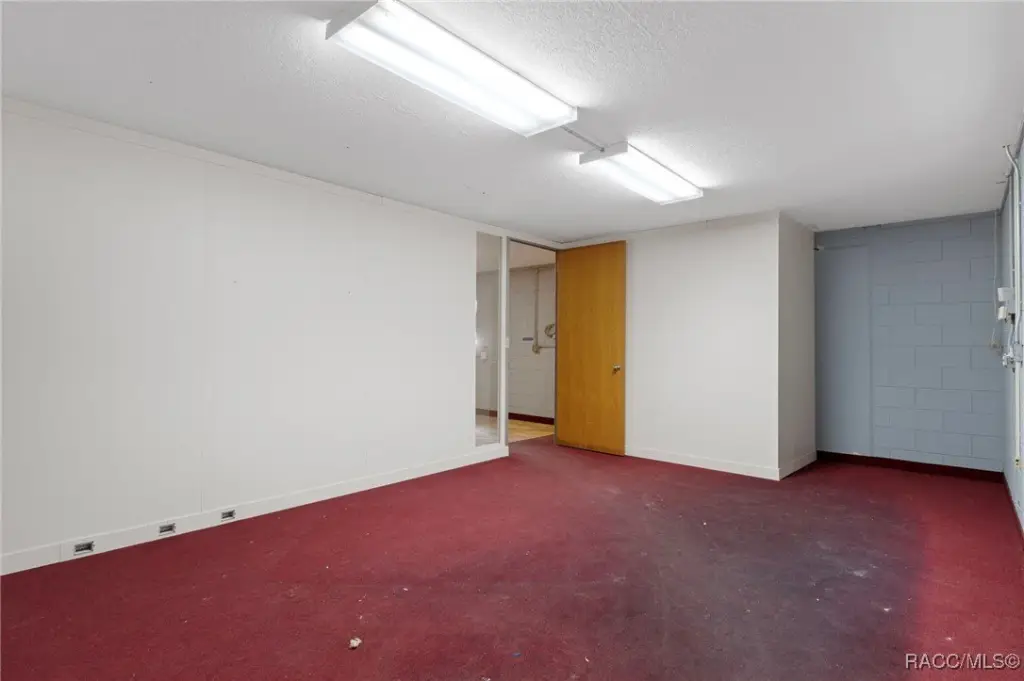
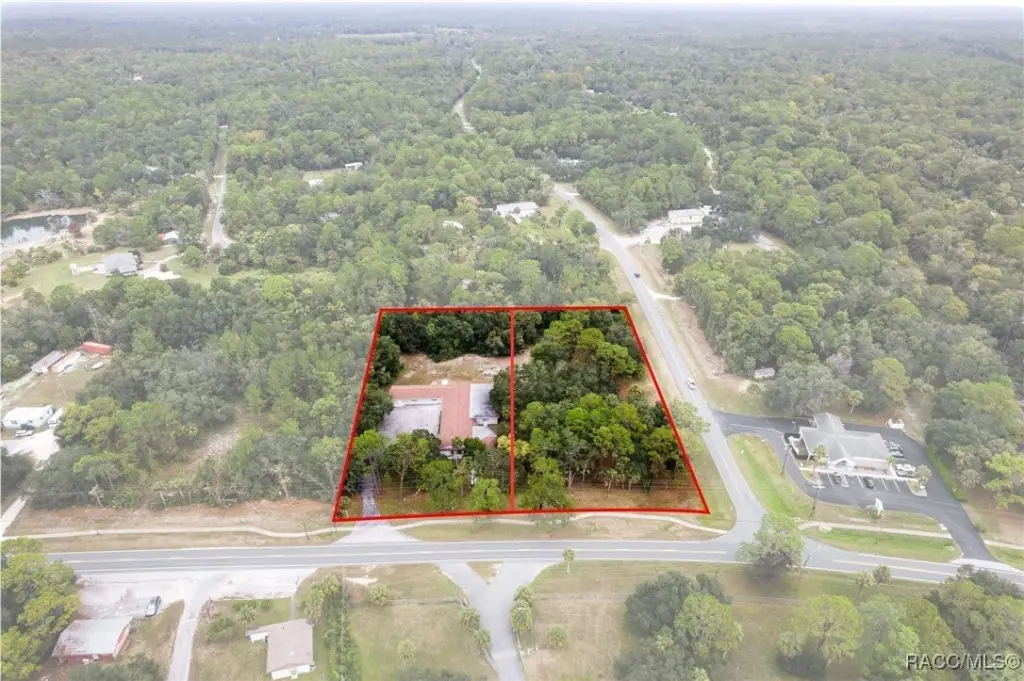
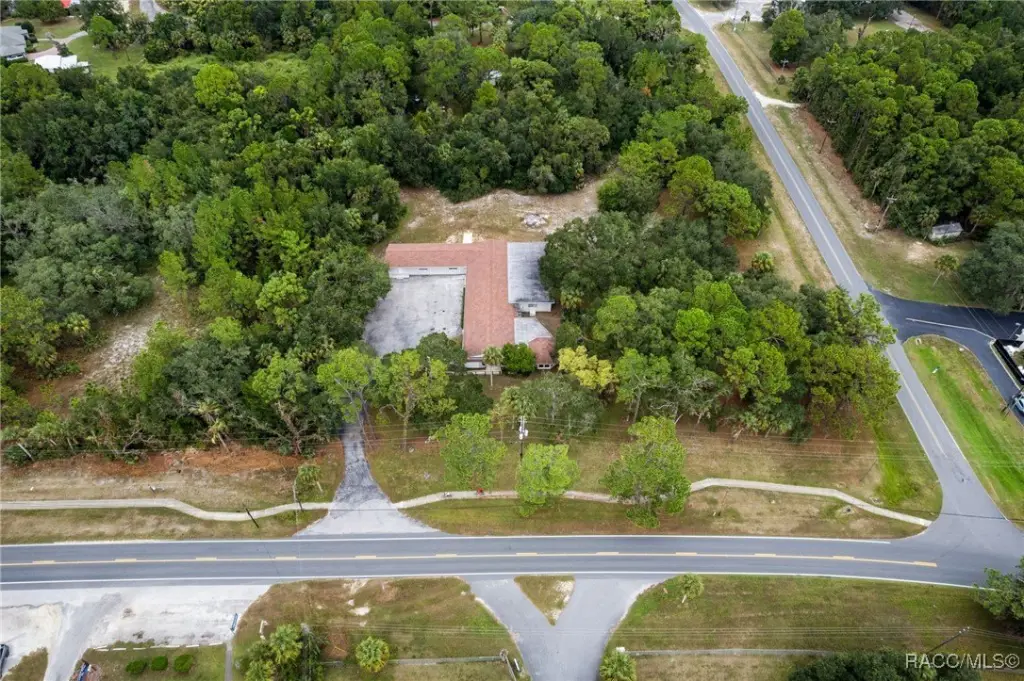
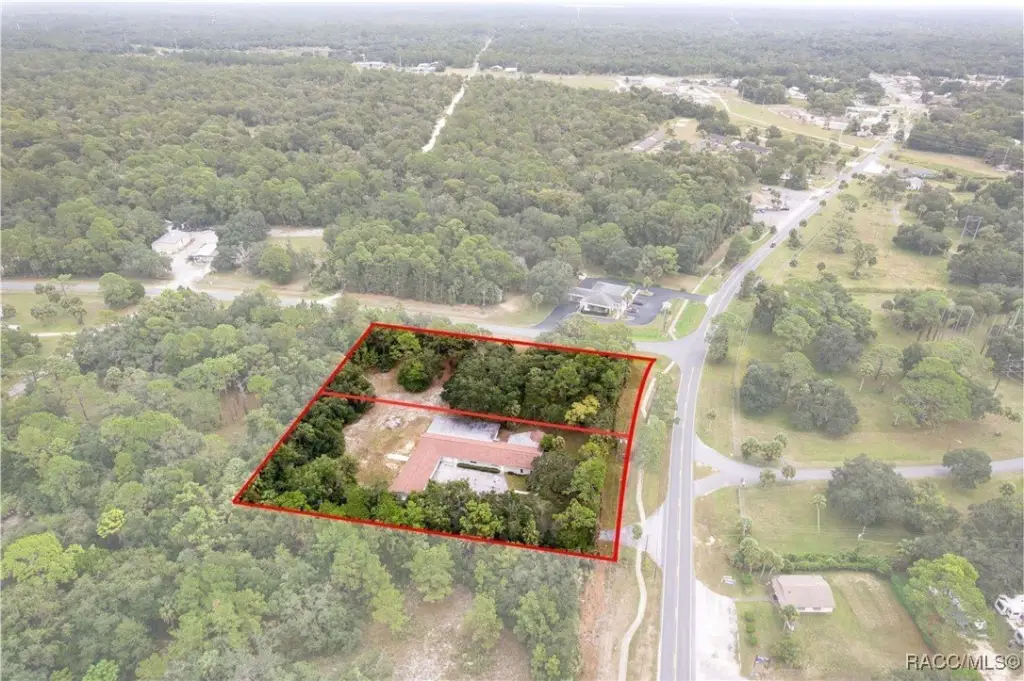
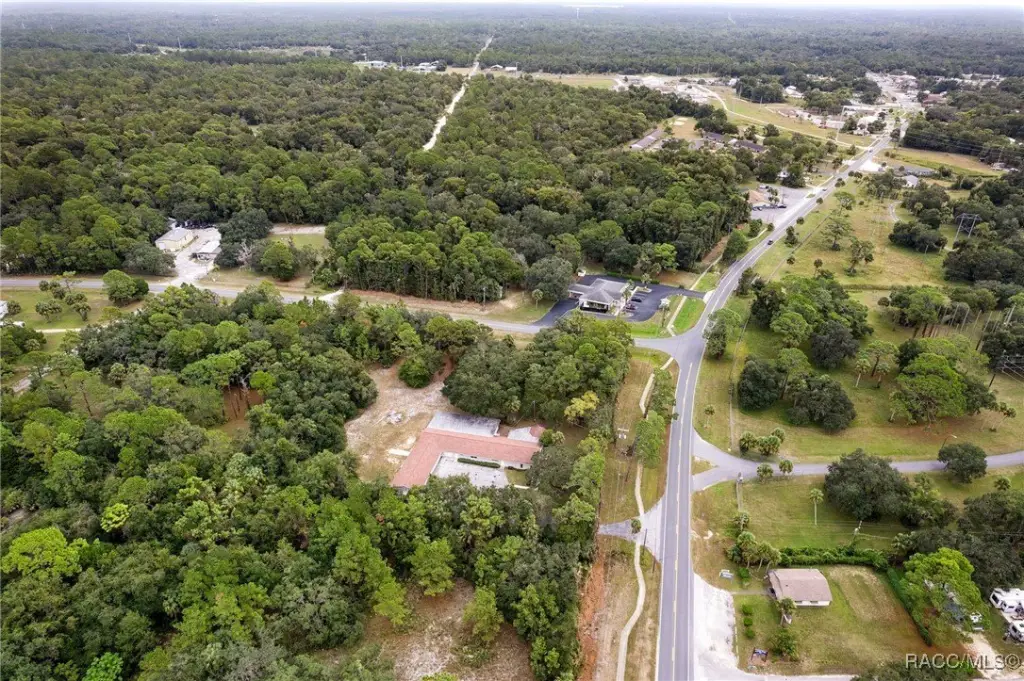
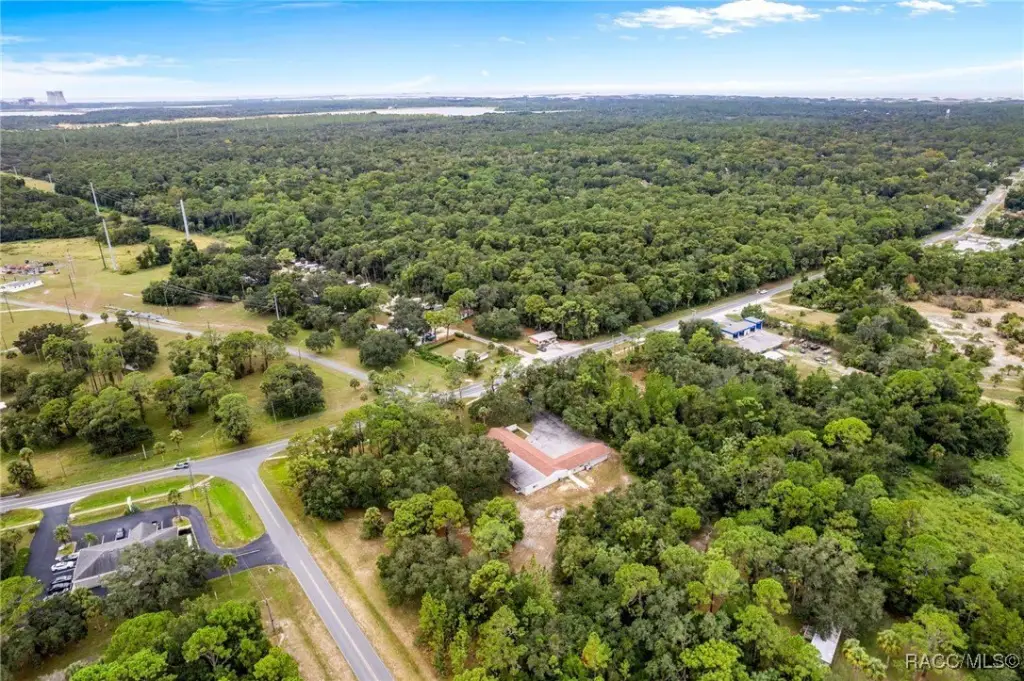
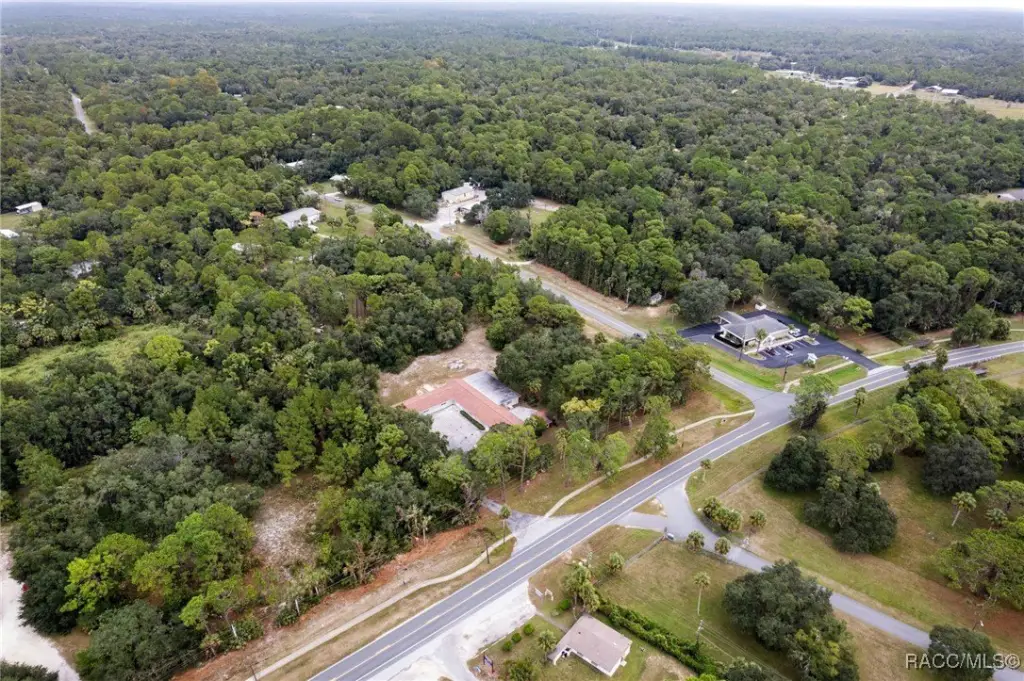
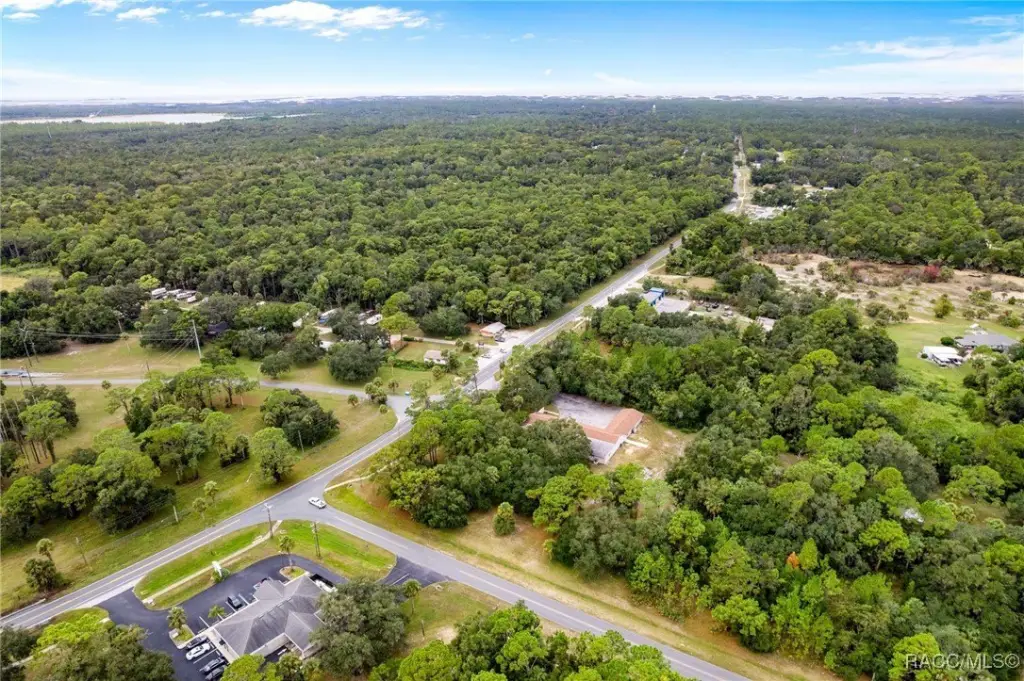
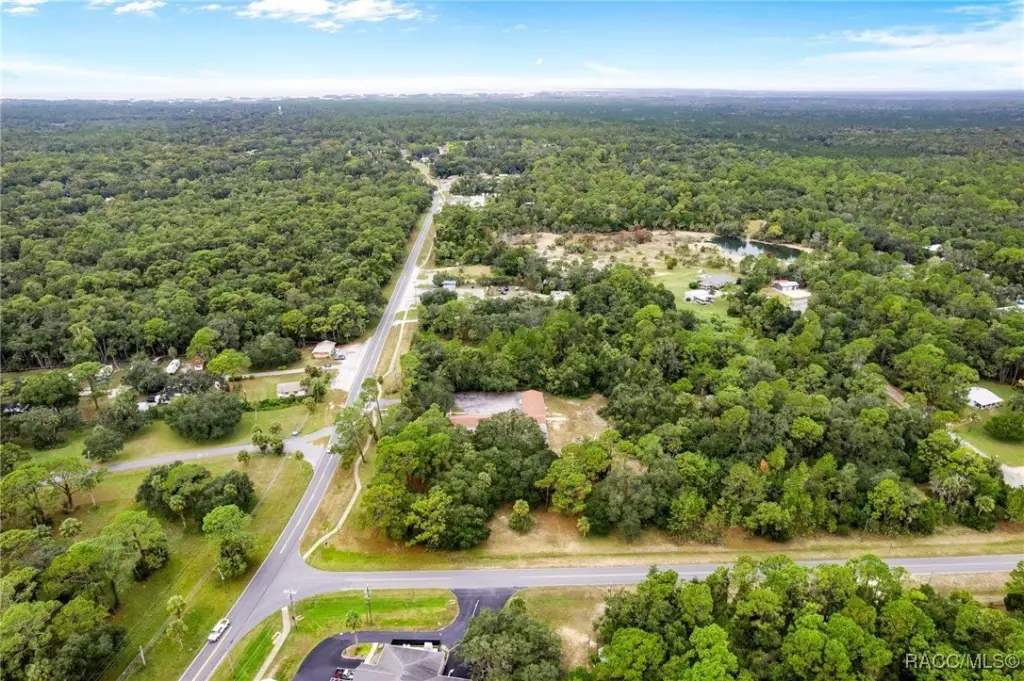
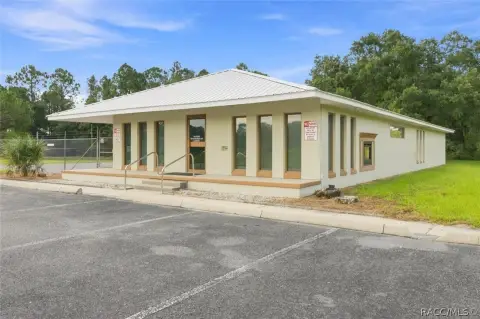
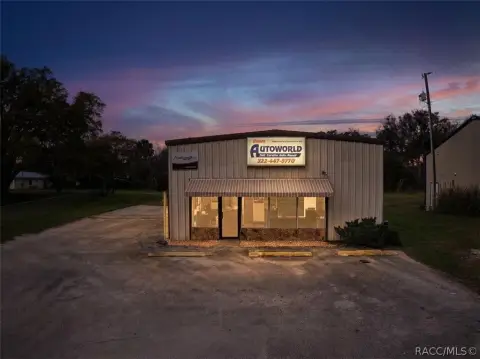
This flex property combines an improved industrial facility with an adjoining corner parcel for a total of 2.5 acres. The 1981 building includes approximately 25 rooms that can accommodate office, conference, storage, or light manufacturing functions, along with five bathrooms, three showers, a kitchen, and a loading dock with an overhead door. A concrete slab and 480-volt, three-phase electrical service support industrial operations, while networking and telecommunications wiring is already in place. Additional building features include high ceilings, concrete and tile flooring, central air, ductless cooling, and multiple heating and cooling systems.
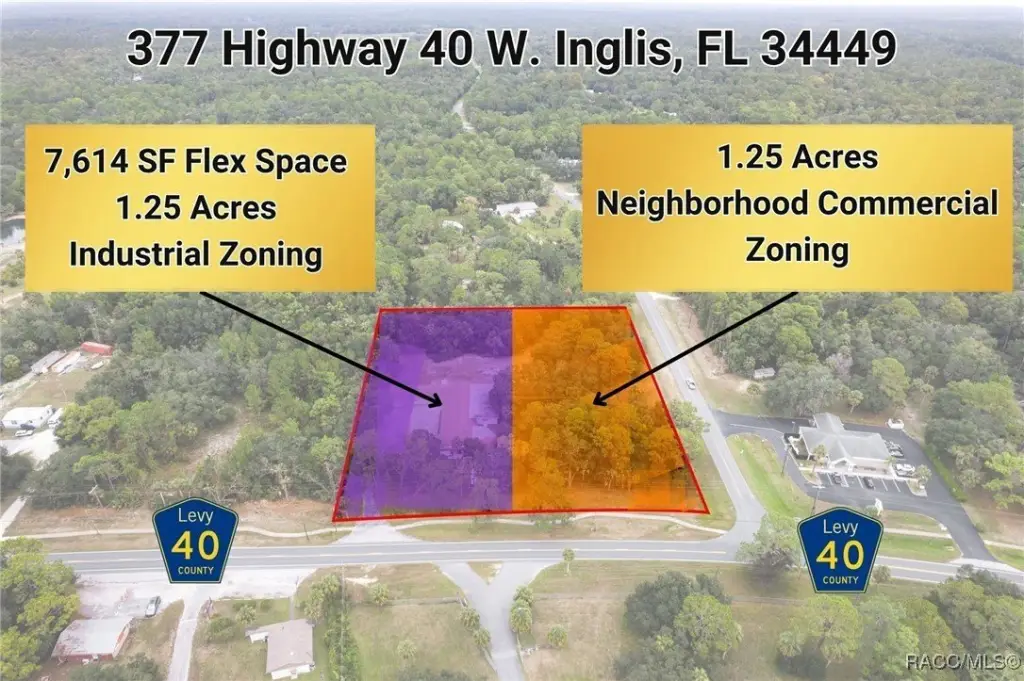
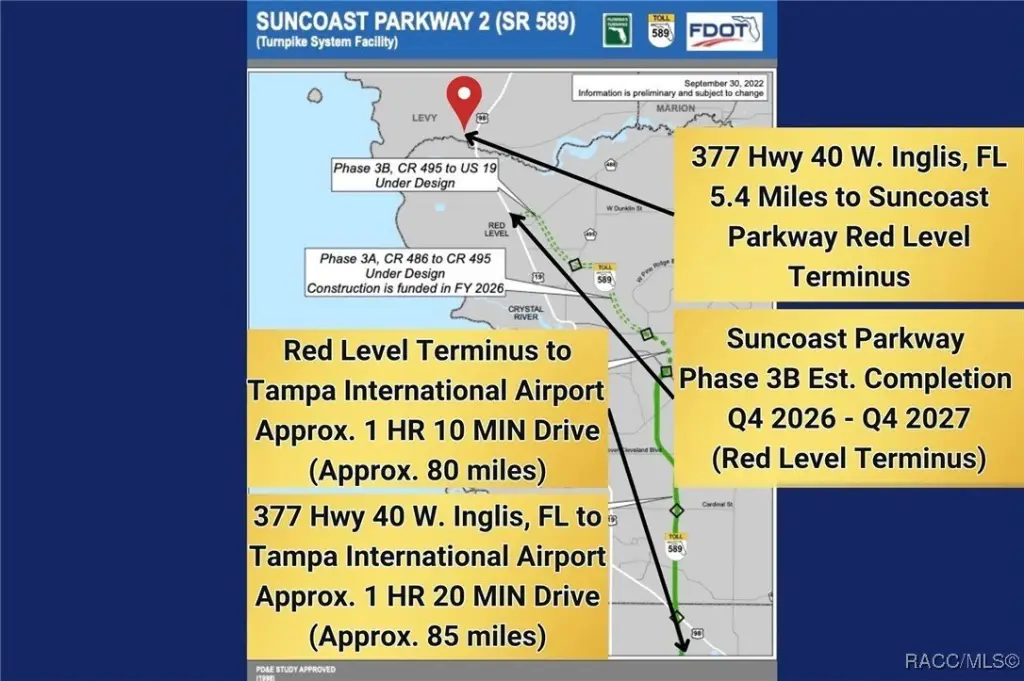
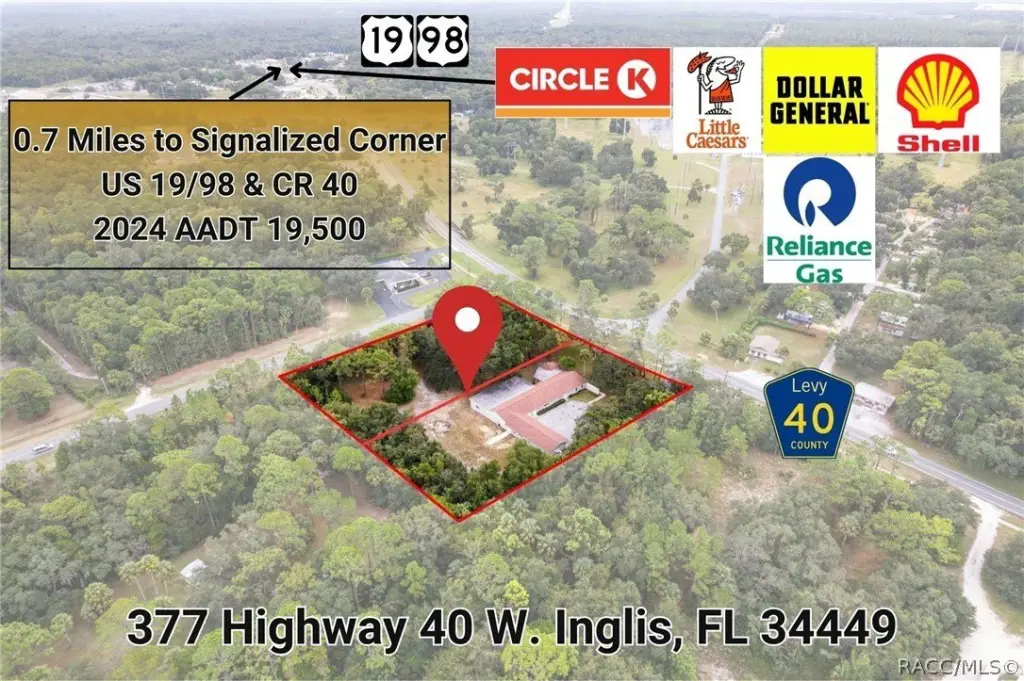
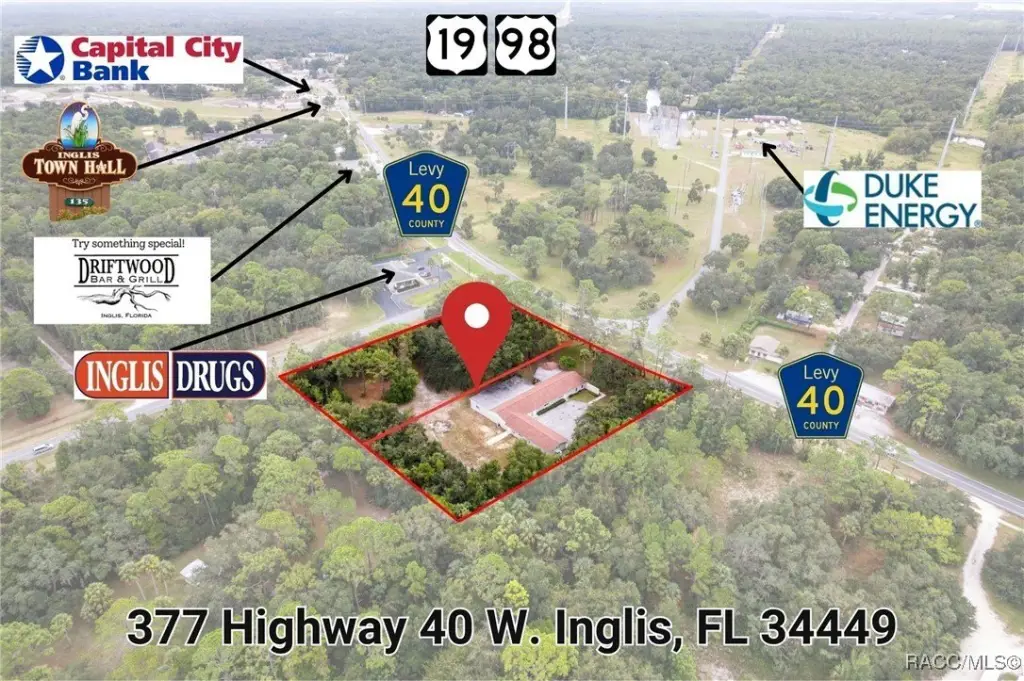
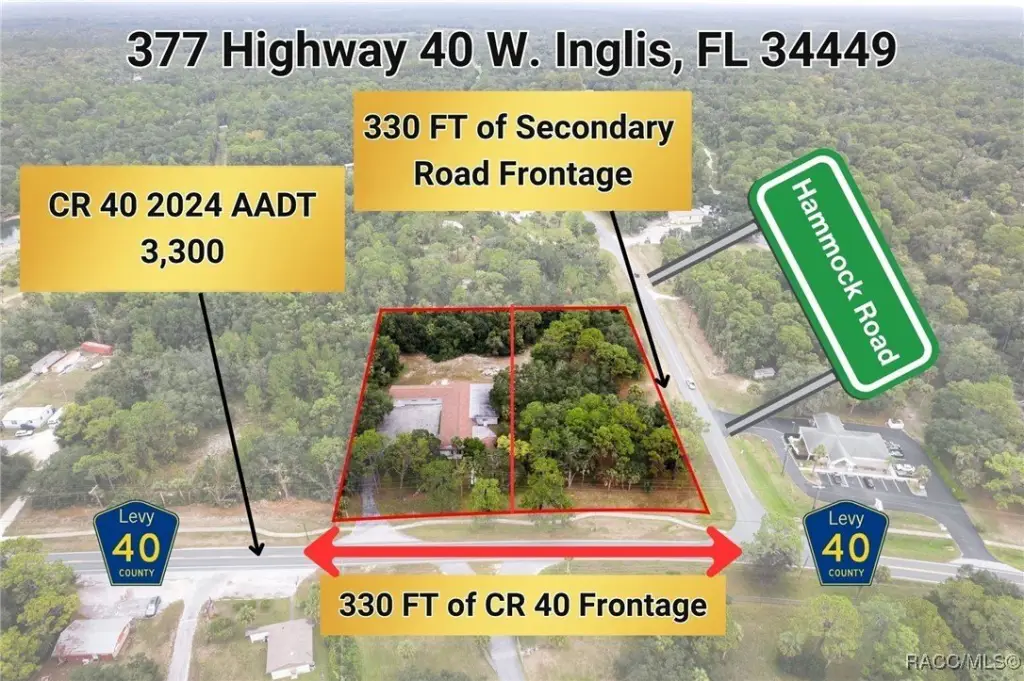
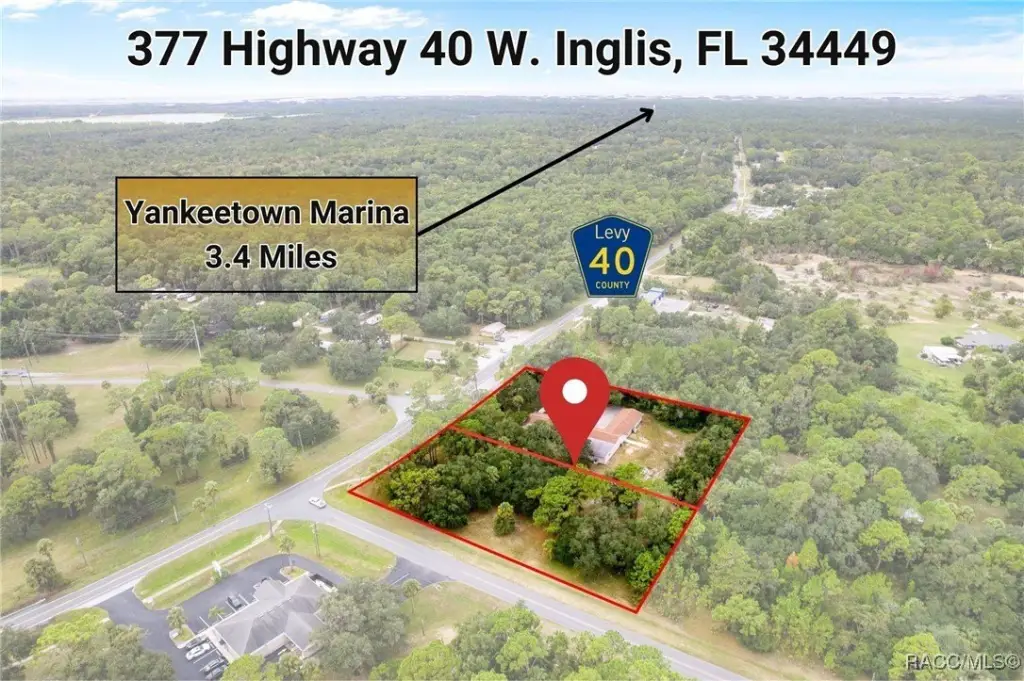
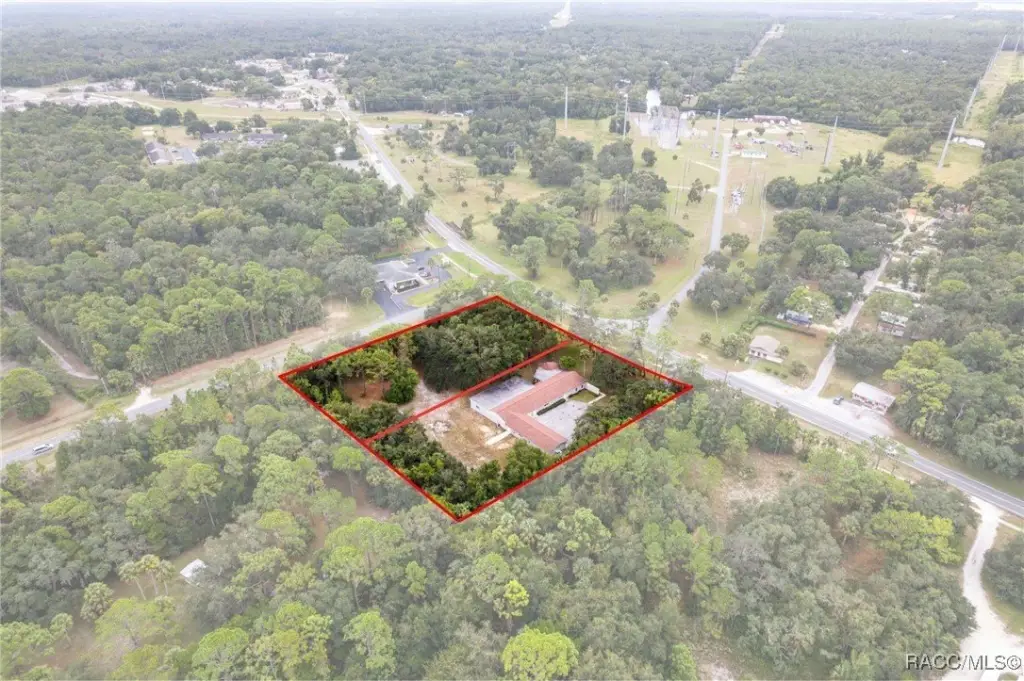
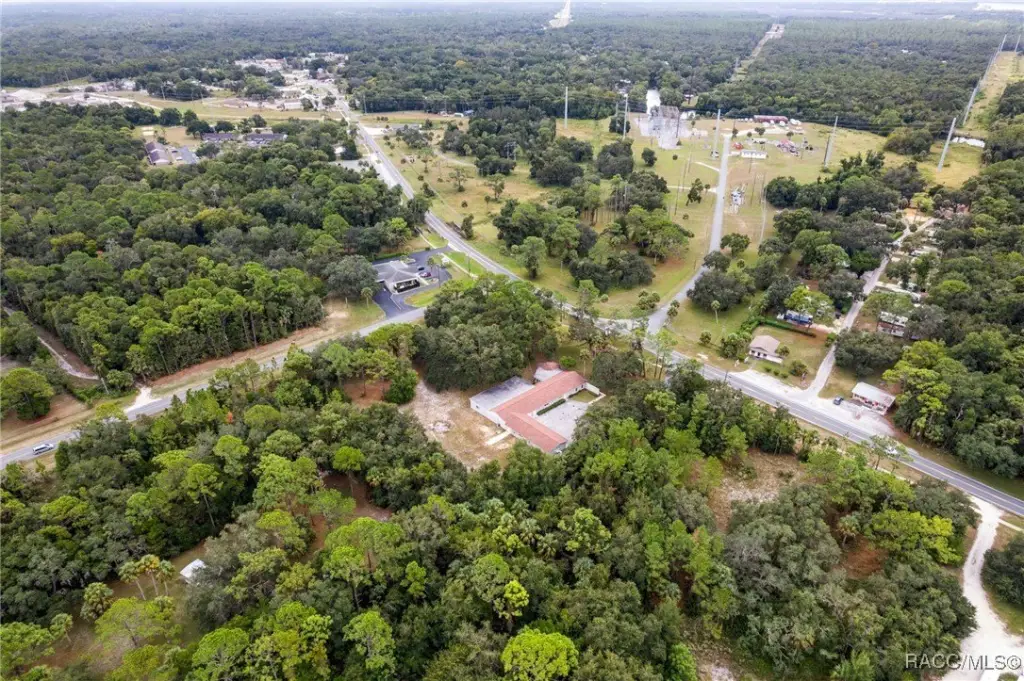
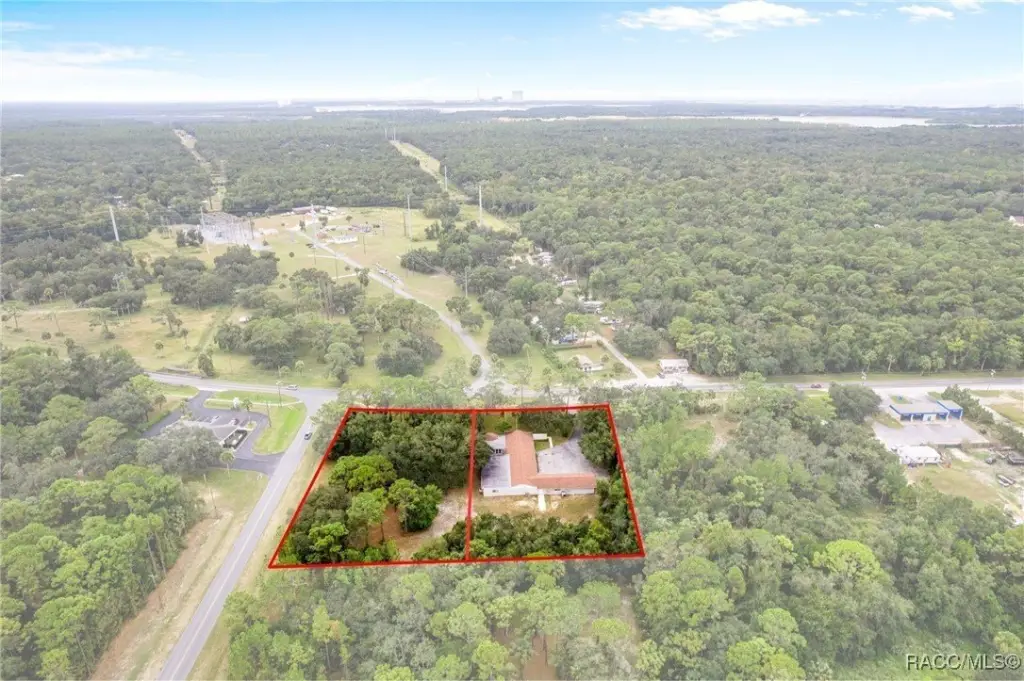
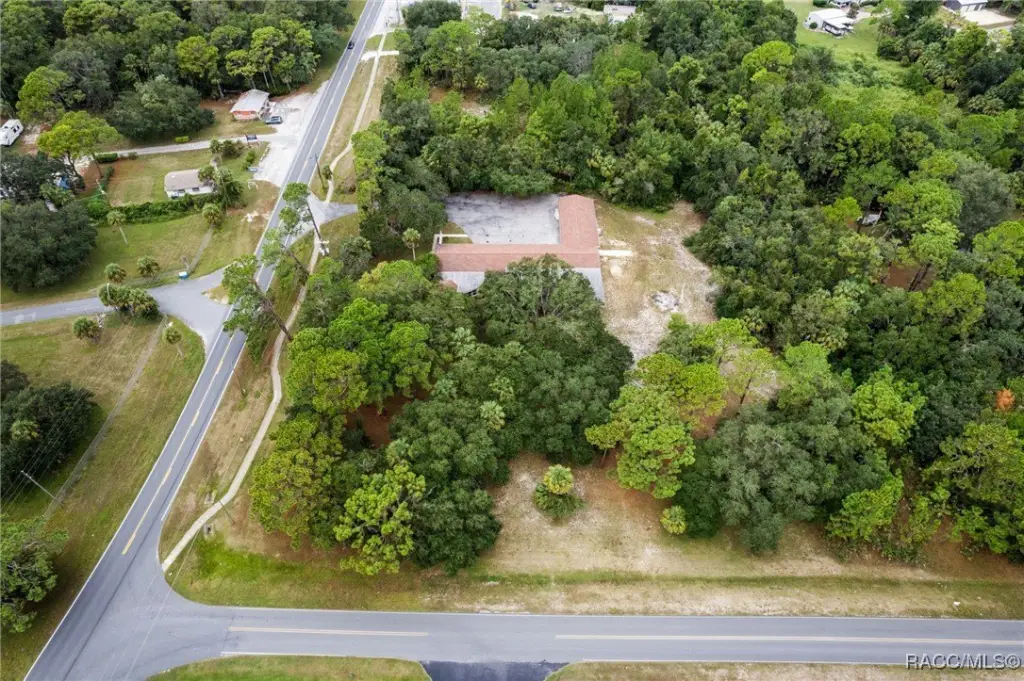
The assemblage provides approximately 330 feet of frontage along CR 40, plus another 330 feet of secondary road frontage on the corner parcel. Zoning includes C1,IND and C-1 Neighborhood Commercial. Public water and septic service are present. The property is positioned within the Gainesville MSA and near the planned Suncoast Parkway Red Level Terminus extension, projected for completion between Q4 2026 and Q4 2027.
The assemblage provides approximately 330 feet of frontage along CR 40, plus another 330 feet of secondary road frontage on the corner parcel. Zoning includes C1,IND and C-1 Neighborhood Commercial. Public water and septic service are present. The property is positioned within the Gainesville MSA and near the planned Suncoast Parkway Red Level Terminus extension, projected for completion between Q4 2026 and Q4 2027.
Key Highlights
- 2.5‑acre assemblage includes an improved industrial parcel and adjoining 1.25‑acre corner parcel
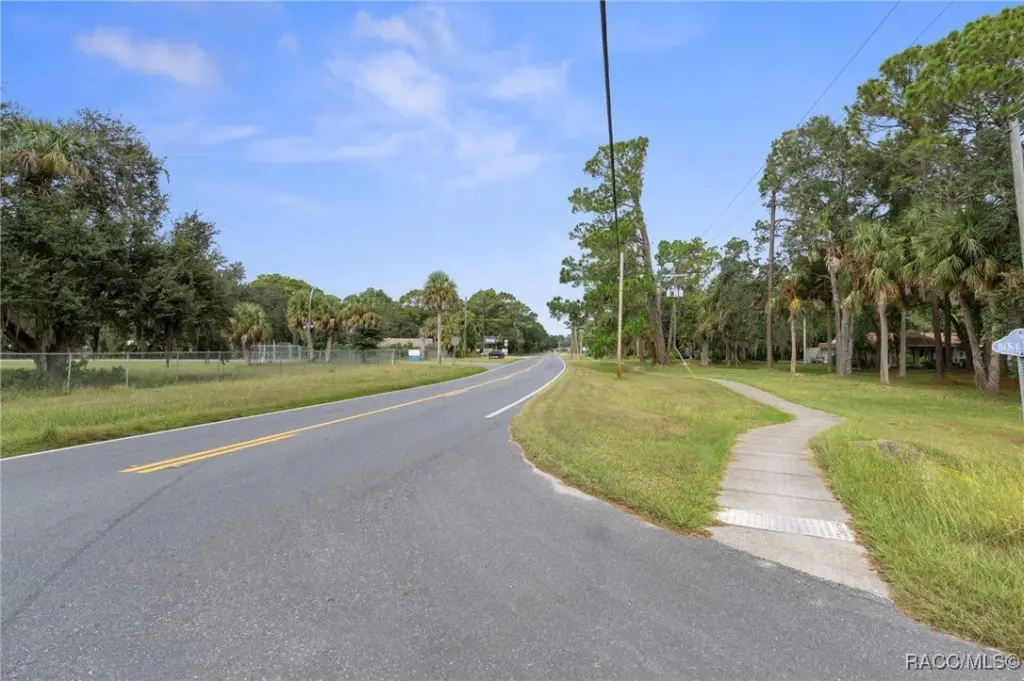
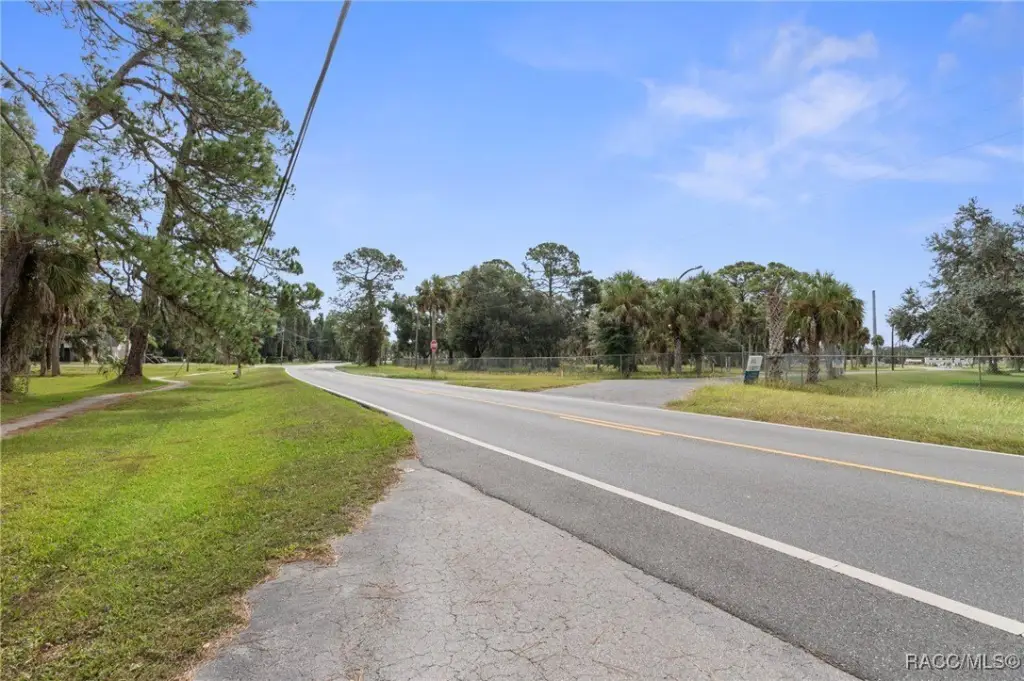
- Approximately 330 feet of CR 40 frontage plus an additional 330 feet of secondary road frontage
- 480‑volt, three‑phase electrical service with an oversized concrete slab
Financial Insights
Estimated NOI and Cap Rate
NOI / Yr
$51,646
Cap Rate
8.61%
Suggested Prices Based on Cap Rates
Cap Rate 5%
$1,032,920
$1.0M
Cap Rate 7%
$737,800
$737.8K
Cap Rate 9%
$573,844
$573.8K
Market Conditions
NOI Build-Up for 7,614 SF
Gross rent
$77.7K $10.20/SF
− Vacancy
−$3.9K −$0.51/SF
EGI
$73.8K $9.69/SF
− OpEx
−$22.1K −$2.91/SF
NOI
$51.6K $6.78/SF
Area
Levy County, FL
Vacancy
5.00%
Lease Rate
$10.20 /SF/Yr
Expense Ratio
30.00%
Simulate Cap Rate and NOI
Suggested Prices Based on Cap Rates
Cap Rate 5%
$1,032,920
Cap Rate 7%
$737,800
Cap Rate 9%
$573,844
Alternative Uses
Best Use
Flex RnD
$1.02M
$892.7K – $1.19M
NOI $71,416 @ 7.0% cap · market cap 11.90%
Second Best
Warehouse
$794.7K
$695.3K – $927.1K
NOI $55,626 @ 7.0% cap · market cap 9.27%
Theoretical Best
Office A
$1.89M
$1.65M – $2.20M
NOI $132,008 @ 7.0% cap · market cap 22.00%
Zoning and permitted uses should be independently verified with authorities.
Property Analytics
Unlock full access to Insights
Subscribe to Realmo Intelligence
Open Analytics
Current Use
Lease Details
1
Dock-high doors
Yes
Paved road access
Location Intelligence
Trade Area within ½ mile
131
Businesses Nearby
Well-served
Demand for This Use
Explore this area
Business Placement
Demographics for 34449, FL
3,421
Population
1,986
Households
1.7
Avg Household Size
56
Median Age
13%
College-Educated
87%
High-School Grad
130.7 sq mi
ZIP Area
26
Density / Sq Mi
$52,760
Median Household Income
$27,108
Median Earnings
$775
Median Rent
$143,900
Median Home Value
Check the figures for this property
Cap Rate, Value Estimation, Potential NOI and more
View Realmo Analytics
Market
Vacancy Rate% for Industrial in South region

Questions? Ask Rey
Realmo’s AI knows this listing — price, zoning, demand, history. Ask anything.



Frequently Asked Questions
What type of property is this?
Flex space - Adaptable industrial and commercial property with substantial road exposure, specialized power, and a multi-room interior configuration.
Where is this flex space located?
The property is located at 377 Highway 40 W Inglis, FL.
What is the asking price?
The asking price for this property is $600,000.
What are key features of this property?
This property features: 2.5‑acre assemblage includes an improved industrial parcel and adjoining 1.25‑acre corner parcel; Approximately 330 feet of CR 40 frontage plus an additional 330 feet of secondary road frontage; 480‑volt, three‑phase electrical service with an oversized concrete slab


