Two-Family Detached
For Sale
$1,848,749
37 Torrice Loop, Staten Island, NY 10309
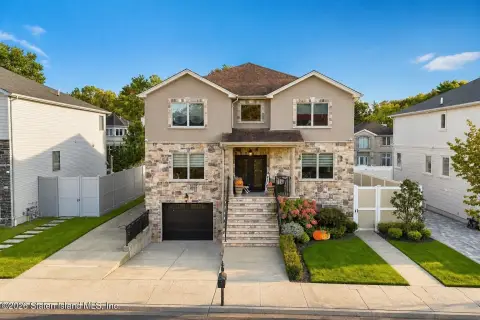
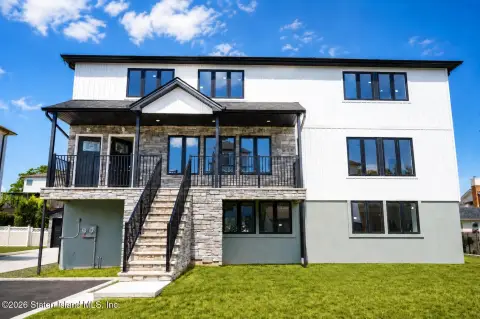
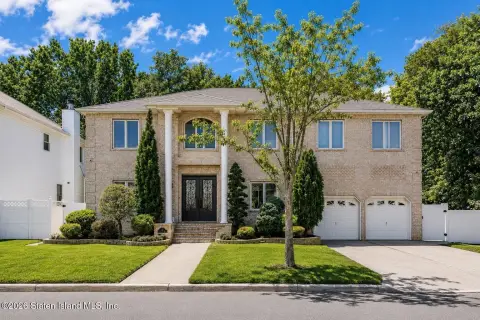
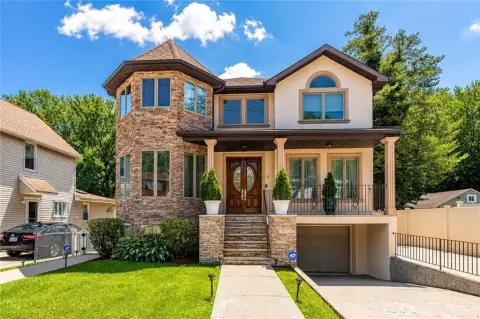
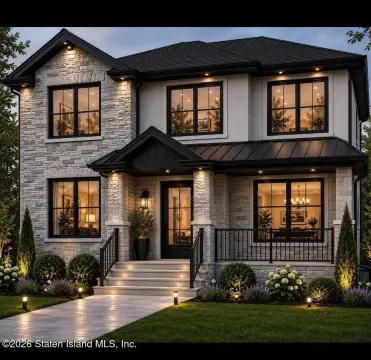
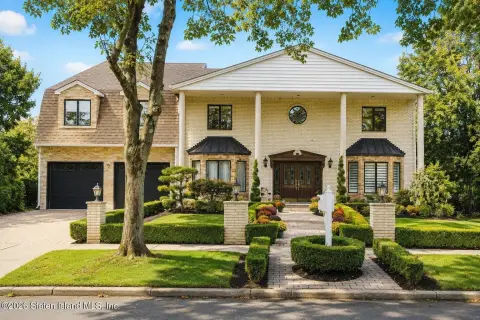
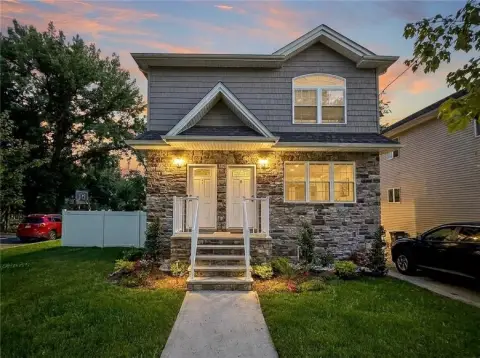
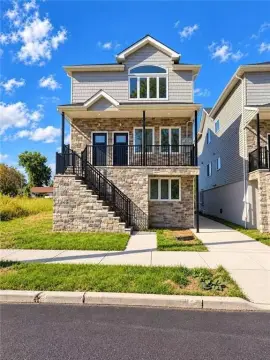
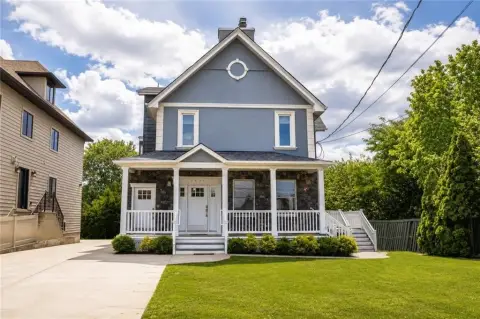
Detached two-family home with paved rear yard, finished basement, and multiple bedrooms across two levels.
Property Size4,000 SF
Lot Size0.17 Acres
Price / SF$462.19
Days on Market119
Property Features for 37 Torrice Loop
General Information
Standard status
Active
Size
4,000 SF
Total Parking Spaces
6
Lot size
0.17 Acres
Property subtype
Multi-Family
Site & Location
Highway Access
Yes
Fenced Yard
Yes
Additional Details
Multifamily Units
2
Amenities
Baccarat Lighting thru-out
Wolf oven/stove
Wolf Microwave
Marble backsplash
Double Fisher & Paykel Dishwasher
Bar Refrigerator
Hemtech door knobs
Stone wall in Formal living rm
Color match thermostats
6 Zone Heat
Tile flooring has 6 zones of heat including Radiant Heat
Upgraded Spindles in the Railings
Front Steps Slate
Brick/Stucco outside
All Brown Fence owned by 37 Torrice loop
Front 4 Zone Sprinkler Sys
Soffit Camera Sys
Pavers
Garage Tiled
Gas Line BBQ
Gas Pizza Oven
Outside Tv
Hot Tub
Full Finished basement with a 3/4 bathroom & Family room
2 Story Grand entrance
Formal Living Room with Custom Wet Bar with Refrigerator
Formal Dining Room
Great Room with Gas Fire place
Eat in Kitchen with Sliders to Yard
1/2 Bath
Laundry Closet
Master Bedroom Suite with WIC
Private Full Bath with Rain Head /shower Sprays/Shower Seat
Custom 2nd Full Bath
Building Details
Year Built
2022
Construction
Brick/Stucco
Listing Agency:
Robert DeFalco Realty, Inc.
Listed By:
Ann Grande · License #40GR1025086
(347) 837-6989
Source:
Statenislandhomelistings
Added: Jun 30
Changed: Oct 26
Last Checked: Oct 24 at 5:49PM
Displayed information is deemed reliable but is not guaranteed and should be independently verified. All listing content including descriptions, pricing, images are the copyrighted material of Robert DeFalco Realty, Inc.

Ask AI about this property
Review the available facts, identify missing information and prepare questions for the agent.
Investment Insights
Based on property information with market context.
This is a detached two-family home offering a multi-level layout with a grand entrance and formal living and dining rooms. The home includes a great room with a gas fireplace and an eat-in kitchen with sliders to the yard. Level one also features a half bath and a laundry closet. Level two provides four bedrooms, including a primary suite with a walk-in closet and a private full bath, plus three additional bedrooms served by a custom full bath. Additional features include a full finished basement with a family room and a 3/4 bathroom, along with outdoor entertaining amenities in the rear yard.
The property sits on a lot measuring 56 x 131 and includes a driveway for up to 6 cars. The exterior is described as brick/stucco, with upgraded front yard elements and a front sprinkler system. The rear yard is improved with pavers, and includes a garage with tiled finish, plus gas line connections for a BBQ and gas pizza oven, as well as outdoor TV and a hot tub.
The home is described as having high-end interior and exterior details, and the maintenance fee noted includes lamp post, storm sewer, and snow removal.
The property sits on a lot measuring 56 x 131 and includes a driveway for up to 6 cars. The exterior is described as brick/stucco, with upgraded front yard elements and a front sprinkler system. The rear yard is improved with pavers, and includes a garage with tiled finish, plus gas line connections for a BBQ and gas pizza oven, as well as outdoor TV and a hot tub.
The home is described as having high-end interior and exterior details, and the maintenance fee noted includes lamp post, storm sewer, and snow removal.
Key Highlights
- Detached 2‑family home built in 2020 in Lazio Villas
- Property 56 x 131 with 2‑story grand entrance plus driveway parking for 6 cars
- Finished basement with 3/4 bathroom and family room with access to the main house
Financial Insights
Estimated NOI and Cap Rate
NOI / Yr
$99,473
Cap Rate
5.38%
Suggested Prices Based on Cap Rates
Cap Rate 5%
$1,989,460
$2.0M
Cap Rate 7%
$1,421,043
$1.4M
Cap Rate 9%
$1,105,256
$1.1M
Market Conditions
NOI Build-Up for 4,000 SF
Gross rent
$148.8K $37.20/SF
− Vacancy
−$6.7K −$1.67/SF
EGI
$142.1K $35.53/SF
− OpEx
−$42.6K −$10.66/SF
NOI
$99.5K $24.87/SF
Area
Staten Island, NY
Vacancy
4.50%
Lease Rate
$37.20 /SF/Yr
Expense Ratio
30.00%
Simulate Cap Rate and NOI
Suggested Prices Based on Cap Rates
Cap Rate 5%
$1,989,460
Cap Rate 7%
$1,421,043
Cap Rate 9%
$1,105,256
Alternative Uses
Best Use
Multifamily LT 5
$1.42M
$1.24M – $1.66M
NOI $99,473 @ 7.0% cap · market cap 5.38%
Second Best
Apartment 5plus
$1.27M
$1.11M – $1.48M
NOI $88,704 @ 7.0% cap · market cap 4.80%
Theoretical Best
Office A
$1.91M
$1.67M – $2.23M
NOI $133,601 @ 7.0% cap · market cap 7.23%
Zoning and permitted uses should be independently verified with authorities.
How Realmo checks its estimates
Property Analytics
Unlock full access to Insights
Subscribe to Realmo Intelligence
Open Analytics
Lease Details
2
Residential units
Yes
Fenced yard
Yes
Highway access
Location Intelligence
Trade Area within ½ mile
304
Businesses Nearby
Explore this area
Business Placement
Demographics for 10309, NY
33,523
Population
12,770
Households
2.6
Avg Household Size
41
Median Age
40%
College-Educated
92%
High-School Grad
7.3 sq mi
ZIP Area
4,592
Density / Sq Mi
$123,638
Median Household Income
$67,348
Median Earnings
$1,907
Median Rent
$745,500
Median Home Value
Check the figures for this property
Cap Rate, Value Estimation, Potential NOI and more
View Realmo Analytics
Market
Vacancy Rate% for Multifamily in Northeast region



Frequently Asked Questions
What type of property is this?
Duplex - Detached two-family home with paved rear yard, finished basement, and multiple bedrooms across two levels.
Where is this duplex located?
The property is located at 37 Torrice Loop Staten Island, NY.
What is the asking price?
The asking price for this property is $1,848,749.
What are key features of this property?
This property features: Detached 2‑family home built in 2020 in Lazio Villas; Property 56 x 131 with 2‑story grand entrance plus driveway parking for 6 cars; Finished basement with 3/4 bathroom and family room with access to the main house