Two-Unit Townhome-Style
359 A Suwannee Drive Watersound, FL 32461
359 A Suwannee Drive, Watersound, FL, 32461
$547,460
Pending
For Sale
$547,460
Pending
MULTI_FAMILY - Other - Watersound, FL
Property Size1,442 SF
Days on Market64
Property Features for 359 A Suwannee Drive
General Information
- Property type
- Residential Multi Family
- Property subtype
- Other
- Property condition
- Under Construction
- Zoning
- Resid Single Family
- Bedrooms
- 2
- Bathrooms
- 3
- Rooms
- Bathroom 2, Bathroom 3, Bedroom 1, Bedroom 2, Family Room, Bathroom 1
- Parking
- 2
- Window features
- Storm Window(s)
- Patio and Porch features
- Porch, Patio
- Interior features
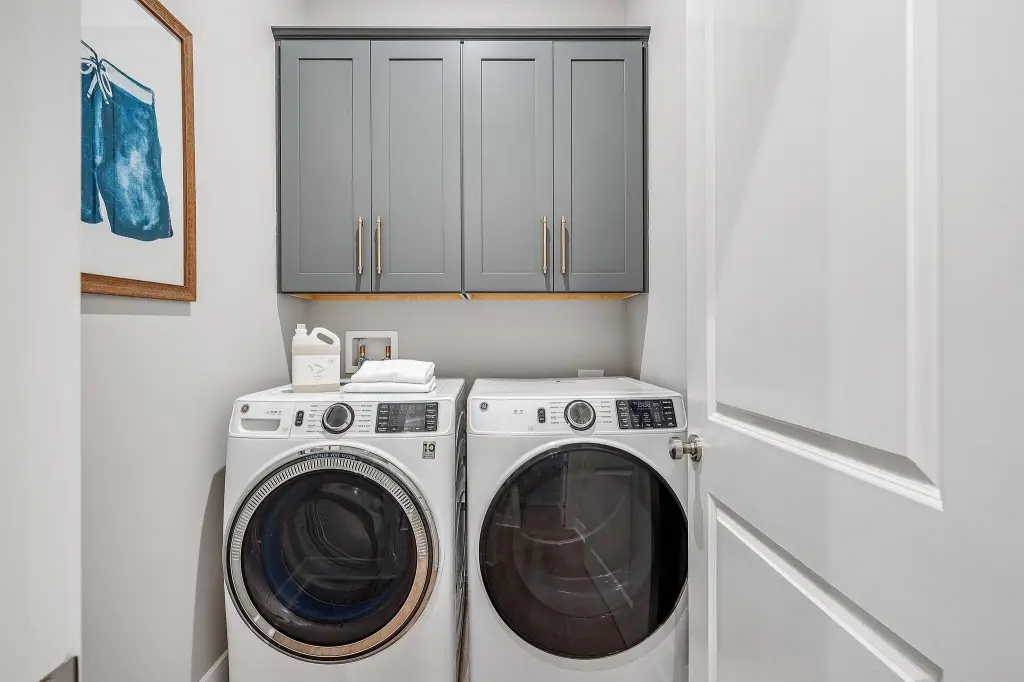
- Kitchen Island, Lighting Recessed, Pantry, Pull Down Stairs, Washer/Dryer Hookup, Woodwork Painted
- Exterior features
- Sprinkler System
- Appliances
- Auto Garage Door Opn, Cooktop, Dishwasher, Microwave, Refrigerator, Security System, Smoke Detector, Stove/Oven Electric, Warranty Provided, Water Heater - Tnkls
- Standard status
- Pending
- APN
- 23-3S-18-16160-000-0660
- Size
- 1,442 SF
Taxes and HOA fees
- Tax Description
- LOT 66 THE VILLAS AT LONGLEAF PARK PB 26-93 OR 3353-2175
Utilities
- Sewer type
- Public Sewer
- Heating system
- Central
- Cooling system
- Central Air
Building Details
- Year built
- 2026
- Floors in Building
- 1
- Flooring type
- Vinyl, Tile
- Building materials
- Frame, Siding CmntFbrHrdBrd
- Architectural style
- Other
Listing agency
Watersound Real Estate
(850) 213-5170
Listed by
Builder Services
(850) 213-5170
Added: May 20 Updated: Jul 16 at 3:43PM Checked: Jul 22 at 11:06PM
MLS# 1003458
Copyright © 2026 Emerald Coast Association of Realtors. All rights reserved. All information provided by the listing agent/broker is deemed reliable but is not guaranteed and should be independently verified.
Investment Insights
Based on property information with market context.
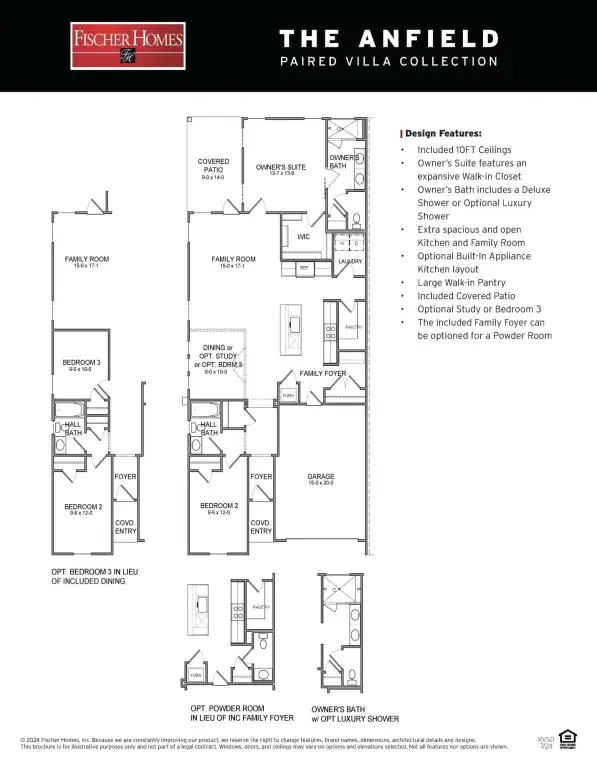
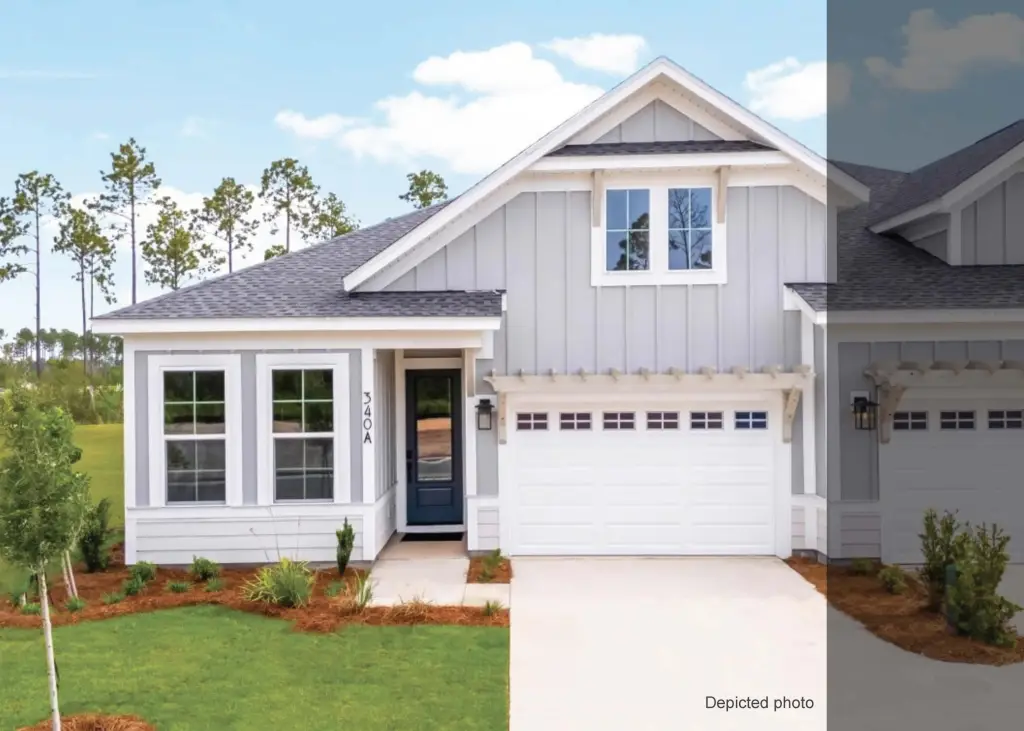
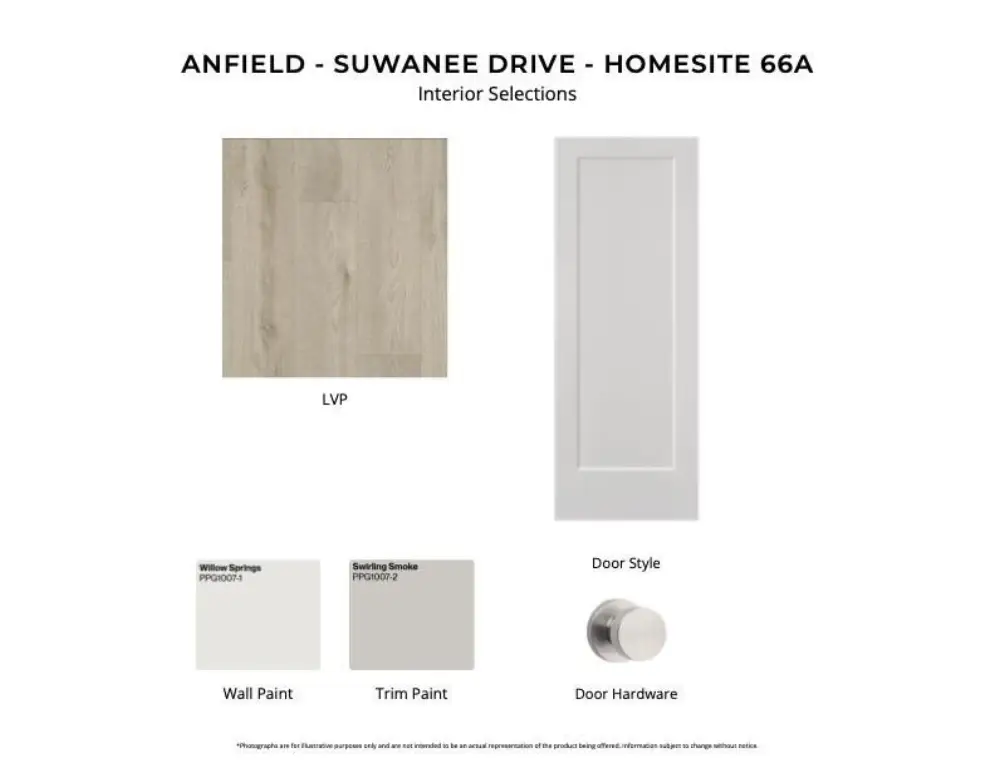
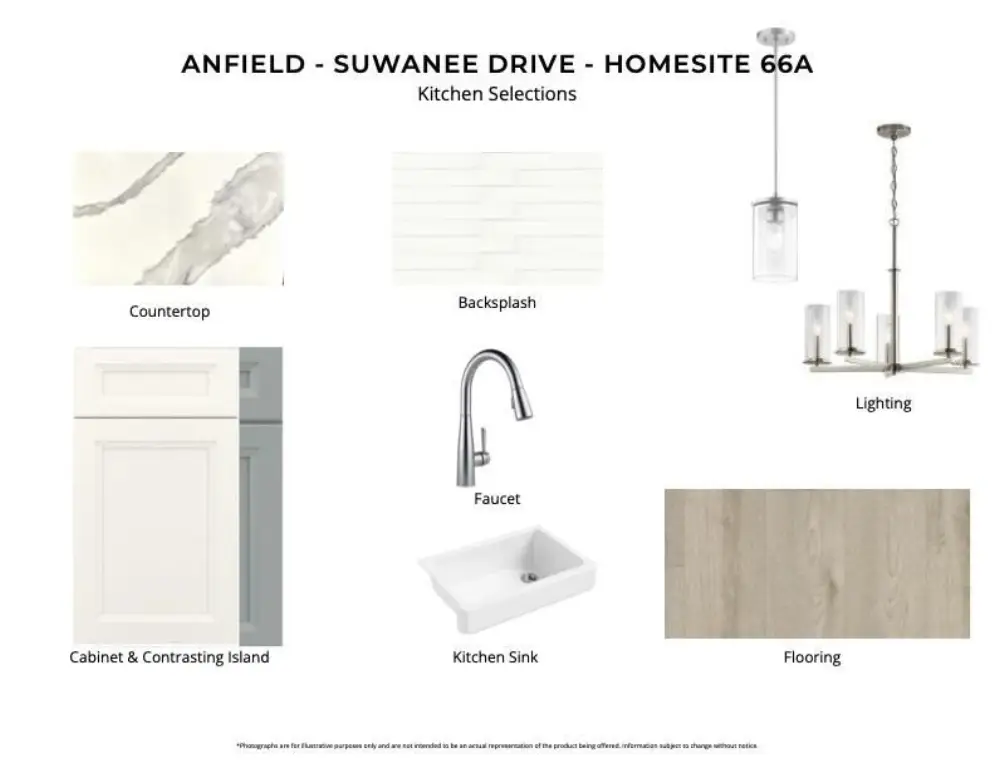
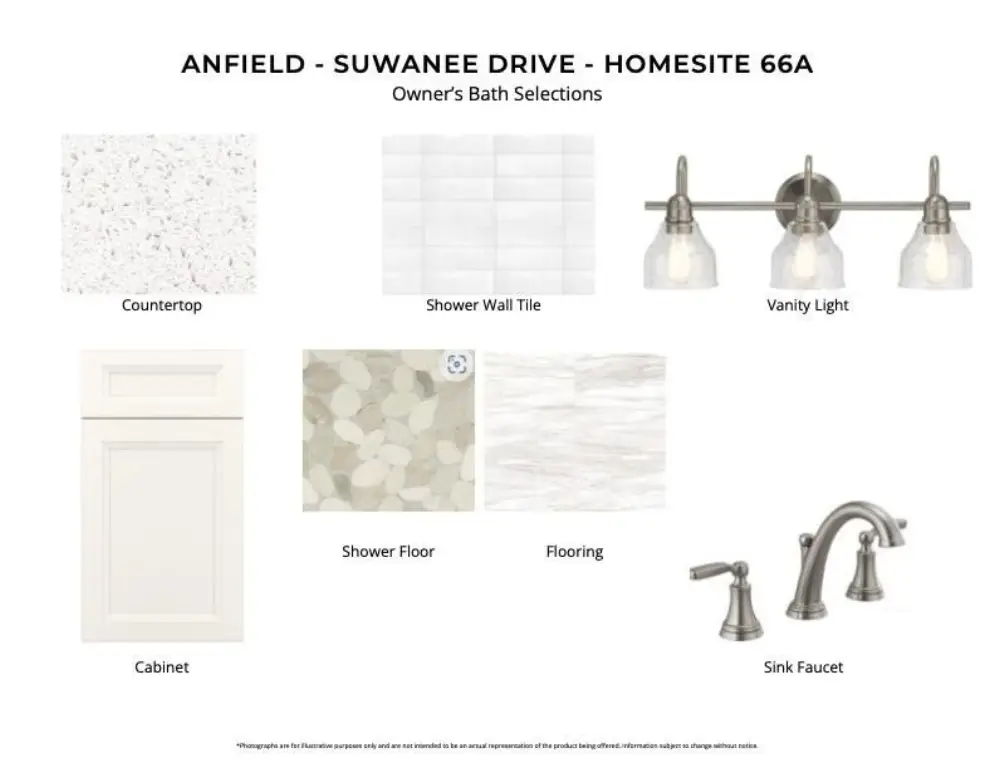
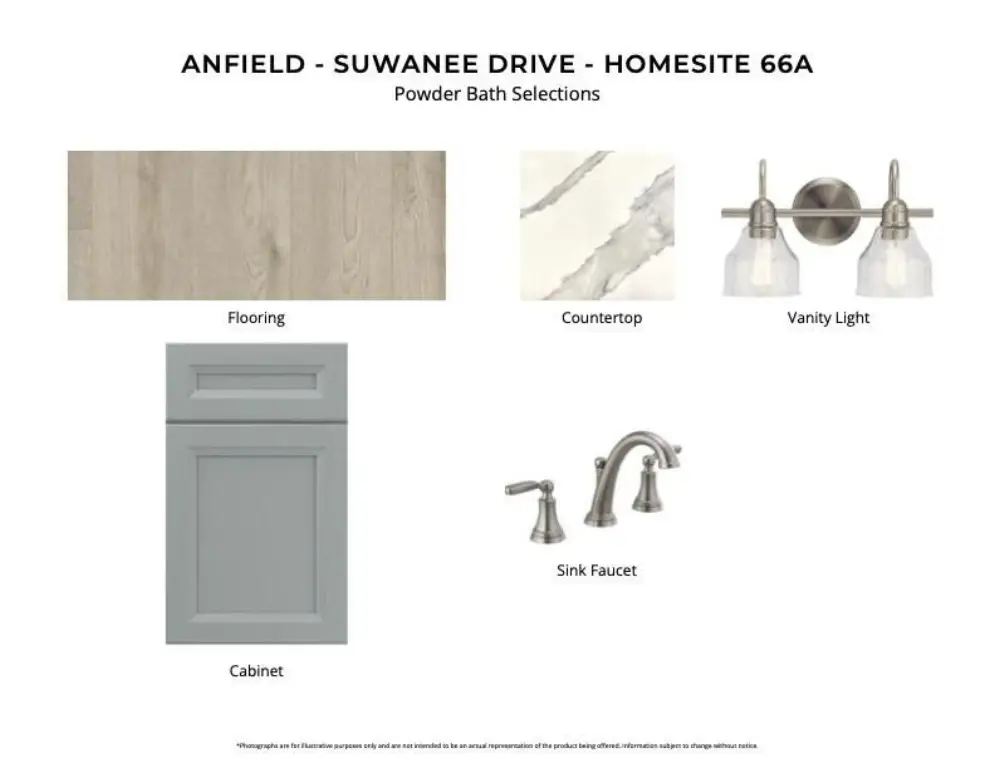
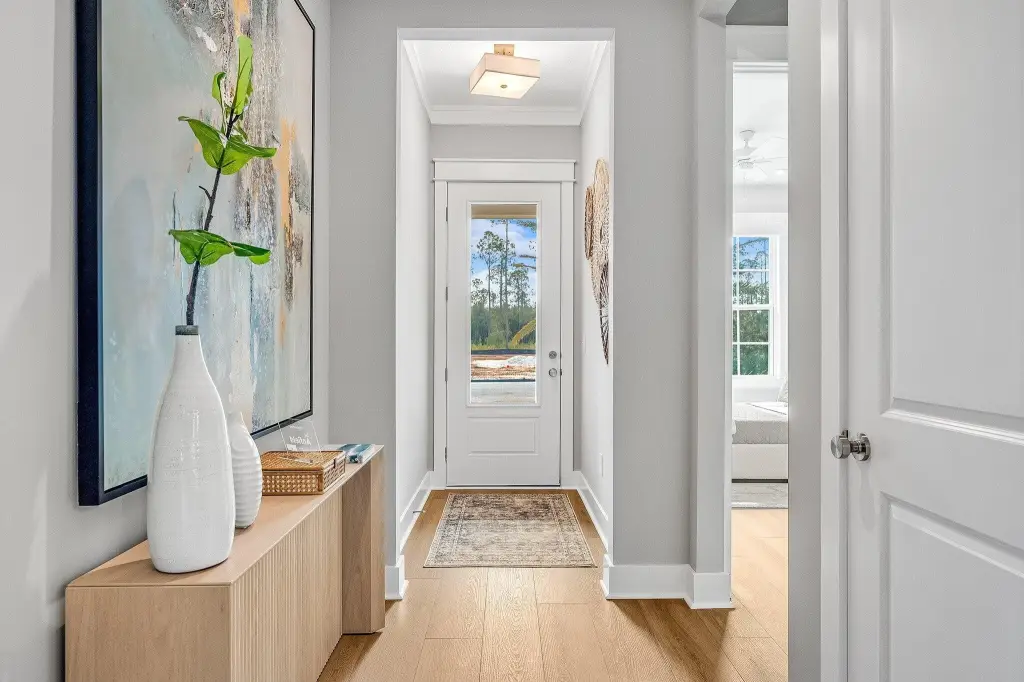
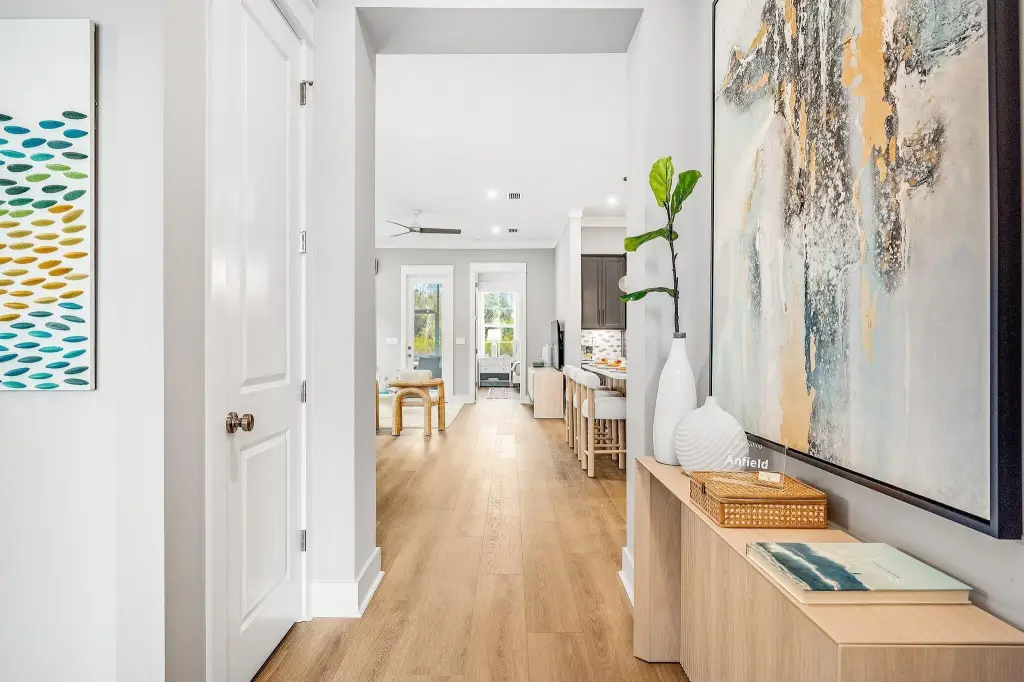
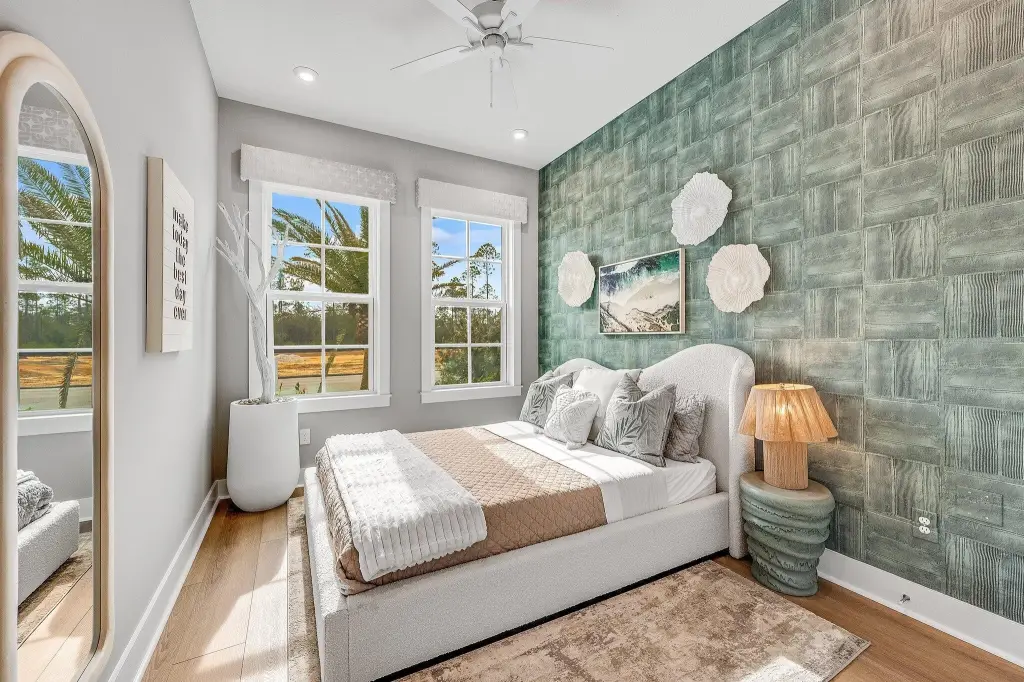
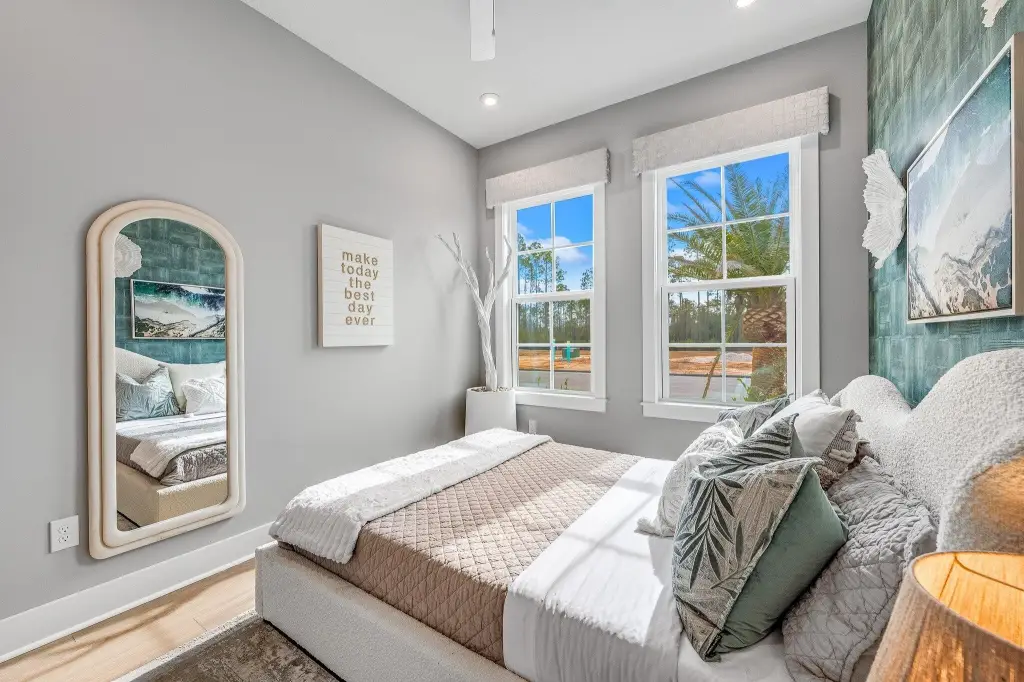
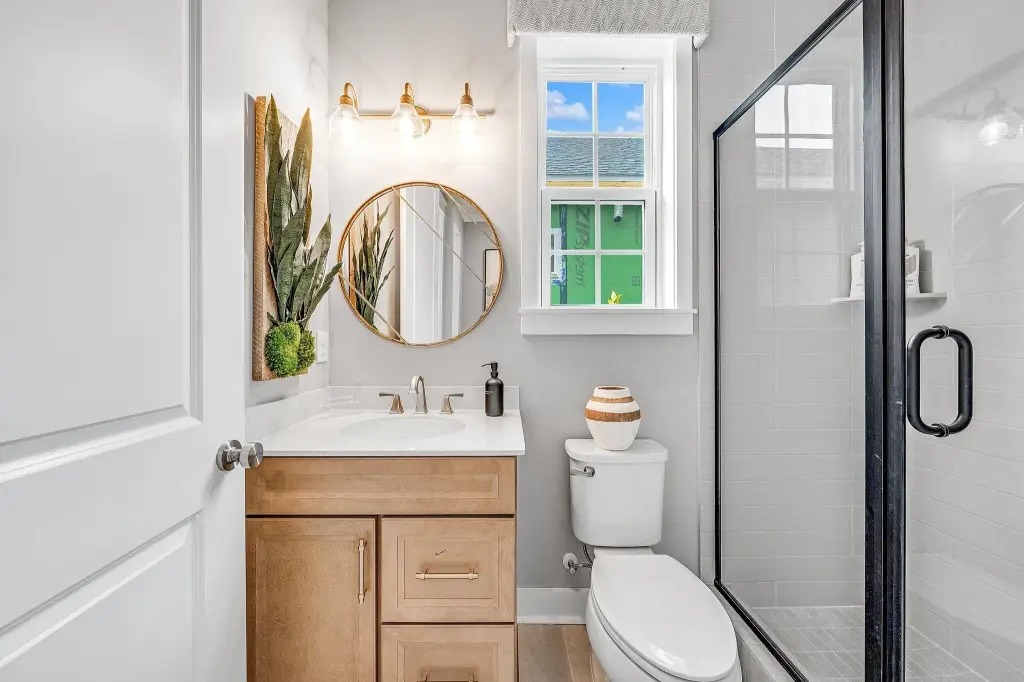
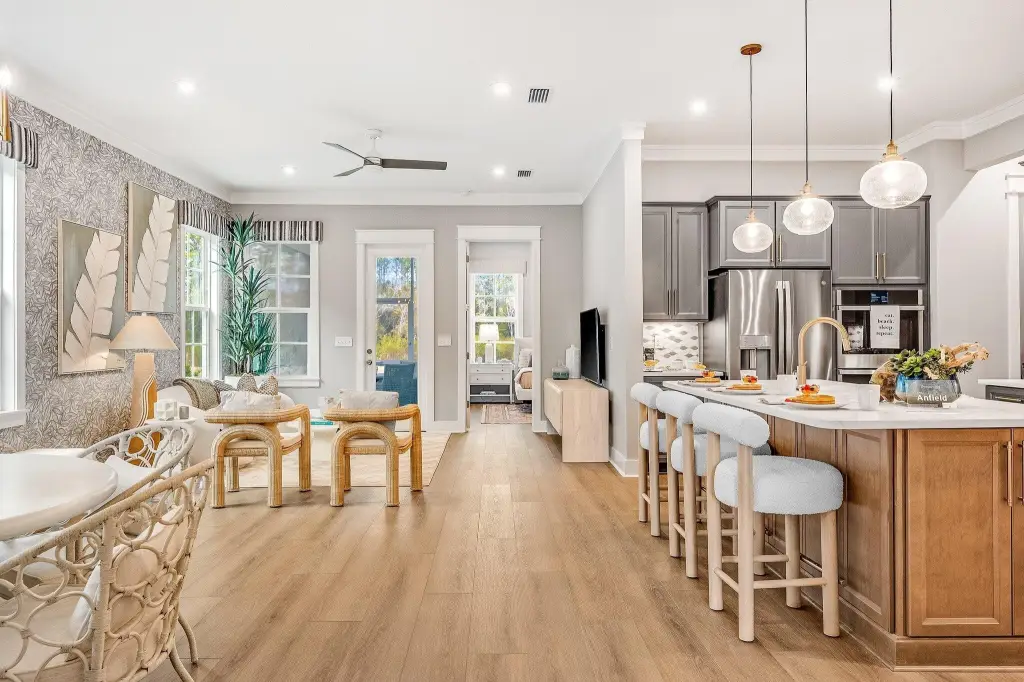
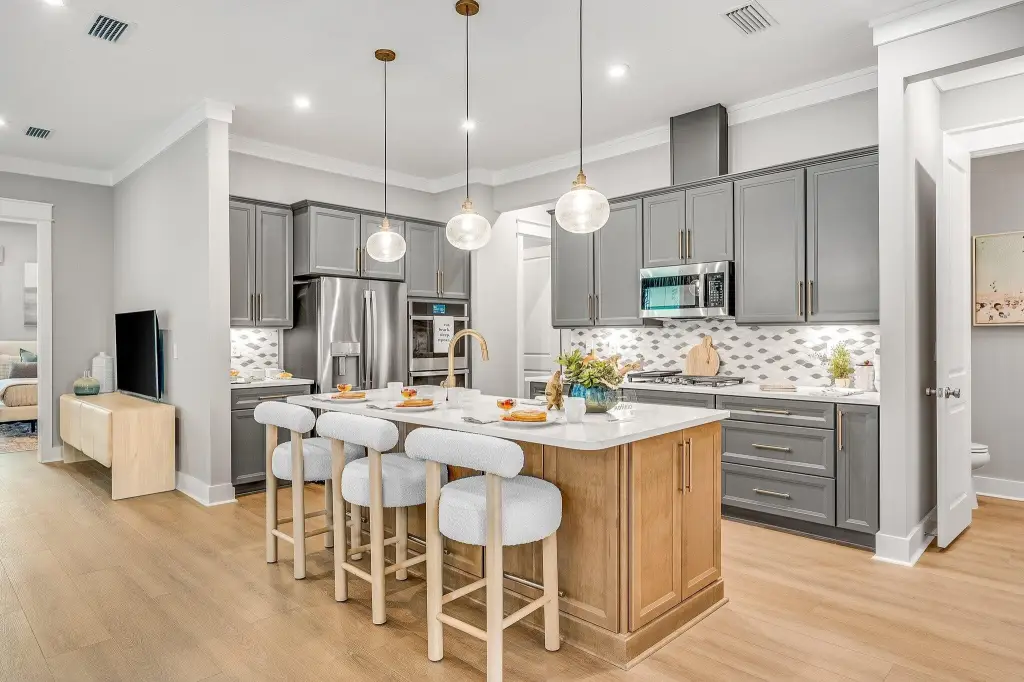
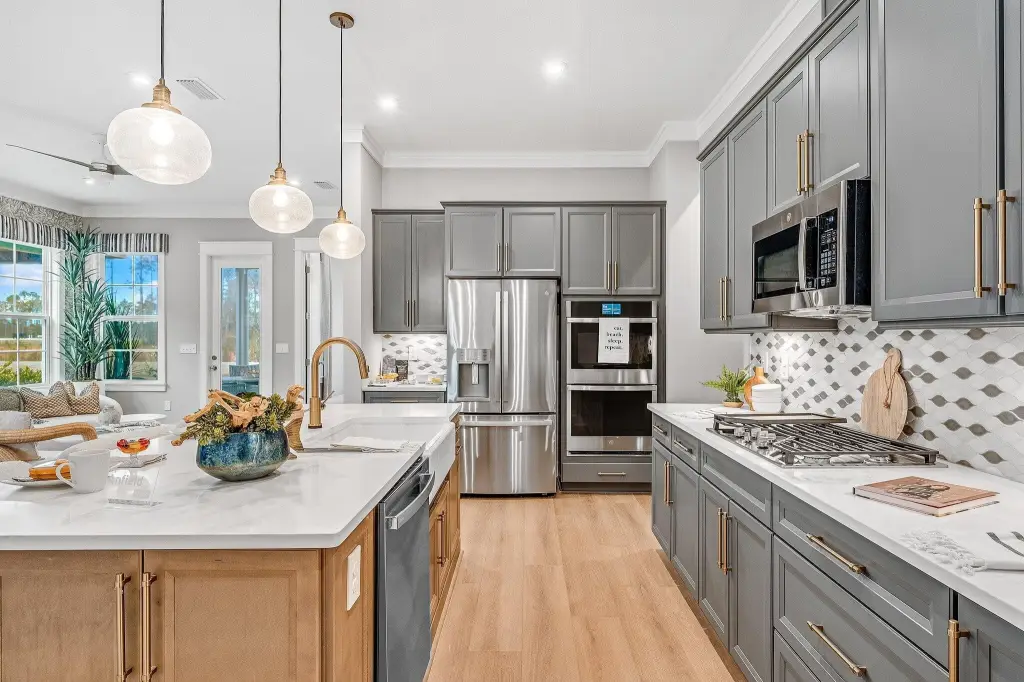
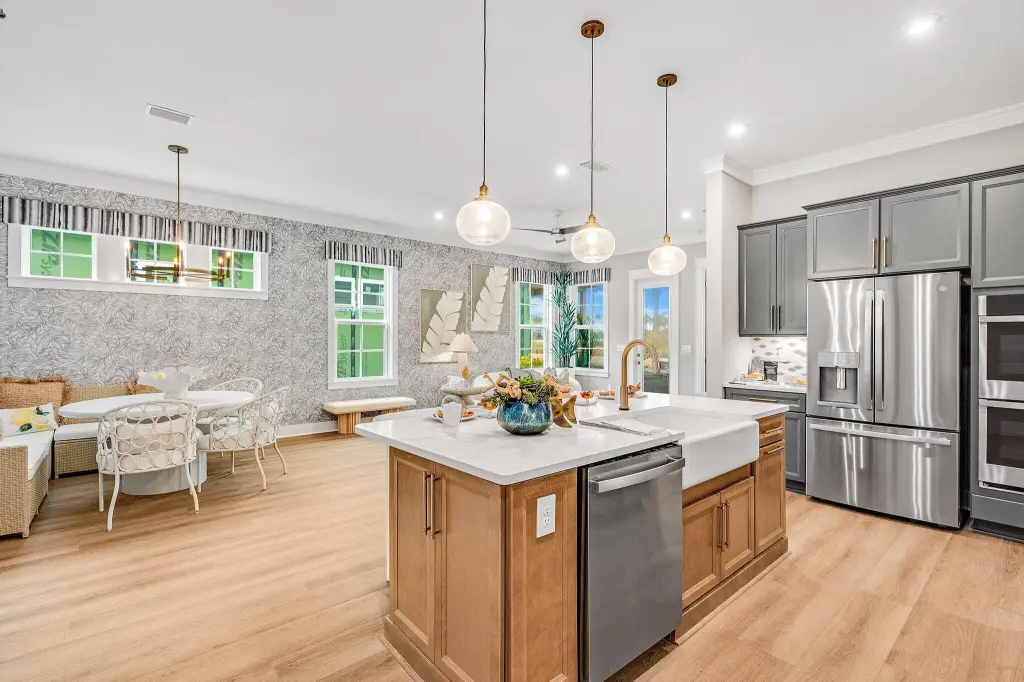
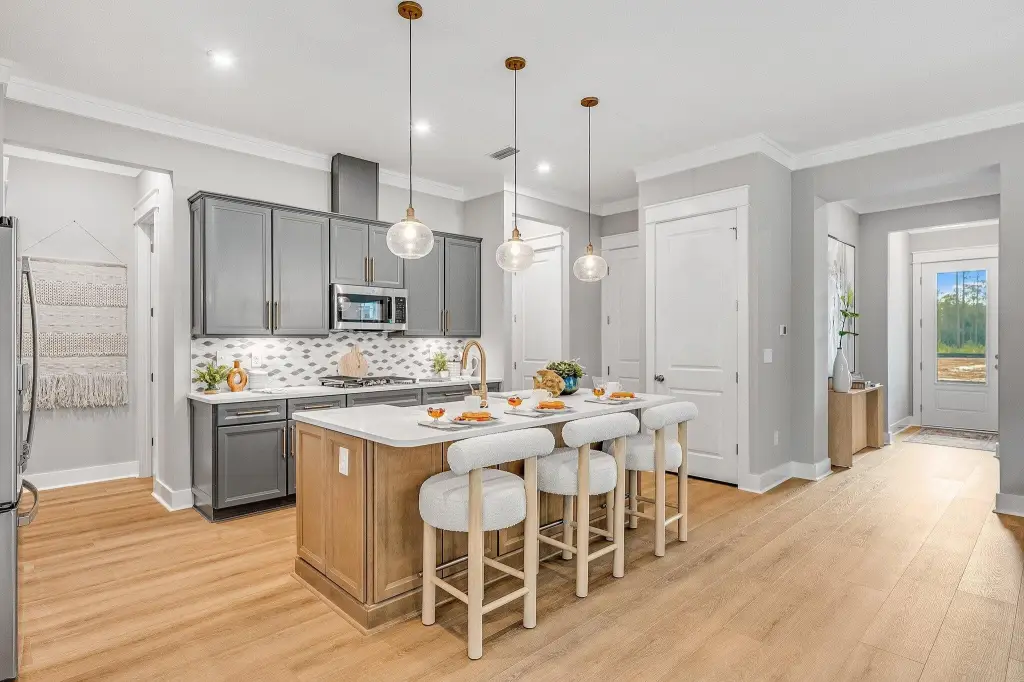
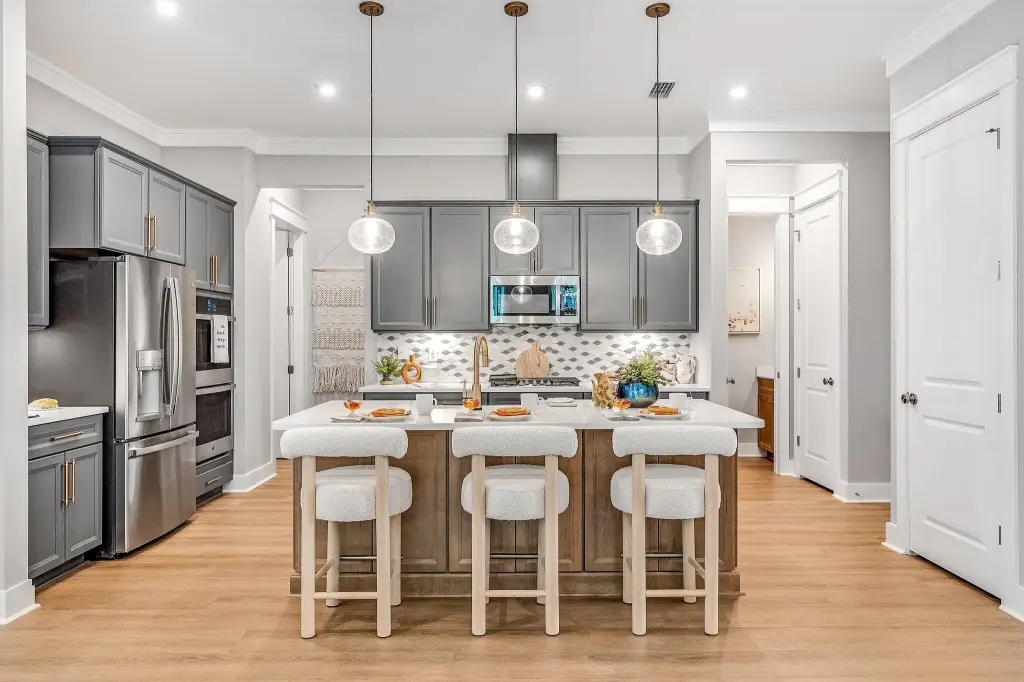
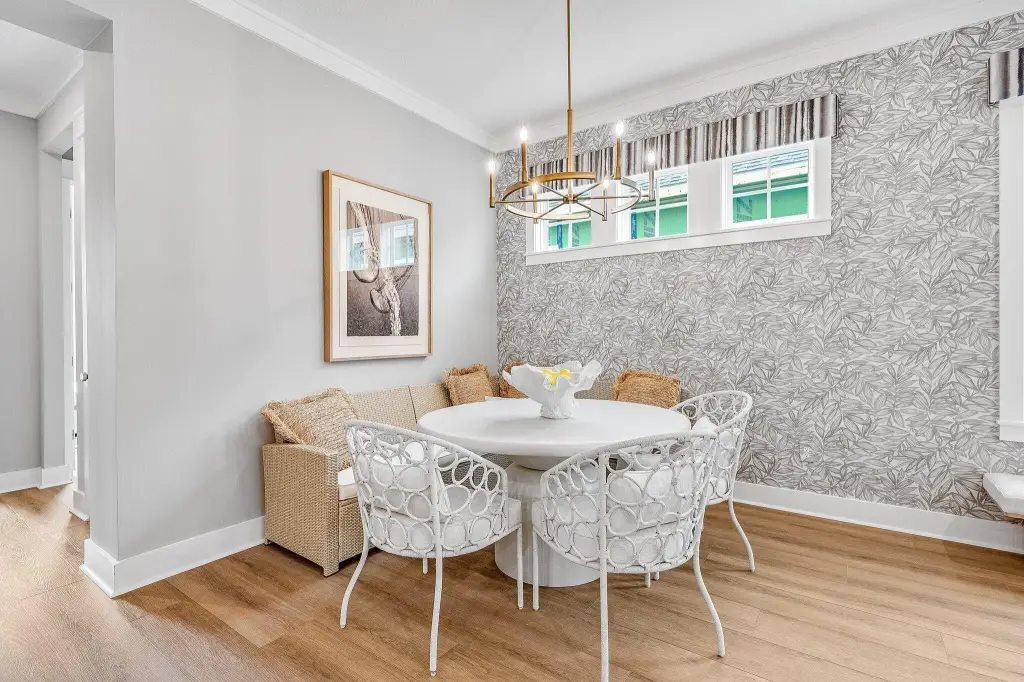
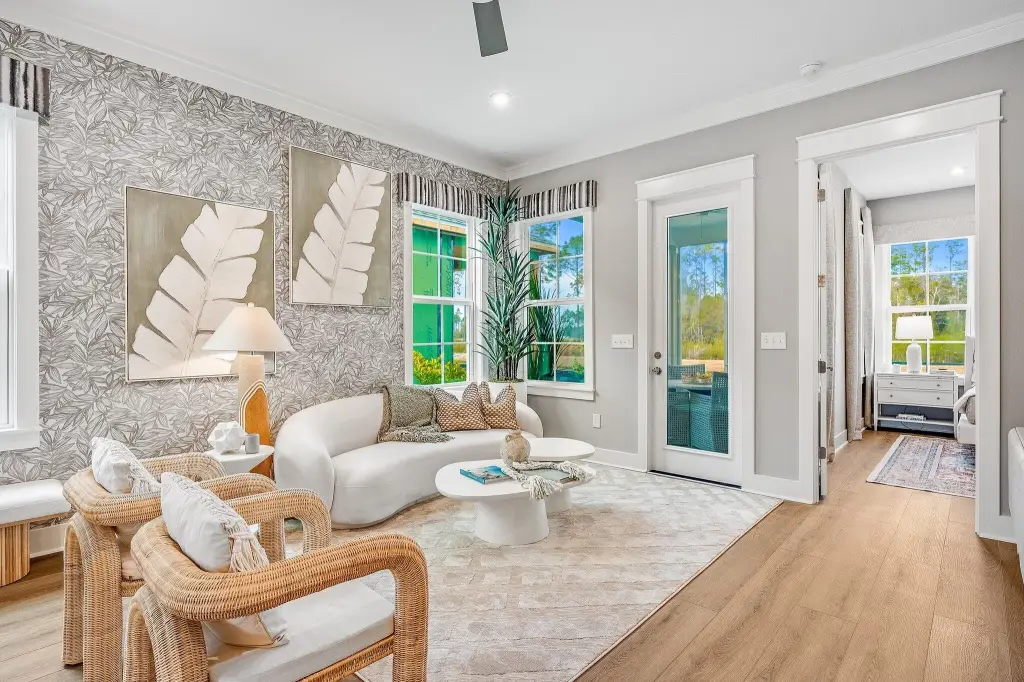
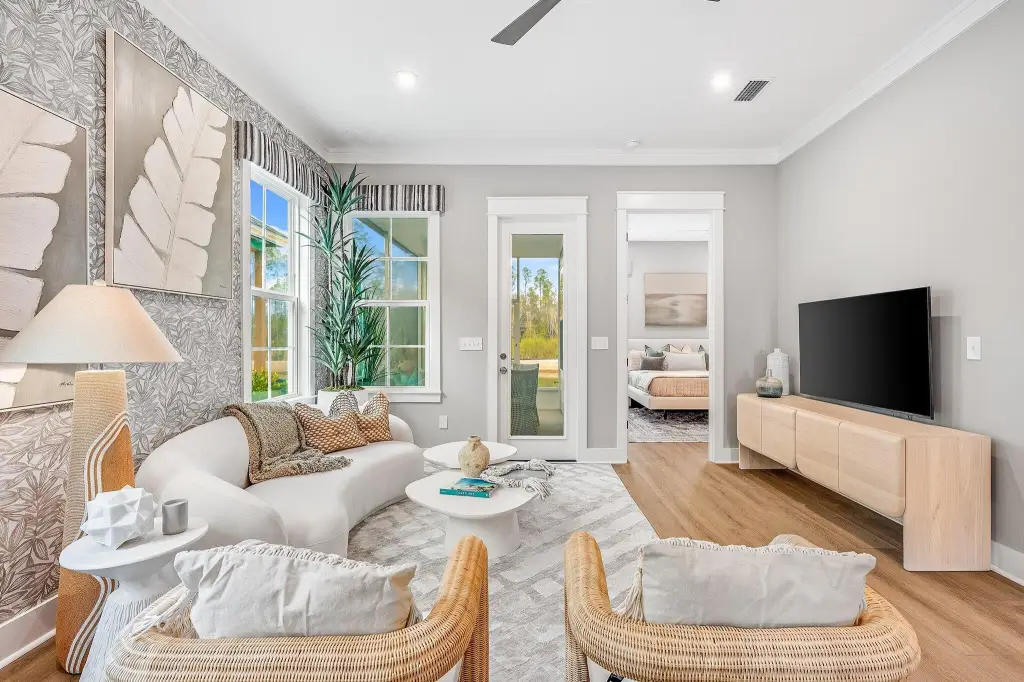
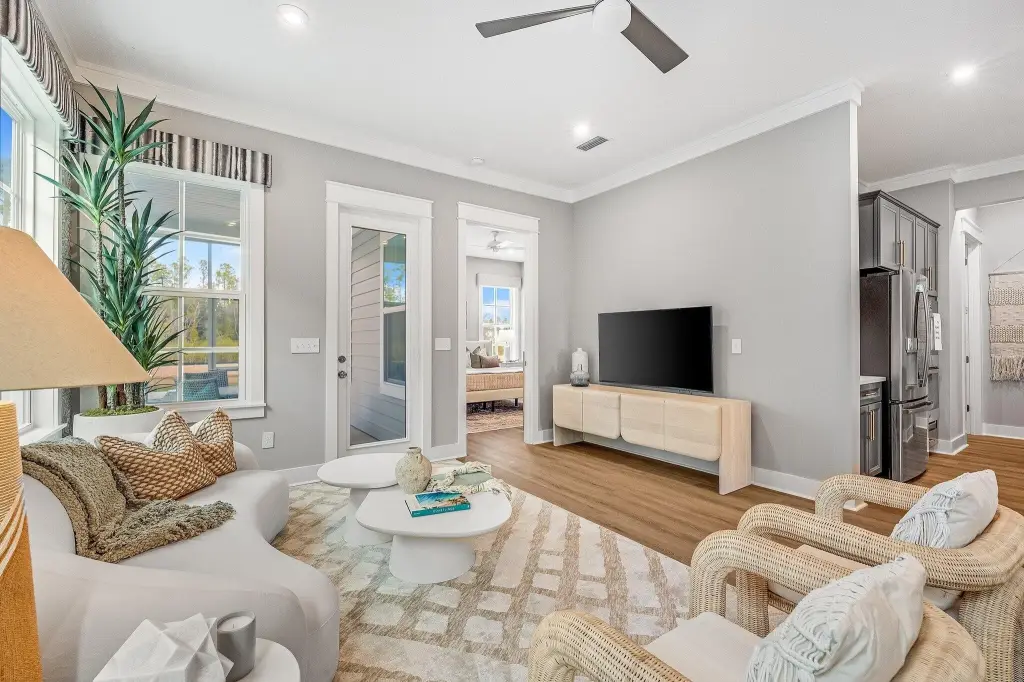
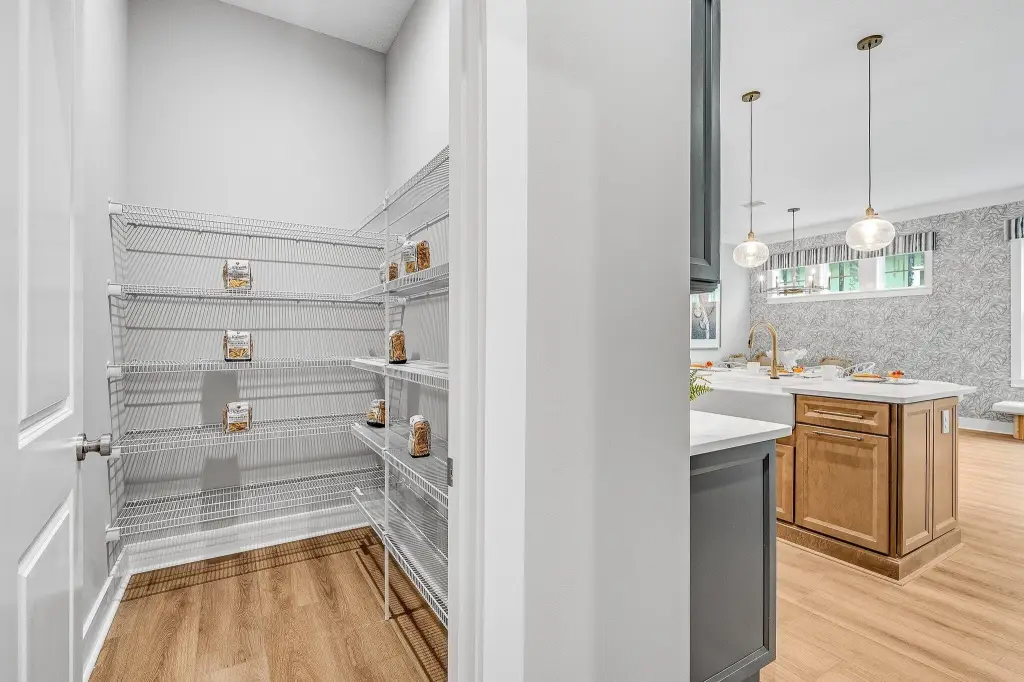
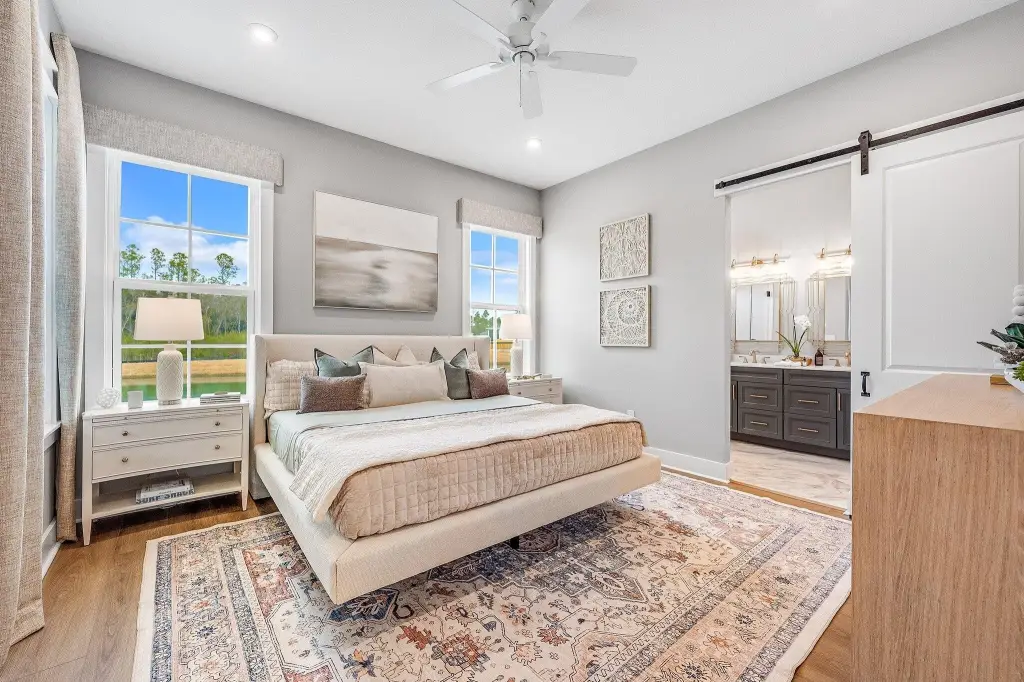
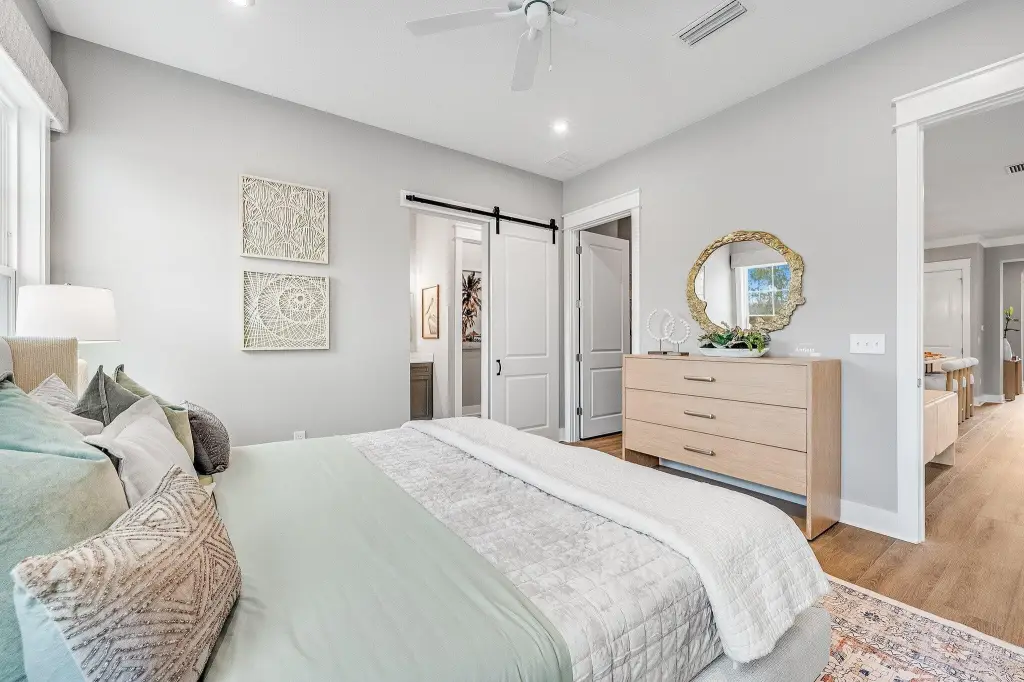
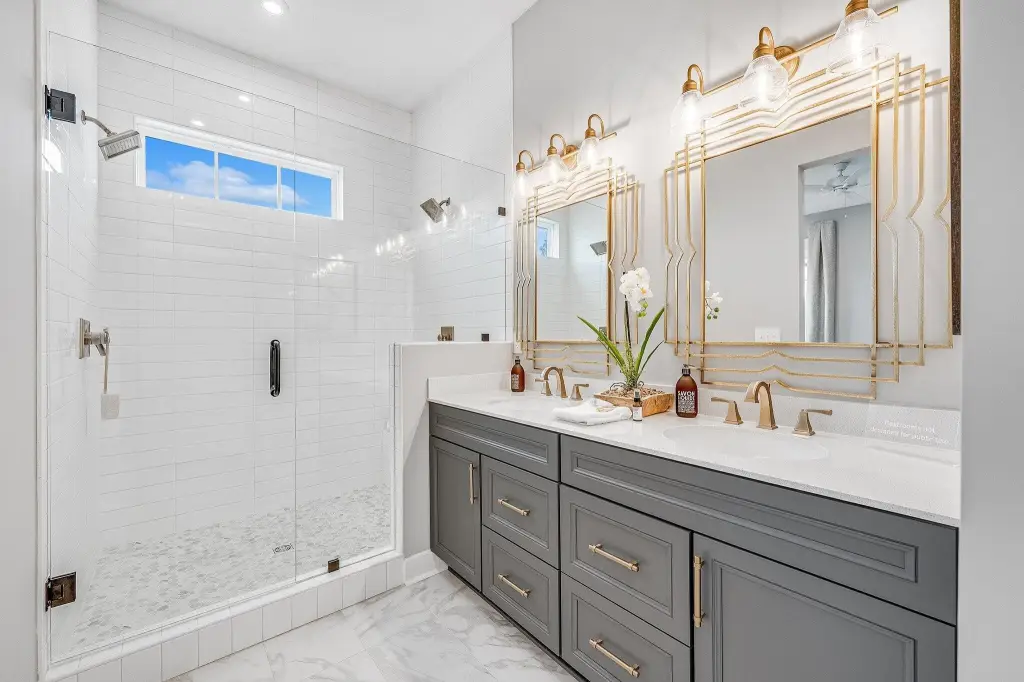
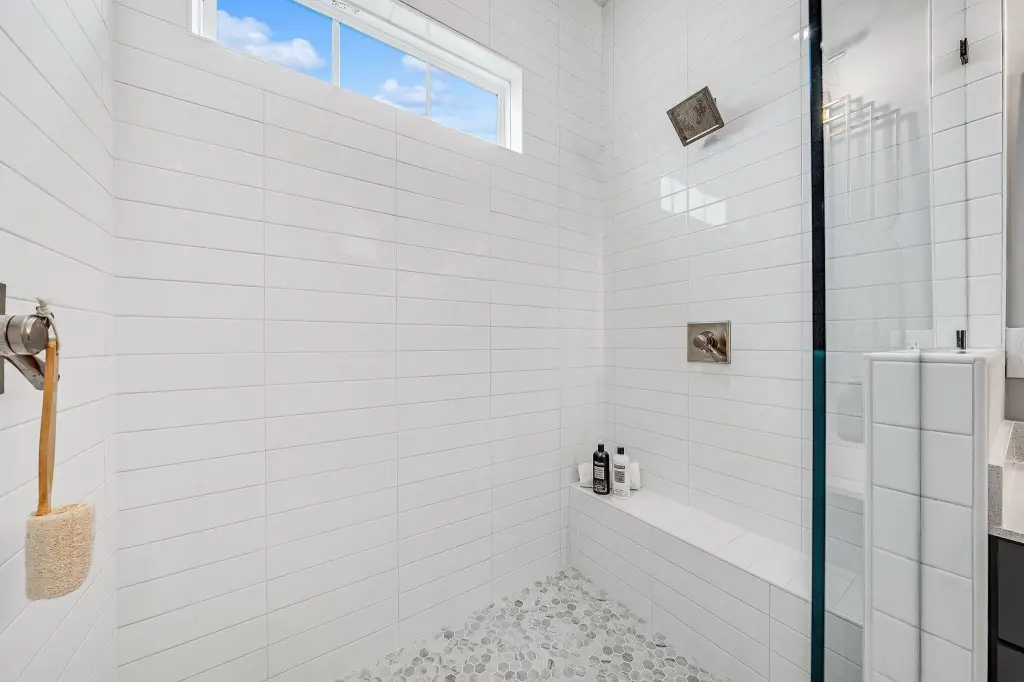
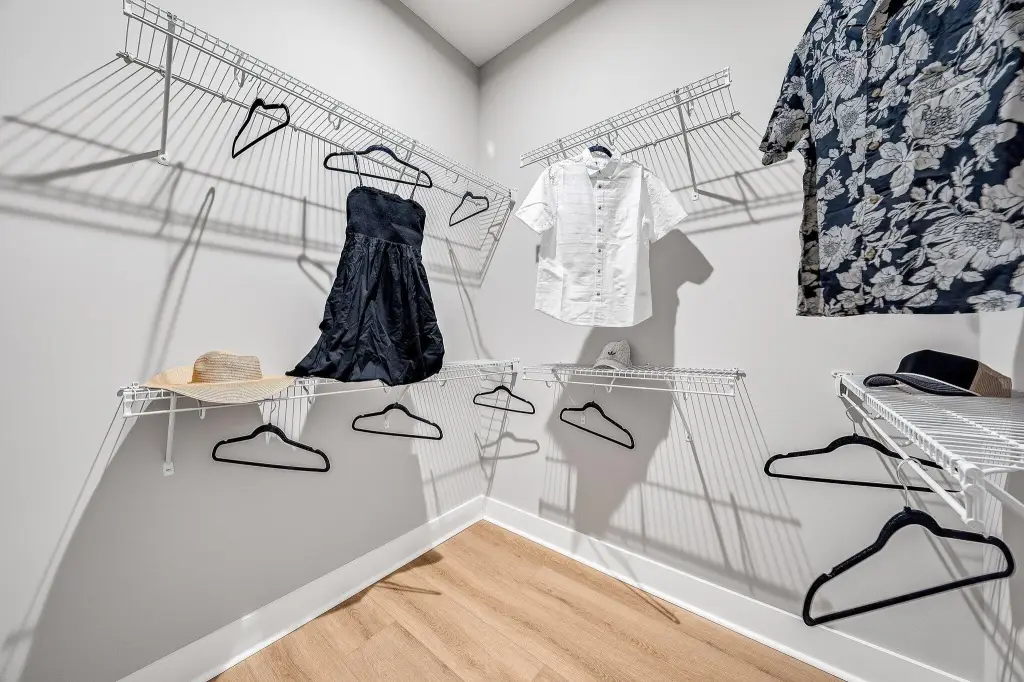
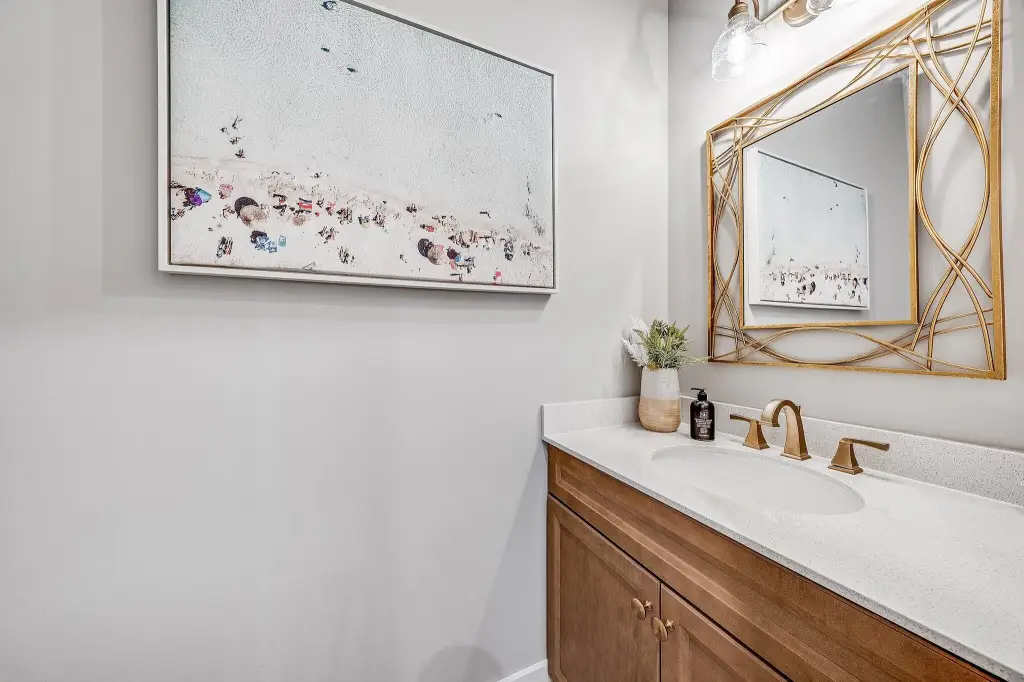
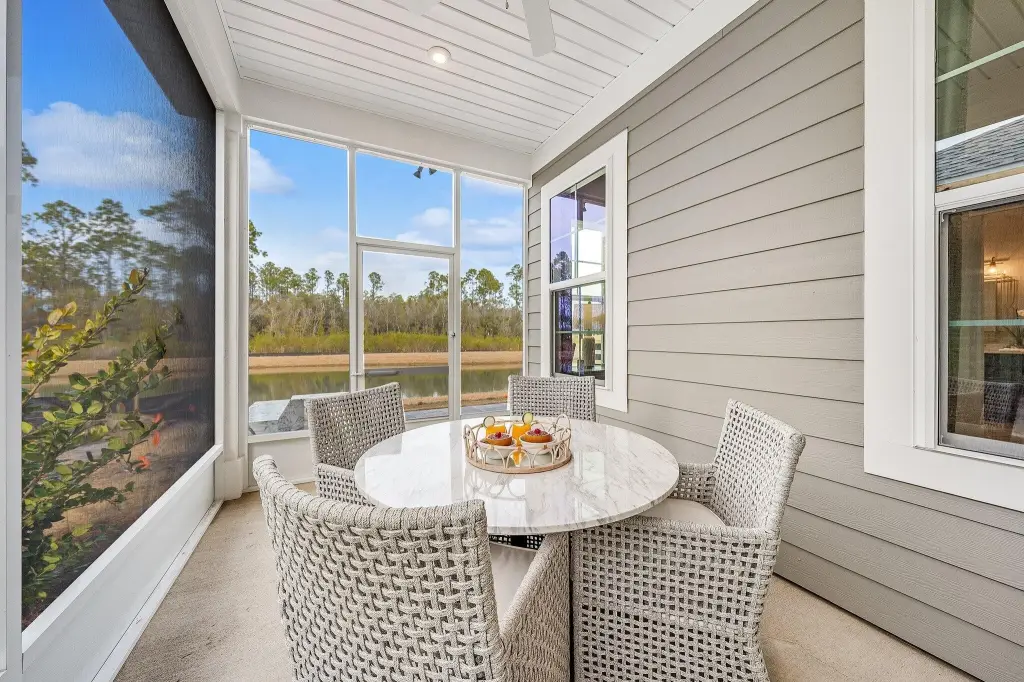
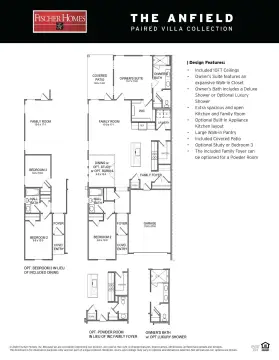
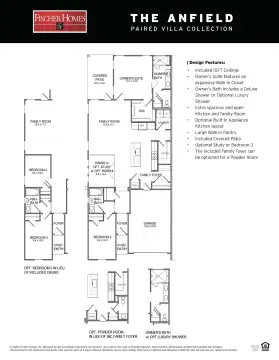
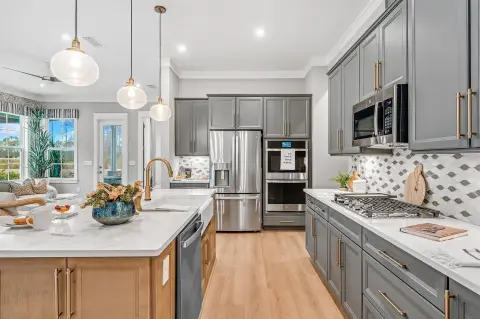
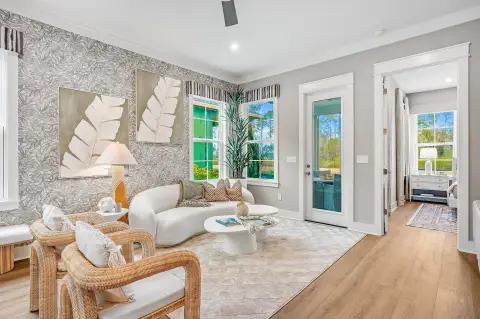
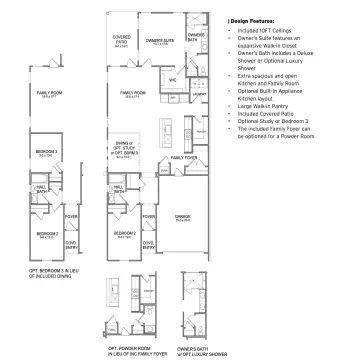
This two-unit townhome-style duplex is being built in the Villas at Longleaf Park within the Watersound Origins community. Each residence is planned with 2 bedrooms, 2.5 bathrooms, and a 1.5-car garage, with an open kitchen and family room. The interior design includes 10-foot ceilings and 8-foot interior doors, plus a covered rear patio accessible from the family room. Finishes and features listed include luxury vinyl plank flooring, craftsman-style trim, a Smart Home package, tankless water heater, and a GE appliance package with built-in appliances and a 5-burner gas cooktop. The kitchen is planned with upgraded soft-close cabinetry, Level 2 quartz countertops, an upgraded backsplash, and a large walk-in pantry. The owner's suite includes a spacious walk-in closet, upgraded tile flooring, Level 2 quartz countertops, and a luxury shower with dual showerheads. The residences also feature a structurally independent 2-hour fire separation wall with insulated framing and layered gypsum board for added privacy and sound separation, along with irrigation and exterior lawn maintenance included.
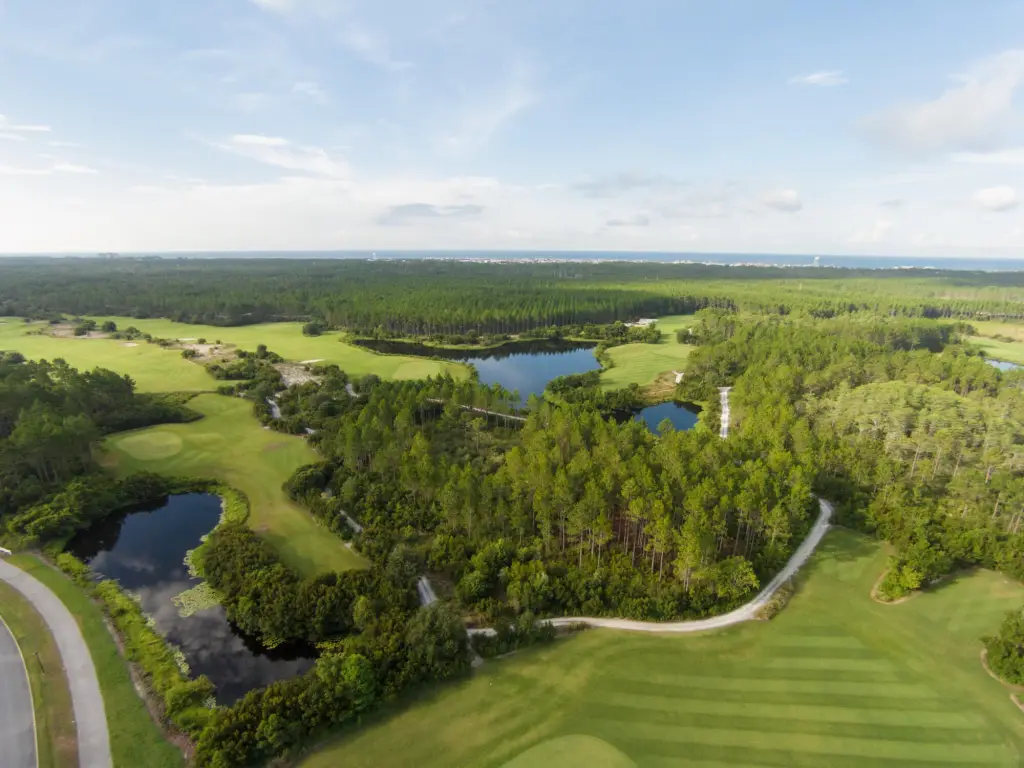
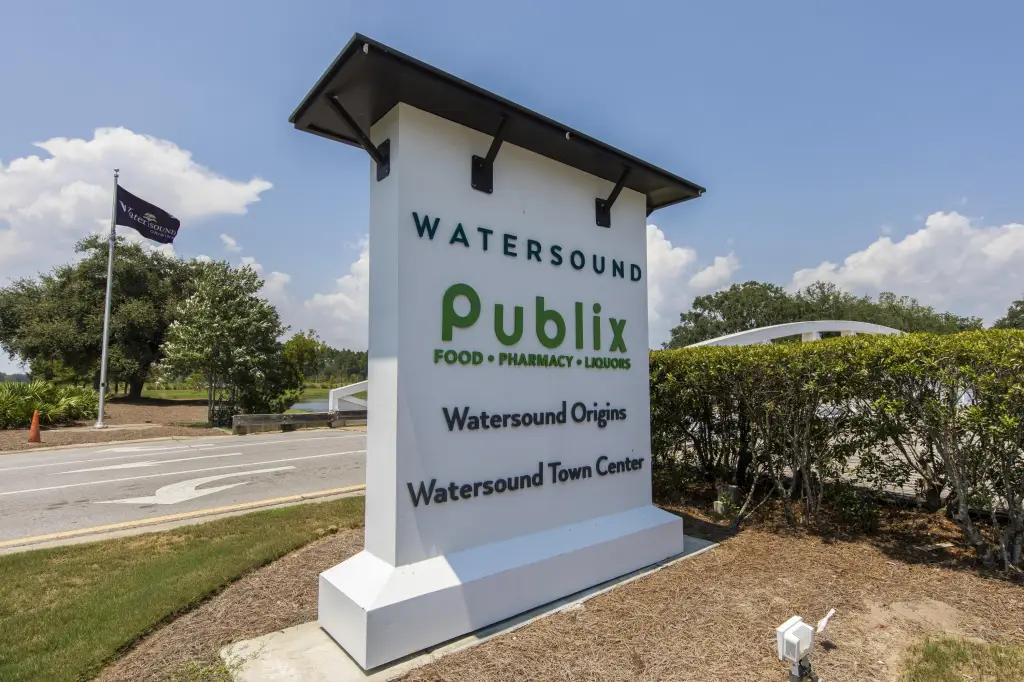
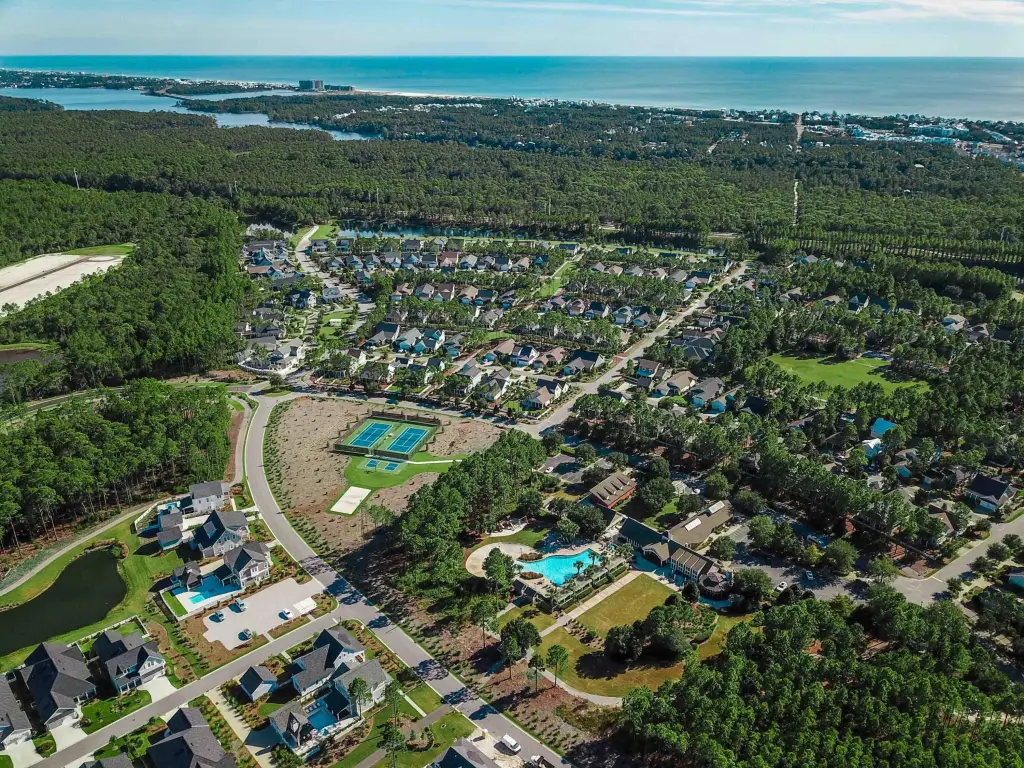
The property is located at 359 A Suwannee Drive in Watersound, Florida, within Longleaf Park at Watersound Origins. Public remarks note convenient access to Watersound Town Center, Publix, dining, medical offices, Highway 98, Village Commons, trails, and the Origins Golf Course.
Estimated completion is October/November 2026.
The property is located at 359 A Suwannee Drive in Watersound, Florida, within Longleaf Park at Watersound Origins. Public remarks note convenient access to Watersound Town Center, Publix, dining, medical offices, Highway 98, Village Commons, trails, and the Origins Golf Course.
Estimated completion is October/November 2026.
Key Highlights
- 1,442 SF Anfield plan with 2 bedrooms, 2.5 bathrooms, and a 1.5‑car garage in the Villas at Longleaf Park
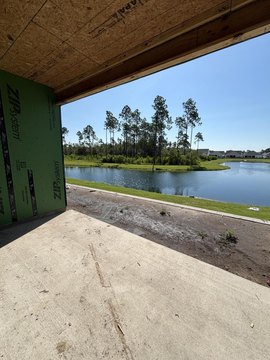
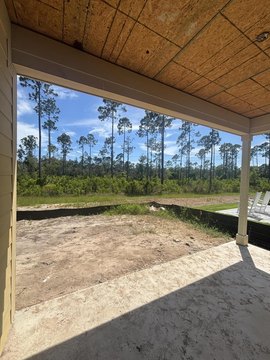
- Covered rear patio and sprinkler system, with the home on a wooded homesite
- 10‑foot ceilings and 8‑foot interior doors; open kitchen and family room with recessed lighting
Local Financial Insights For Multifamily LT 5
Simulate Cap Rate and NOI
NOI Build-Up
- Vacancy
- income lost from leasable area expected to sit empty during the year — subtracted from gross rent.
- EGI (Effective Gross Income)
- gross rent minus vacancy losses — the realistic income before paying operating costs.
- OpEx (Operating Expenses)
- recurring costs to operate the property (property tax, insurance, utilities, maintenance, management) — excludes financing and capital improvements.
- NOI (Net Operating Income)
- income a property generates after operating costs but before financing and taxes.
| Component | $ | $/SF |
|---|---|---|
| Gross rent | $29.4k | $20.40 |
| − Vacancy | −$4.5k | −$3.12 |
| EGI | $24.9k | $17.28 |
| − OpEx | −$7.5k | −$5.18 |
| NOI | $17.4k | $12.10 |
1,442 SF · lease $20.40/SF/yr · vacancy 15.29% · expense 30.00%
Alternative Uses
Best Use
Multifamily LT 5
$249.2K
$218.0K – $290.7K
NOI $17,443 @ 7.0% cap · market cap 3.19%
Second Best
Apartment 5plus
$228.1K
$199.6K – $266.2K
NOI $15,970 @ 7.0% cap · market cap 2.92%
Theoretical Best
Office A
$362.6K
$317.3K – $423.1K
NOI $25,385 @ 7.0% cap · market cap 4.64%
Zoning and permitted uses should be independently verified with local authorities.
Property Analytics
Property Profile
Location Intelligence
Current Use by Public Records
Duplexes
Similar For Sale Nearby
FAQs
What type of property is this?
Duplex - Duplex residences with covered rear patio, open kitchen-family room, and impact-rated windows; estimated completion Oct/Nov 2026.
Where is this duplex located?
The property is located at 359 A Suwannee Drive Watersound, FL.
What is the asking price?
The asking price for this property is $547,460.
What are key features of this property?
This property features: 1,442 SF Anfield plan with 2 bedrooms, 2.5 bathrooms, and a 1.5‑car garage in the Villas at Longleaf Park; Covered rear patio and sprinkler system, with the home on a wooded homesite; 10‑foot ceilings and 8‑foot interior doors; open kitchen and family room with recessed lighting


