Colonial Duplex with Detached
For Sale
$730,000
357 Gray St, Manchester, NH 03103
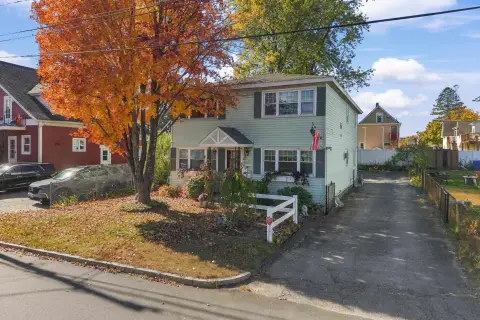
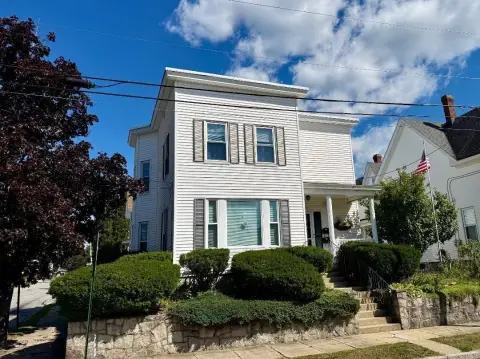
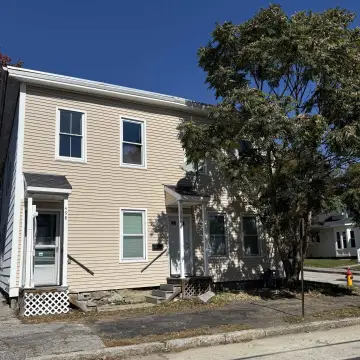
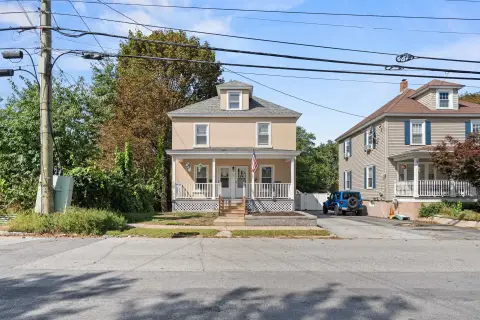
Well-maintained duplex offers two sizable units, a partially finished basement, and a detached two-car garage.
Property Size3,080 SF
Price / SF$237.01
Days on Market98
Property Features for 357 Gray St
General Information
Standard status
Active
Size
3,080 SF
Property subtype
Multi-Family
Site & Location
Neighborhood
Somerville
Additional Details
Multifamily Units
2
Building Details
Year Built
1983
Construction
Colonial
Tenancy
Multi
Listing Agency:
RE/MAX Synergy
Listed By:
Richard Valentin Gutierrez · License #75620
(603) 854-1768
Source:
Amranifinehome
Added: Jul 21
Changed: Oct 25
Last Checked: Oct 7 at 3:37PM
Displayed information is deemed reliable but is not guaranteed and should be independently verified. All listing content including descriptions, pricing, images are the copyrighted material of RE/MAX Synergy

Ask AI about this property
Review the available facts, identify missing information and prepare questions for the agent.
Investment Insights
Based on property information with market context.
This spacious, well-maintained Colonial-style duplex features two generously sized units and a valid Certificate of Compliance. The first-floor owner’s unit includes four bedrooms and two baths, with an open-concept living room and an eat-in kitchen, plus a full bath with laundry on the main level. A partially finished basement adds additional living space with a recreation area, utility/workshop space, and a private primary suite with its own three-quarter bathroom.
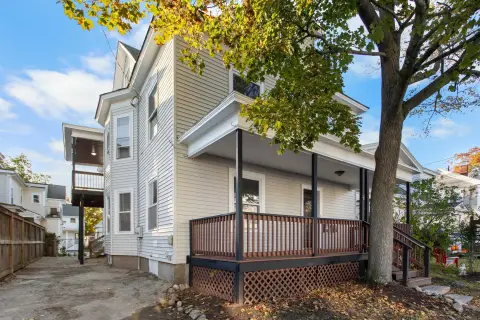
The second-floor garden-style apartment offers three bedrooms and one full bath and includes a private rear entrance. This unit has been recently renovated with an updated kitchen featuring stainless steel appliances, soft-close cabinetry, dovetail drawers, and granite countertops, along with luxury vinyl plank flooring. The bathroom has also been updated with granite countertops and luxury vinyl flooring.
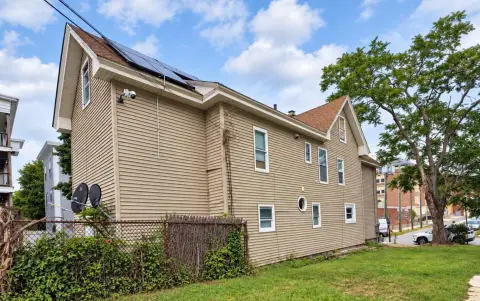
Outside, the property includes an oversized detached two-car garage with shelving and workshop space, along with a driveway accommodating 4–6 additional vehicles. An eight-zone irrigation system with drip lines is included, and the home is equipped with leased solar panels that transfer at closing.
The second-floor garden-style apartment offers three bedrooms and one full bath and includes a private rear entrance. This unit has been recently renovated with an updated kitchen featuring stainless steel appliances, soft-close cabinetry, dovetail drawers, and granite countertops, along with luxury vinyl plank flooring. The bathroom has also been updated with granite countertops and luxury vinyl flooring.
Outside, the property includes an oversized detached two-car garage with shelving and workshop space, along with a driveway accommodating 4–6 additional vehicles. An eight-zone irrigation system with drip lines is included, and the home is equipped with leased solar panels that transfer at closing.
Key Highlights
- 1983 Colonial‑style duplex with a valid Certificate of Compliance
- First‑floor unit: 4 bedrooms, 2 full baths, plus partially finished basement with recreation area and private primary suite with 3/4 bath
- Second‑floor garden‑style unit: 3 bedrooms and 1 full bath with a private rear entrance; recently renovated with a new kitchen and updated electrical outlets
Financial Insights
Estimated NOI and Cap Rate
NOI / Yr
$41,563
Cap Rate
5.69%
Suggested Prices Based on Cap Rates
Cap Rate 5%
$831,260
$831.3K
Cap Rate 7%
$593,757
$593.8K
Cap Rate 9%
$461,811
$461.8K
Market Conditions
NOI Build-Up for 3,080 SF
Gross rent
$62.8K $20.40/SF
− Vacancy
−$3.5K −$1.12/SF
EGI
$59.4K $19.28/SF
− OpEx
−$17.8K −$5.78/SF
NOI
$41.6K $13.49/SF
Area
Manchester, NH
Vacancy
5.50%
Lease Rate
$20.40 /SF/Yr
Expense Ratio
30.00%
Simulate Cap Rate and NOI
Suggested Prices Based on Cap Rates
Cap Rate 5%
$831,260
Cap Rate 7%
$593,757
Cap Rate 9%
$461,811
Alternative Uses
Best Use
Multifamily LT 5
$593.8K
$519.5K – $692.7K
NOI $41,563 @ 7.0% cap · market cap 5.69%
Second Best
Apartment 5plus
$552.9K
$483.8K – $645.1K
NOI $38,705 @ 7.0% cap · market cap 5.30%
Theoretical Best
Specialty Retail
$756.4K
$661.8K – $882.4K
NOI $52,945 @ 7.0% cap · market cap 7.25%
Zoning and permitted uses should be independently verified with authorities.
How Realmo checks its estimates
Property Analytics
Contact the owner directly
Get the owner's phone numbers and email
Open Analytics
Lease Details
2
Residential units
Multi-tenant
Tenancy
Location Intelligence
Trade Area within ½ mile
1,336
Businesses Nearby
Explore this area
Business Placement
Demographics for 03103, NH
38,039
Population
16,166
Households
2.4
Avg Household Size
36
Median Age
24%
College-Educated
82%
High-School Grad
9.2 sq mi
ZIP Area
4,135
Density / Sq Mi
$70,049
Median Household Income
$41,243
Median Earnings
$1,322
Median Rent
$313,500
Median Home Value
Check the figures for this property
Cap Rate, Value Estimation, Potential NOI and more
View Realmo Analytics
Market
Vacancy Rate% for Multifamily in Northeast region






Frequently Asked Questions
What type of property is this?
Duplex - Well-maintained duplex offers two sizable units, a partially finished basement, and a detached two-car garage.
Where is this duplex located?
The property is located at 357 Gray St Manchester, NH.
What is the asking price?
The asking price for this property is $730,000.
What are key features of this property?
This property features: 1983 Colonial‑style duplex with a valid Certificate of Compliance; First‑floor unit: 4 bedrooms, 2 full baths, plus partially finished basement with recreation area and private primary suite with 3/4 bath; Second‑floor garden‑style unit: 3 bedrooms and 1 full bath with a private rear entrance; recently renovated with a new kitchen and updated electrical outlets


