Multi-Tenant Office
For Sale
$3,250,000
3544 17th Street #1&3, Idaho Falls, ID 83406
Office property with a restaurant component, shared amenities, and substantial on-site parking.
Property Size26,967 SF
Price / SF$120.52
Days on Market66
Property Features for 3544 17th Street #1&3
General Information
Standard status
Active
Size
26,967 SF
Building Details
Year Built
2006
Listing Agency:
Venture One Properties
Listed By:
Shane Murphy · License #DB24210
(208) 542-7979
Source:
Griderpeterson
Added: Aug 10
Changed: Oct 6
Last Checked: Oct 6 at 12:28AM
Displayed information is deemed reliable but is not guaranteed and should be independently verified. All listing content including descriptions, pricing, images are the copyrighted material of Venture One Properties
Investment Insights
Based on property information with market context.
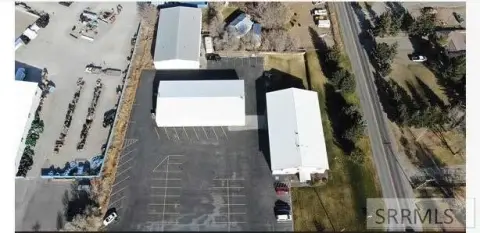
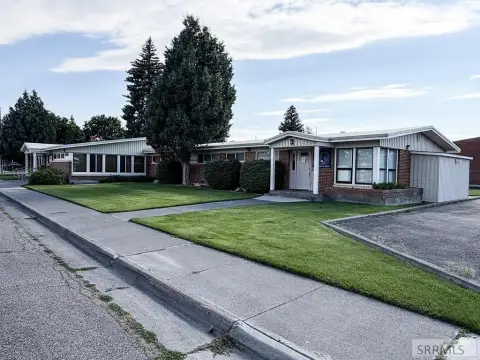
Eagle Pines Plaza is a multi-tenant commercial property developed in 2006. The improvements include a 22,967 SF professional office building with multiple tenants and a separate 4,000 SF restaurant building positioned on a corner lot. Shared features include two upper-level balconies and a common kitchen and break-room area.
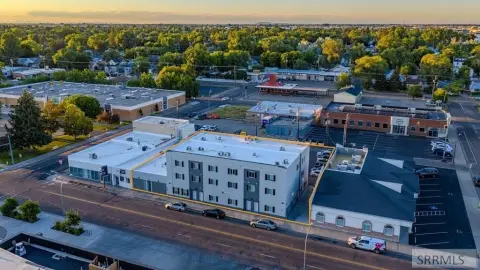
The property occupies approximately 2 acres at 3544 17th Street #1&3 in Idaho Falls, Idaho. On-site parking totals 129 spaces. The site is located near hospitals and shopping areas, providing a setting that accommodates both office and restaurant operations within one commercial property.
The property occupies approximately 2 acres at 3544 17th Street #1&3 in Idaho Falls, Idaho. On-site parking totals 129 spaces. The site is located near hospitals and shopping areas, providing a setting that accommodates both office and restaurant operations within one commercial property.
Key Highlights
- 22,967 SF professional office building with multiple tenants
- Separate 4,000 SF corner‑lot restaurant building
- Approximately 2 acres at 3544 17th Street #1&3
Financial Insights
Estimated NOI and Cap Rate
NOI / Yr
$292,214
Cap Rate
8.99%
Suggested Prices Based on Cap Rates
Cap Rate 5%
$5,844,280
$5.8M
Cap Rate 7%
$4,174,486
$4.2M
Cap Rate 9%
$3,246,822
$3.2M
Market Conditions
NOI Build-Up for 26,967 SF
Gross rent
$453.0K $16.80/SF
− Vacancy
−$63.4K −$2.35/SF
EGI
$389.6K $14.45/SF
− OpEx
−$97.4K −$3.61/SF
NOI
$292.2K $10.84/SF
Area
Bonneville County, ID
Vacancy
14.00%
Lease Rate
$16.80 /SF/Yr
Expense Ratio
25.00%
Simulate Cap Rate and NOI
Suggested Prices Based on Cap Rates
Cap Rate 5%
$5,844,280
Cap Rate 7%
$4,174,486
Cap Rate 9%
$3,246,822
Alternative Uses
Best Use
Specialty Retail
$4.56M
$3.99M – $5.32M
NOI $319,458 @ 7.0% cap · market cap 9.83%
Second Best
Office B
$4.17M
$3.65M – $4.87M
NOI $292,214 @ 7.0% cap · market cap 8.99%
Theoretical Best
Office A
$5.96M
$5.21M – $6.95M
NOI $417,061 @ 7.0% cap · market cap 12.83%
Zoning and permitted uses should be independently verified with authorities.
How Realmo checks its estimates
Property Analytics
Current Use
Location Intelligence
Trade Area within ½ mile
413
Businesses Nearby
Explore this area
Business Placement
Demographics for 83406, ID
19,003
Population
6,837
Households
2.8
Avg Household Size
32
Median Age
37%
College-Educated
95%
High-School Grad
32.0 sq mi
ZIP Area
594
Density / Sq Mi
$90,654
Median Household Income
$39,189
Median Earnings
$1,182
Median Rent
$350,500
Median Home Value
Market
Vacancy Rate% for Office in West region

Questions? Ask Rey
Realmo’s AI knows this listing — price, zoning, demand, history. Ask anything.





Frequently Asked Questions
What type of property is this?
Office building - Office property with a restaurant component, shared amenities, and substantial on-site parking.
Where is this office building located?
The property is located at 3544 17th Street #1&3 Idaho Falls, ID.
What is the asking price?
The asking price for this property is $3,250,000.
What are key features of this property?
This property features: 22,967 SF professional office building with multiple tenants; Separate 4,000 SF corner‑lot restaurant building; Approximately 2 acres at 3544 17th Street #1&3


