18-Unit Apartment
For Sale
Contact for pricing
Pending
3443 Marshall Road, Drexel Hill, PA 19026
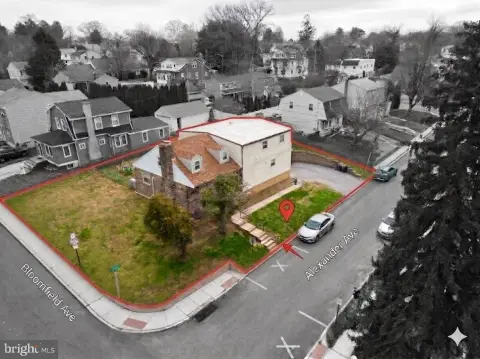
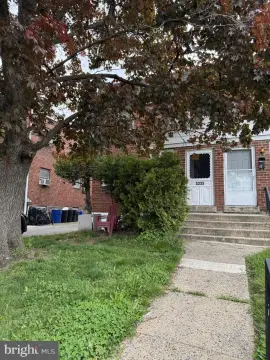
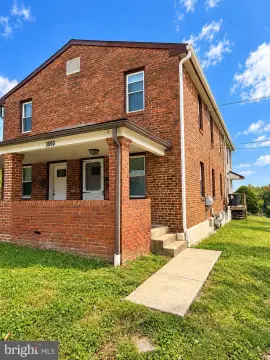
Two nearby apartment buildings offer varied unit layouts, laundry facilities, and on-site as well as street parking.
Property Size16,150 SF
Days on Market177
Property Features for 3443 Marshall Road
General Information
Standard status
Pending
Size
16,150 SF
Property subtype
Multifamily
Building Details
Year Built
1968
Buildings
2
Listing Agency:
Marcus & Millichap - Philadelphia
Listed By:
Andrew Townsend · License #DE RS-0019885
(215) 531-7000
Source:
Crexi
Added: Apr 23
Changed: Oct 3
Last Checked: Oct 16 at 7:39AM
Displayed information is deemed reliable but is not guaranteed and should be independently verified. All listing content including descriptions, pricing, images are the copyrighted material of Marcus & Millichap - Philadelphia

Ask AI about this property
Review the available facts, identify missing information and prepare questions for the agent.
Investment Insights
Based on property information with market context.
This 18-unit apartment portfolio comprises two buildings positioned around the corner from one another at 3443 Marshall Road and 3709–3715 Randolph Street. The combined unit mix includes two studio apartments and sixteen two-bedroom apartments. The Randolph Street building is arranged across four deeded parcels and contains one triplex plus three duplexes. Marshall Road provides shared laundry, while selected Randolph Street units have in-unit washers and dryers. The properties were built in 1968 and total 16,150 square feet.
Parking is available both on the street and on-site, with spaces located behind and in front of the buildings. The properties are near the center of Drexel Hill, within walking distance of shops, restaurants, and a trolley stop. Drexel Hill is part of Upper Darby Township in Delaware County, Pennsylvania.
Parking is available both on the street and on-site, with spaces located behind and in front of the buildings. The properties are near the center of Drexel Hill, within walking distance of shops, restaurants, and a trolley stop. Drexel Hill is part of Upper Darby Township in Delaware County, Pennsylvania.
Key Highlights
- 18‑unit portfolio across two apartment buildings
- 16,150 square feet built in 1968
- Unit mix includes 2 studios and 16 two‑bedroom apartments
Financial Insights
Estimated NOI and Cap Rate
NOI / Yr
$161,897
Cap Rate
8.09%
Suggested Prices Based on Cap Rates
Cap Rate 5%
$3,237,940
$3.2M
Cap Rate 7%
$2,312,814
$2.3M
Cap Rate 9%
$1,798,856
$1.8M
Market Conditions
NOI Build-Up for 16,150 SF
Gross rent
$341.1K $21.12/SF
− Vacancy
−$46.7K −$2.89/SF
EGI
$294.4K $18.23/SF
− OpEx
−$132.5K −$8.20/SF
NOI
$161.9K $10.02/SF
Area
Delaware County, PA
Vacancy
13.70%
Lease Rate
$21.12 /SF/Yr
Expense Ratio
45.00%
Simulate Cap Rate and NOI
Suggested Prices Based on Cap Rates
Cap Rate 5%
$3,237,940
Cap Rate 7%
$2,312,814
Cap Rate 9%
$1,798,856
Alternative Uses
Best Use
Apartment 5plus
$2.31M
$2.02M – $2.70M
NOI $161,897 @ 7.0% cap · market cap 8.09%
Second Best
—
—
no second resolved use
Theoretical Best
Office A
$4.90M
$4.28M – $5.71M
NOI $342,756 @ 7.0% cap · market cap 17.14%
Zoning and permitted uses should be independently verified with authorities.
How Realmo checks its estimates
Property Analytics
Current Use
Location Intelligence
Trade Area within ½ mile
1,846
Businesses Nearby
Explore this area
Business Placement
Demographics for 19026, PA
32,021
Population
13,643
Households
2.3
Avg Household Size
39
Median Age
46%
College-Educated
94%
High-School Grad
3.6 sq mi
ZIP Area
8,895
Density / Sq Mi
$89,079
Median Household Income
$50,930
Median Earnings
$1,316
Median Rent
$243,000
Median Home Value
Market
Vacancy Rate% for Multifamily in Northeast region






Frequently Asked Questions
What type of property is this?
Apartment building - Two nearby apartment buildings offer varied unit layouts, laundry facilities, and on-site as well as street parking.
Where is this apartment building located?
The property is located at 3443 Marshall Road Drexel Hill, PA.
What is the asking price?
The asking price for this property is $2,000,000.
What are key features of this property?
This property features: 18‑unit portfolio across two apartment buildings; 16,150 square feet built in 1968; Unit mix includes 2 studios and 16 two‑bedroom apartments


