Mixed-Use Property with Nail

For Sale
$500,000
3410 Moss Street, Lafayette, LA 70507
Commercial Sale, Lafayette, LA
Property Size2,889 SF
Lot Size0.47 Acres
Price / SF$173.07
Days on Market223
Property Features for 3410 Moss Street
General Information
Property type
Commercial Sale
Property subtype
Other
Zoning
CM-1
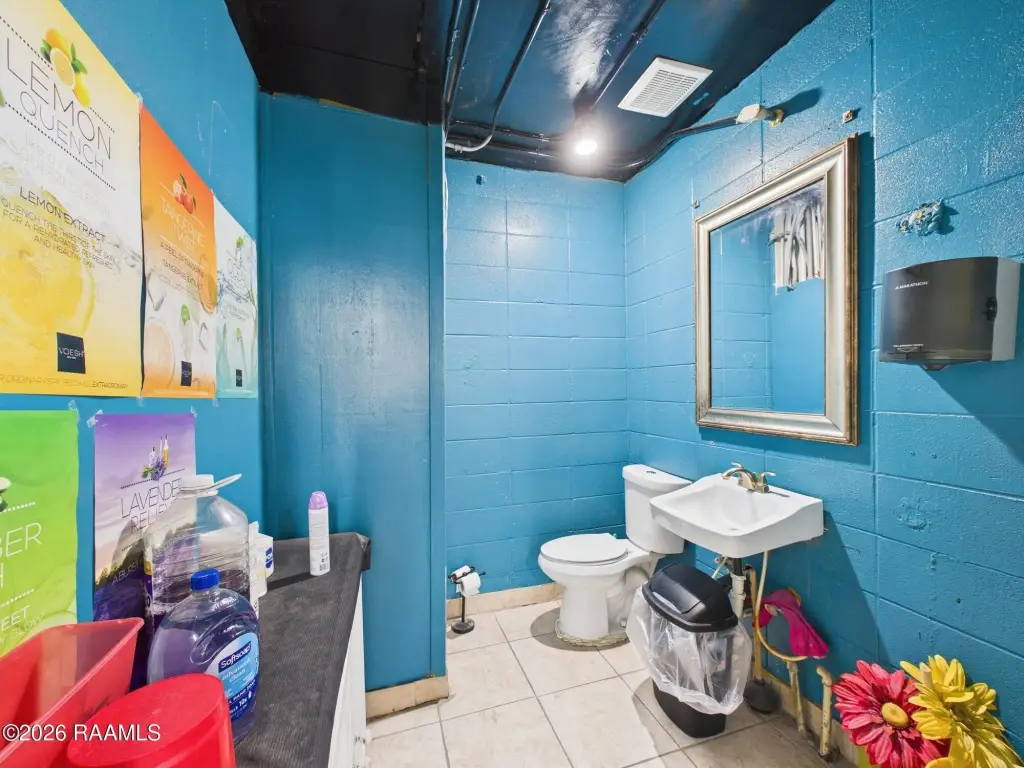
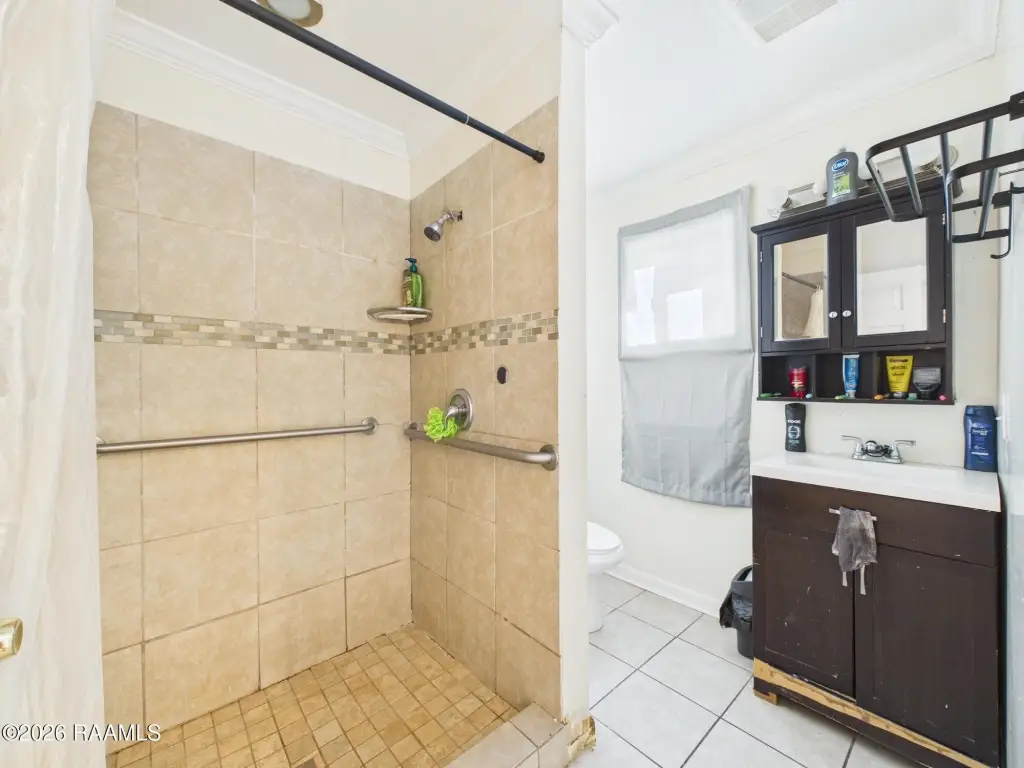
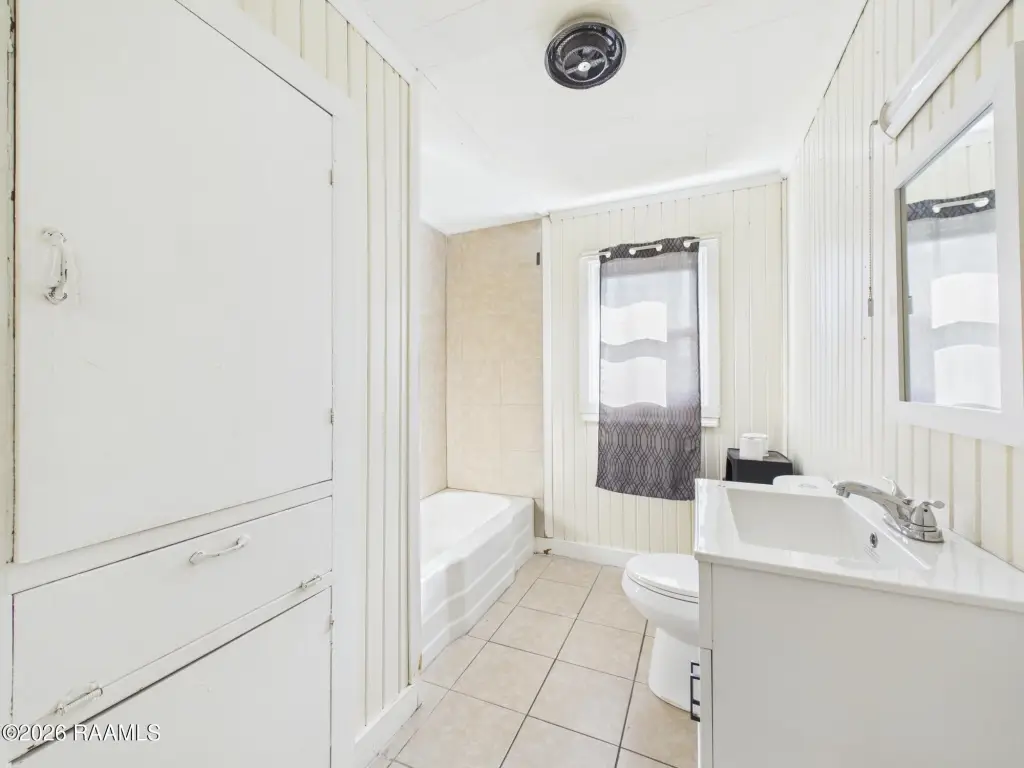
Bathrooms
1
Full bathrooms
1
Rooms
Bathroom 1
Parking
8
Parking features
Parking Lot
Security features
Security System
Exterior features
Partially Fenced, Outside Storage
Fencing
Partial
Subdivision
Coulee Shore
Lot features
Level
Directions
I-49N to Right on Pont des Mouton; Right on Moss. Building on Left.
Standard status
Active
APN
6024920
Size
2,889 SF
Lot size
0.47 Acres
Taxes and HOA fees
Tax Description
SEC 50 T9S R4E (110X185)
Legal Description
SEC 50 T9S R4E (110X185)
Utilities
Heating system
Electric (Heating), Central
Cooling system
Central Air
Water source
Public
Building Details
Floors in Building
1
Flooring type
Tile
Roof type
Metal
Additional Structures
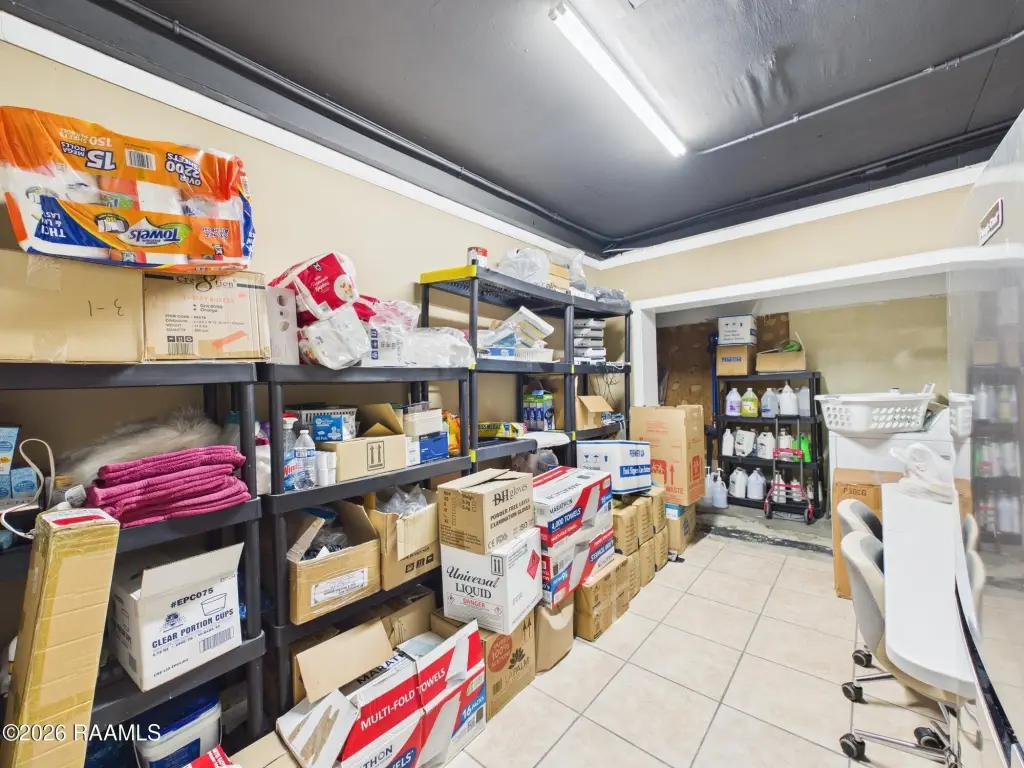
Storage
Listing Agency:
Keaty Real Estate Team
(337) 235-7770
Listed By:
Jason Ray · License #995704236
(337) 230-0664
Added: Feb 25
Changed: Sep 13
Last Checked: Oct 6 at 5:06PM
MLS# 2600001416
Copyright © 2026 Realtor Association of Acadiana. All rights reserved. All information provided by the listing agent/broker is deemed reliable but is not guaranteed and should be independently verified.
Investment Insights
Based on property information with market context.
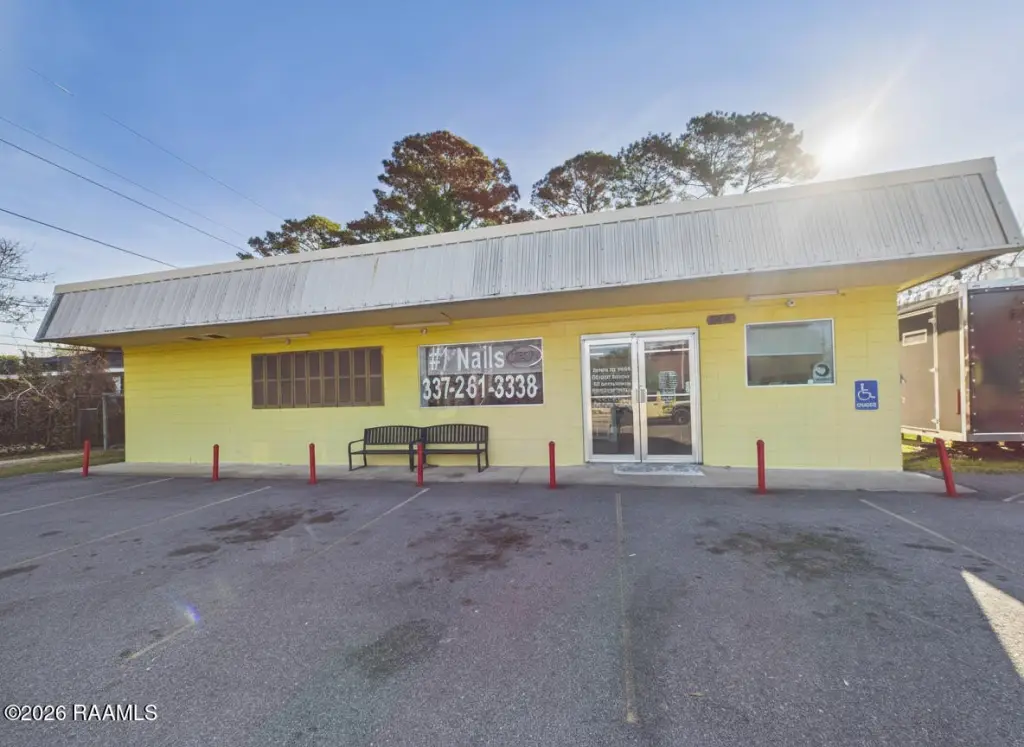
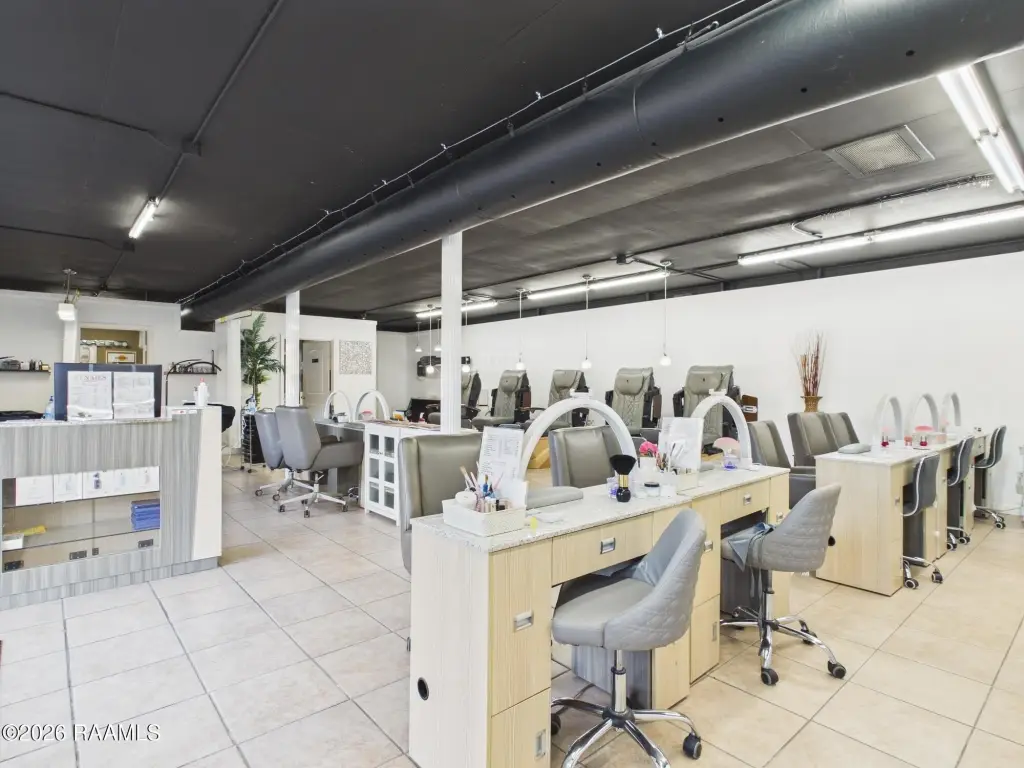
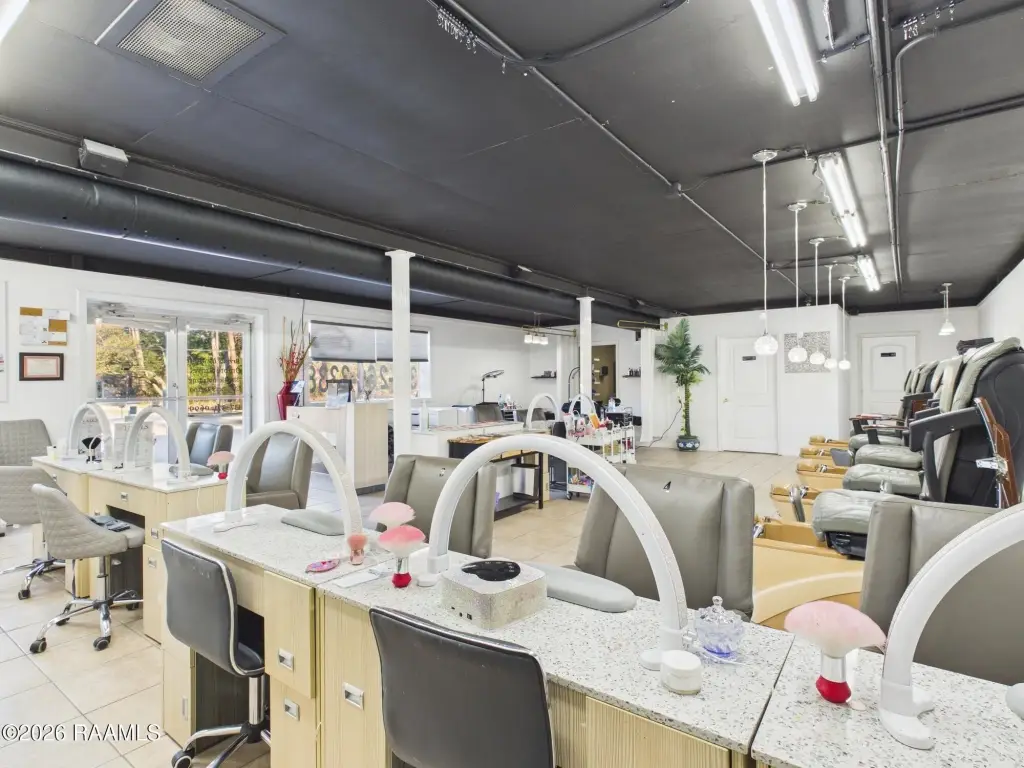
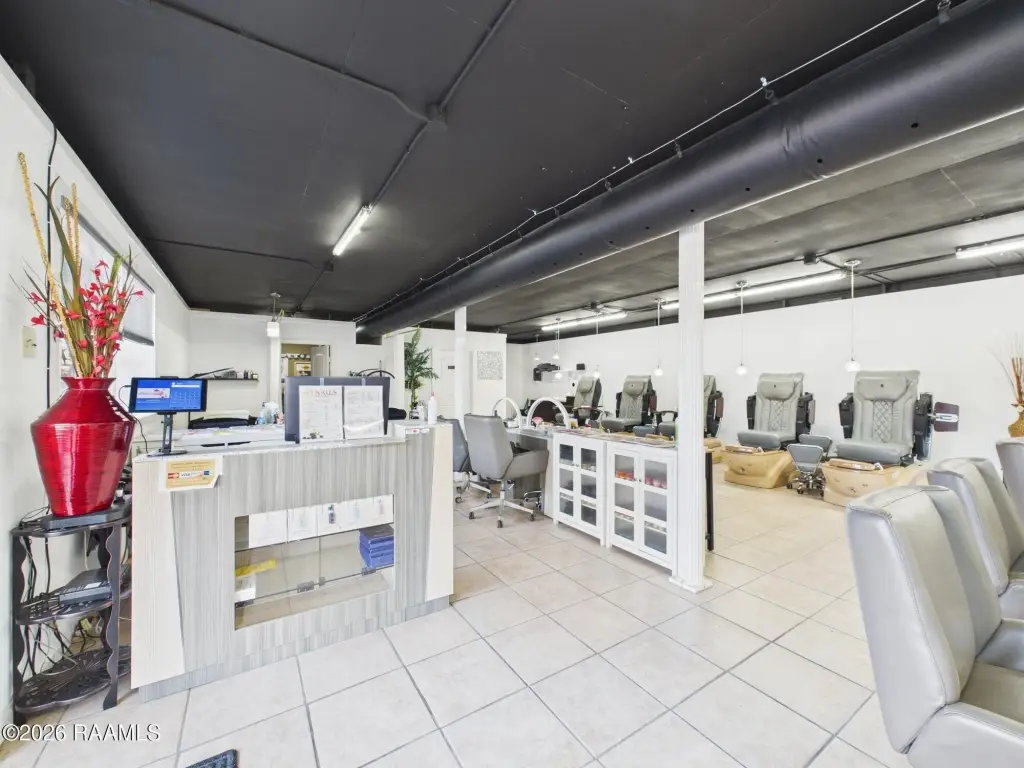
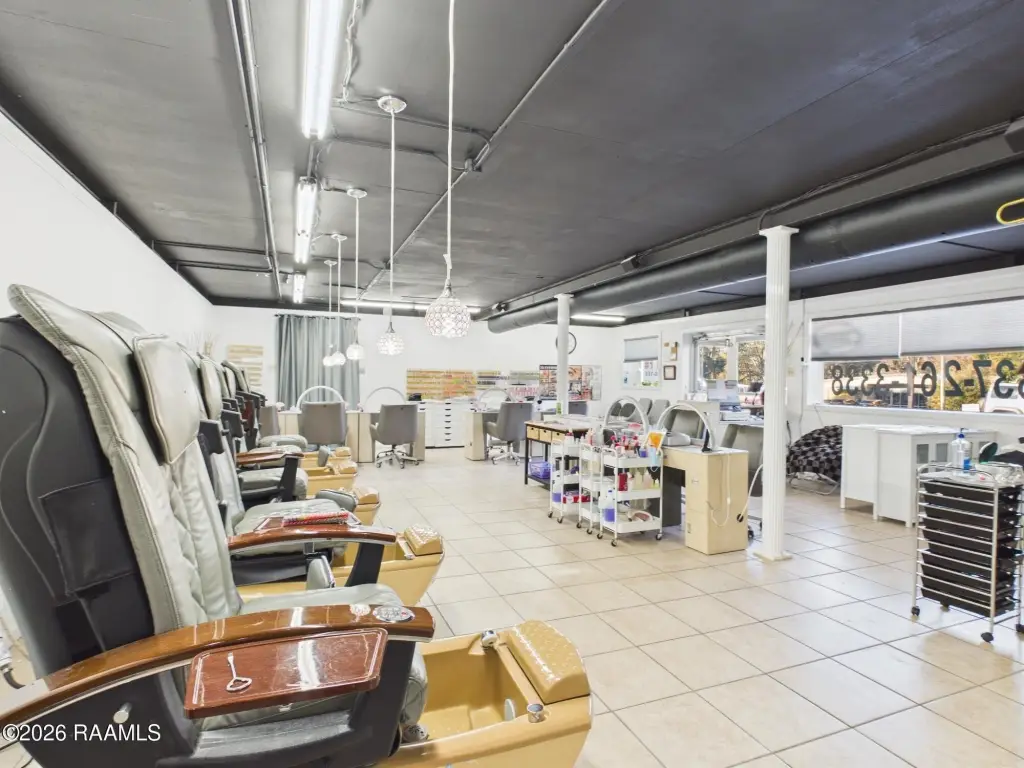
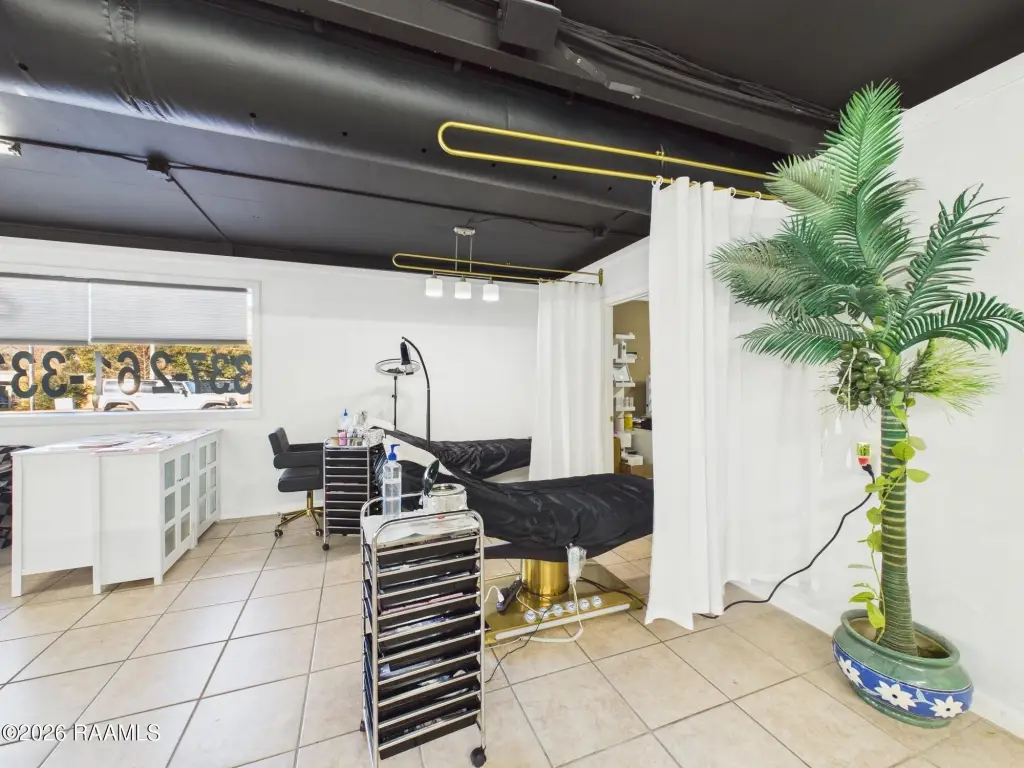
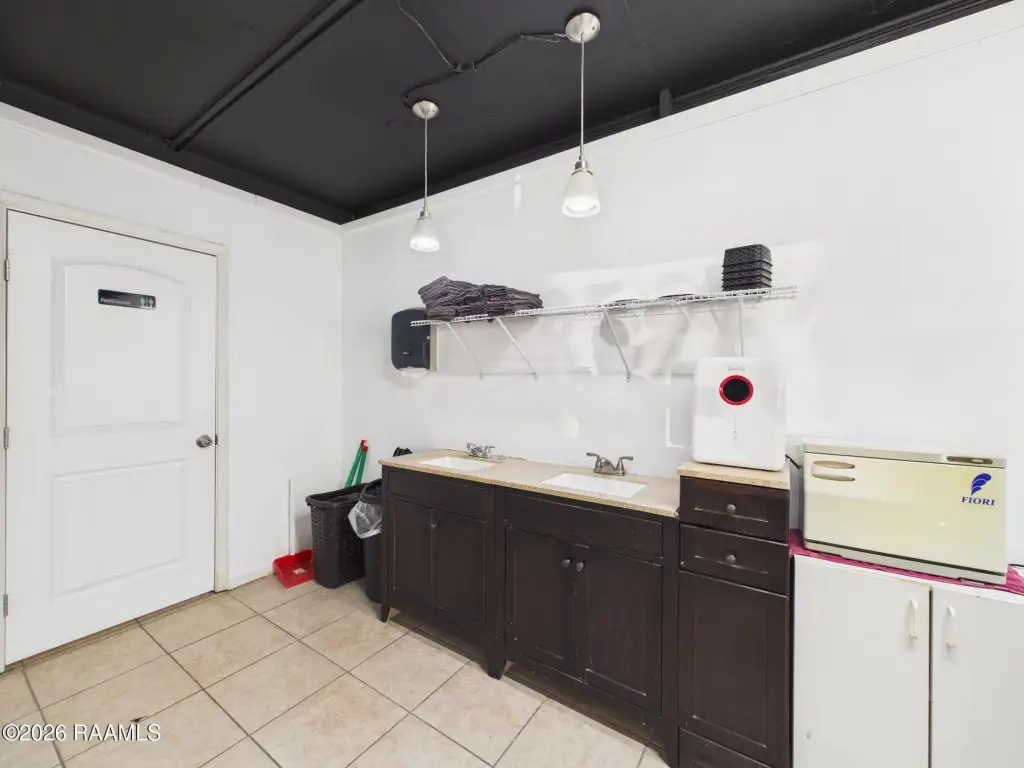
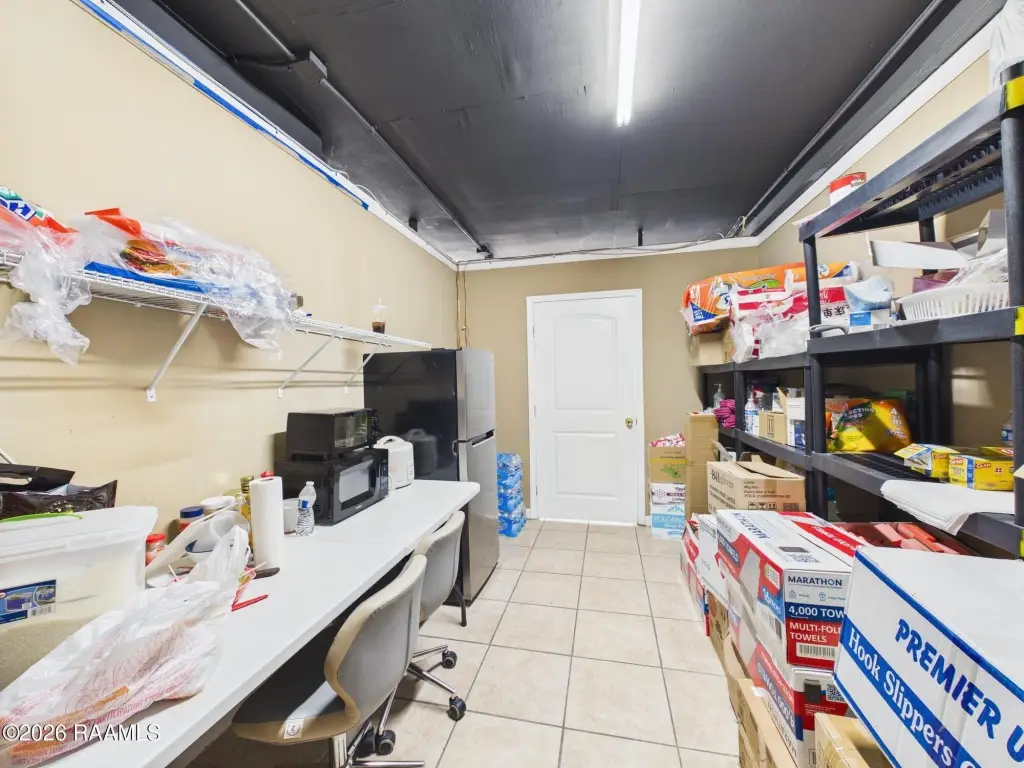
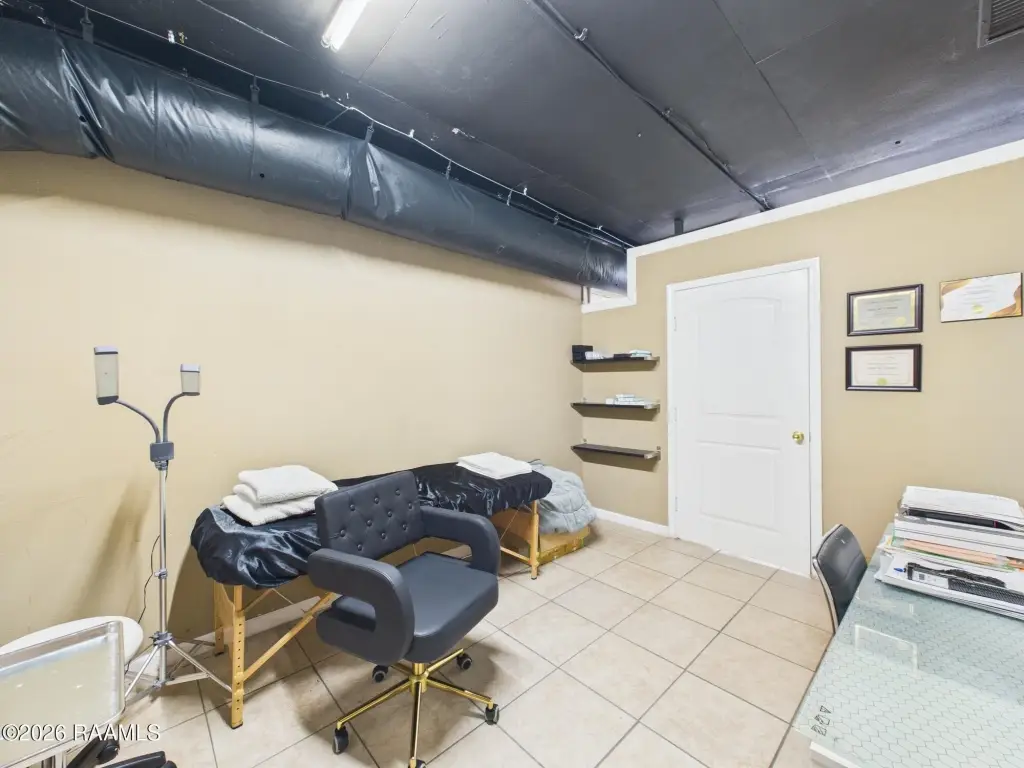
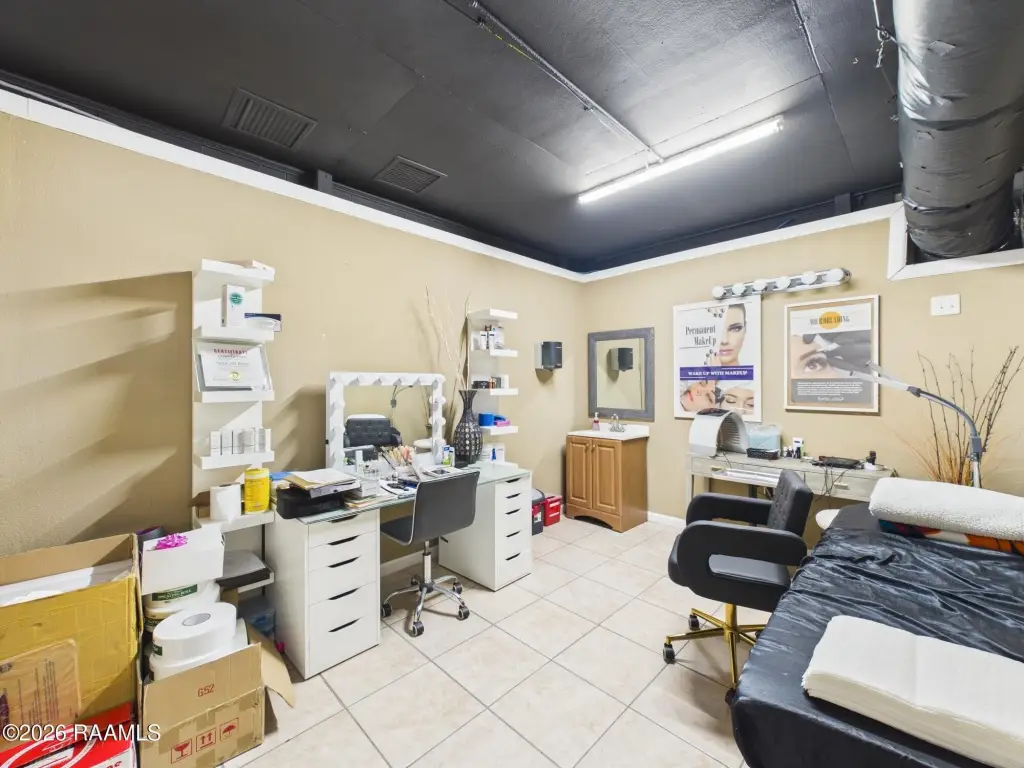
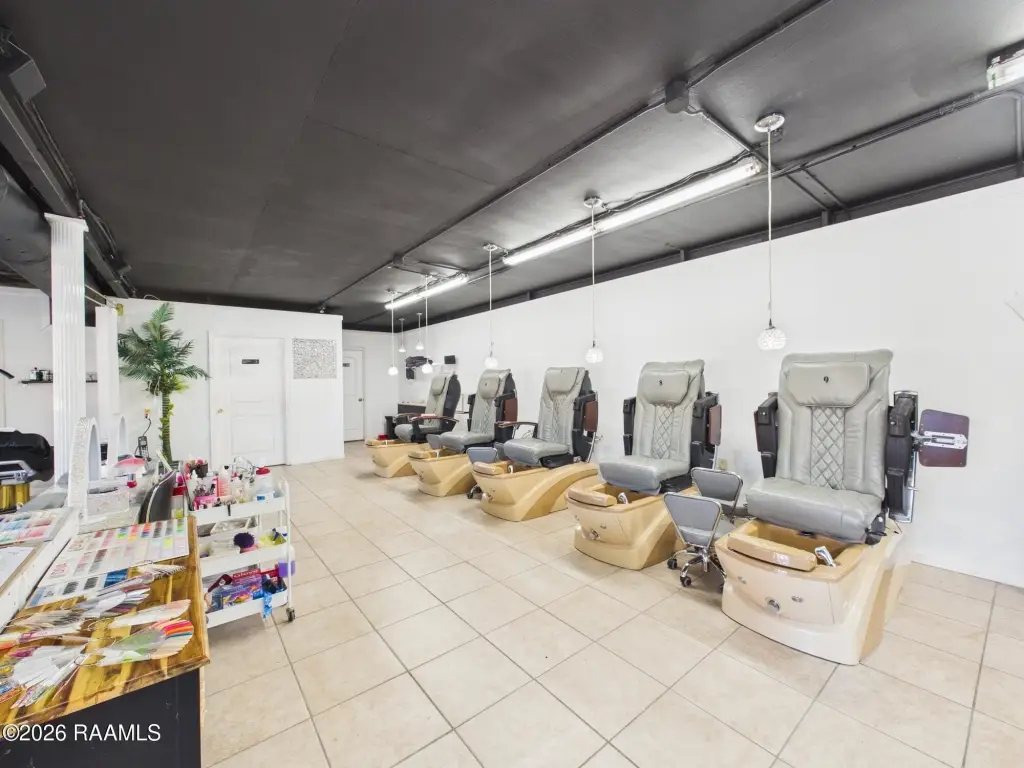
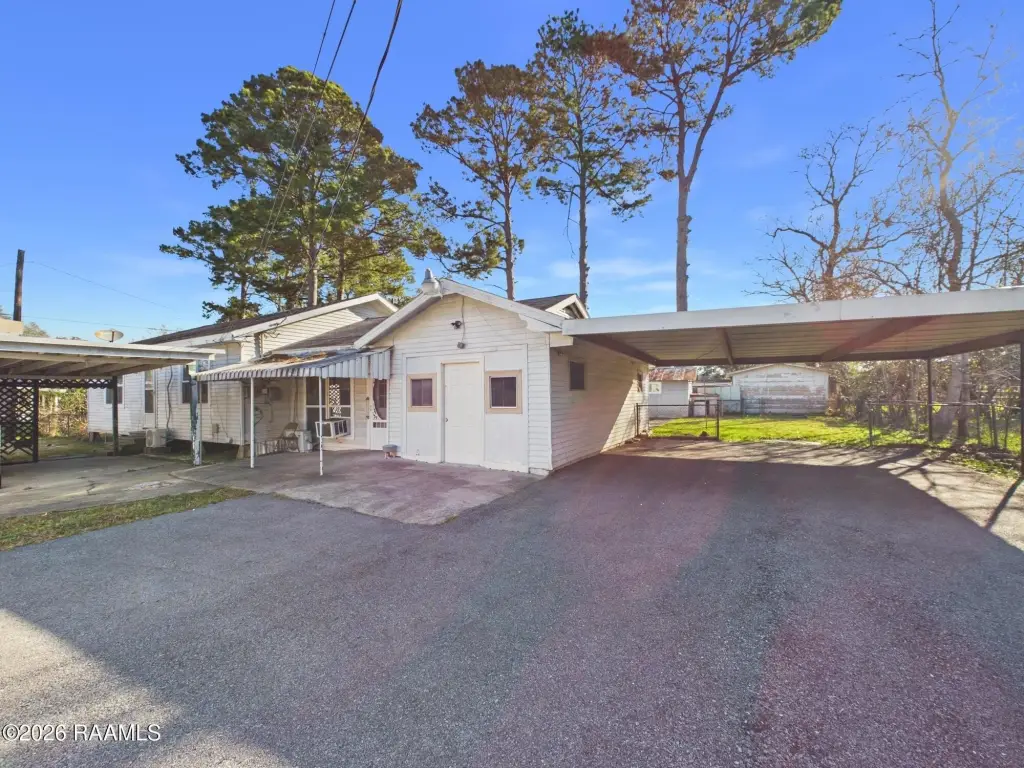
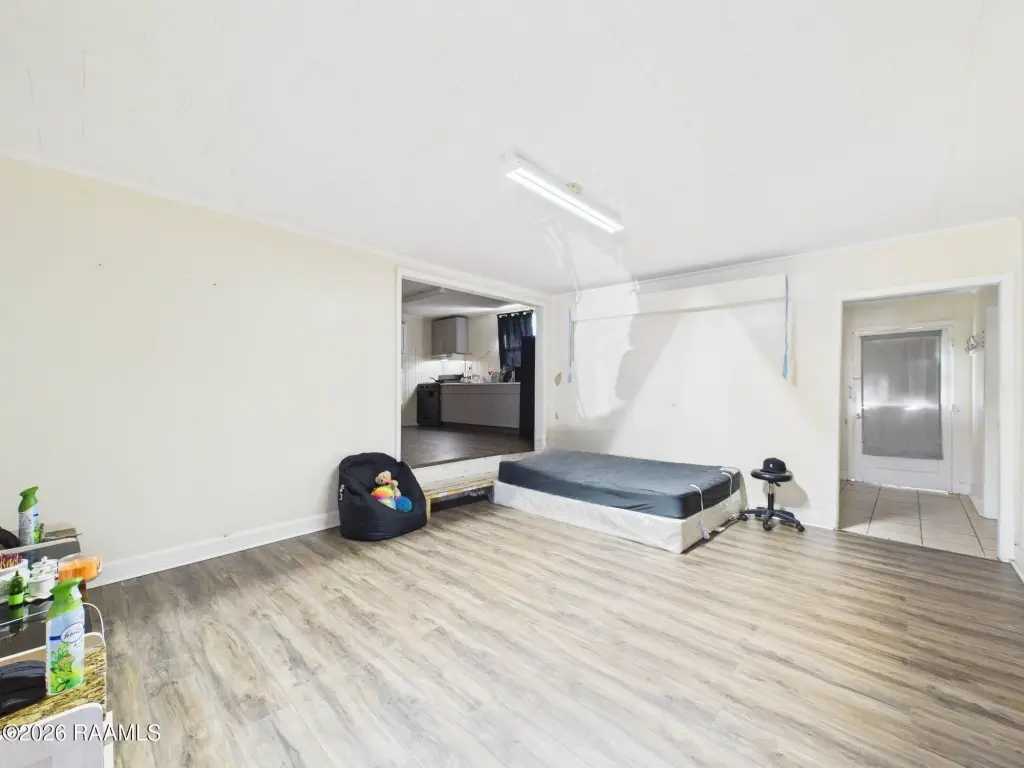
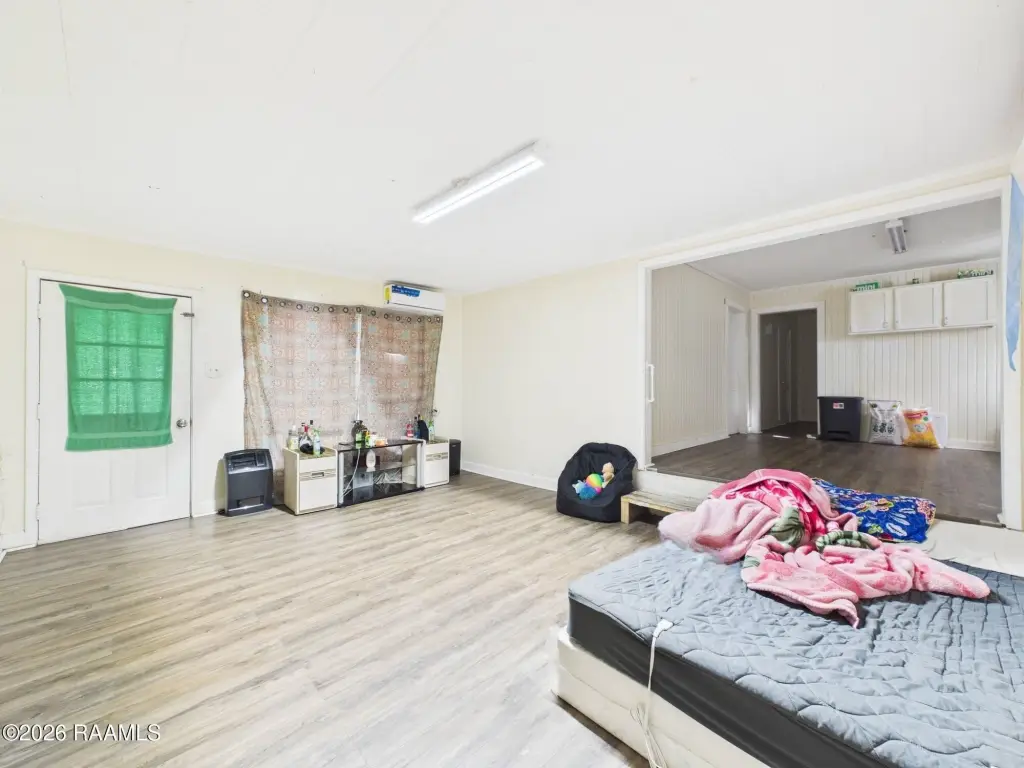
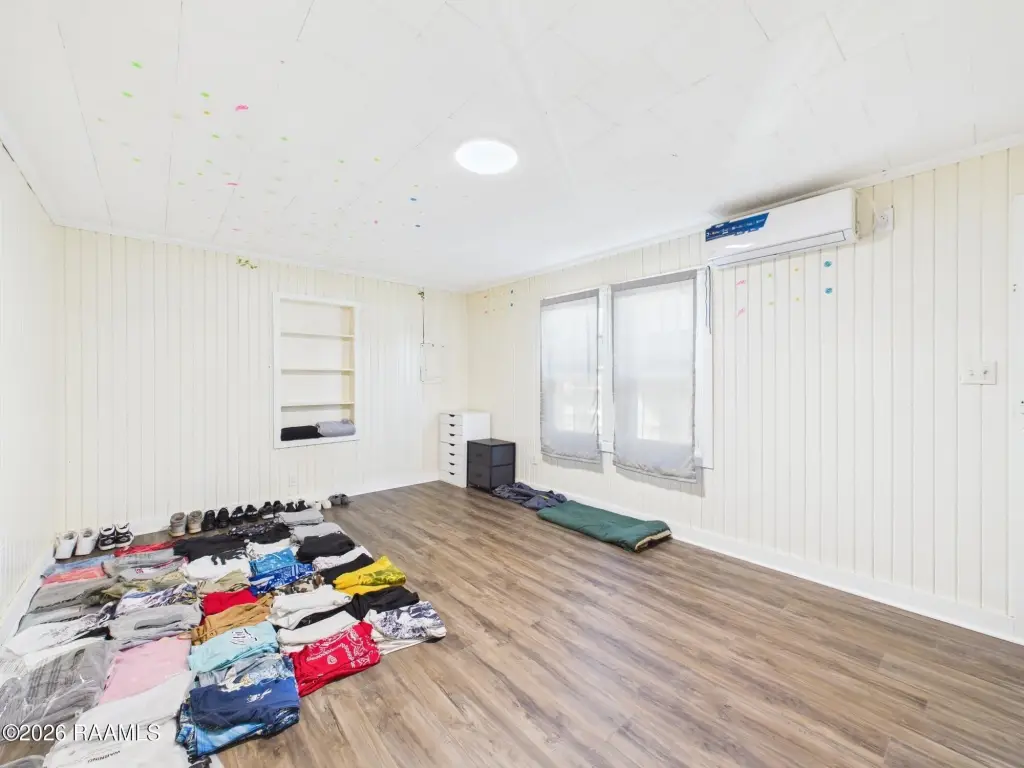
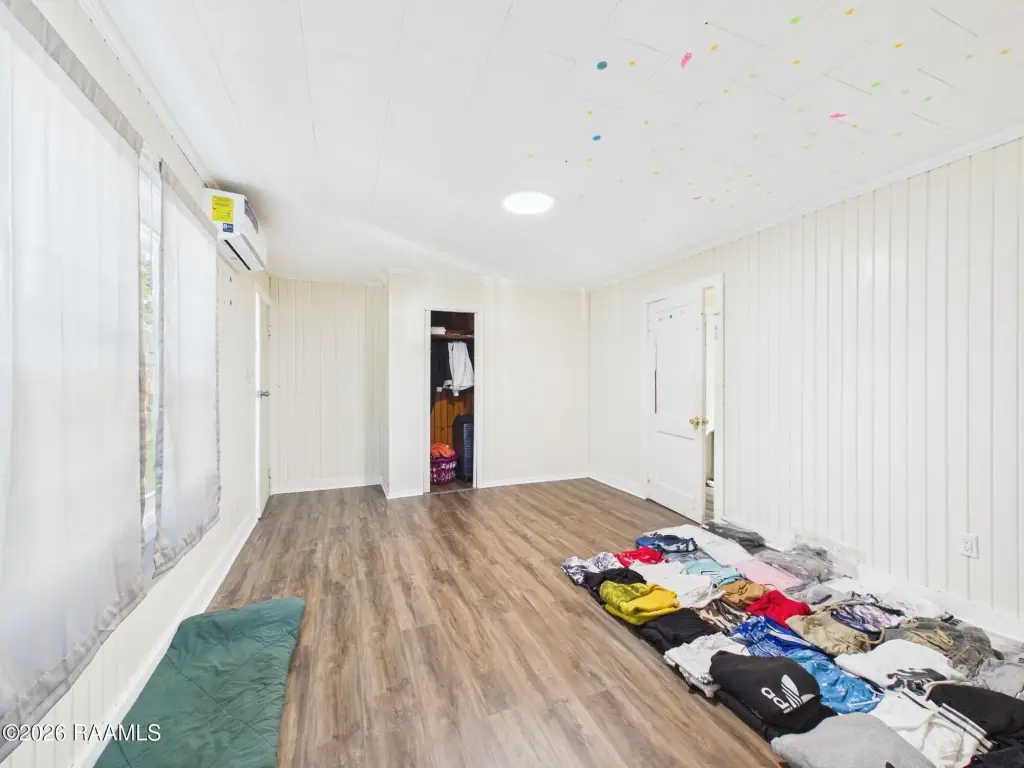
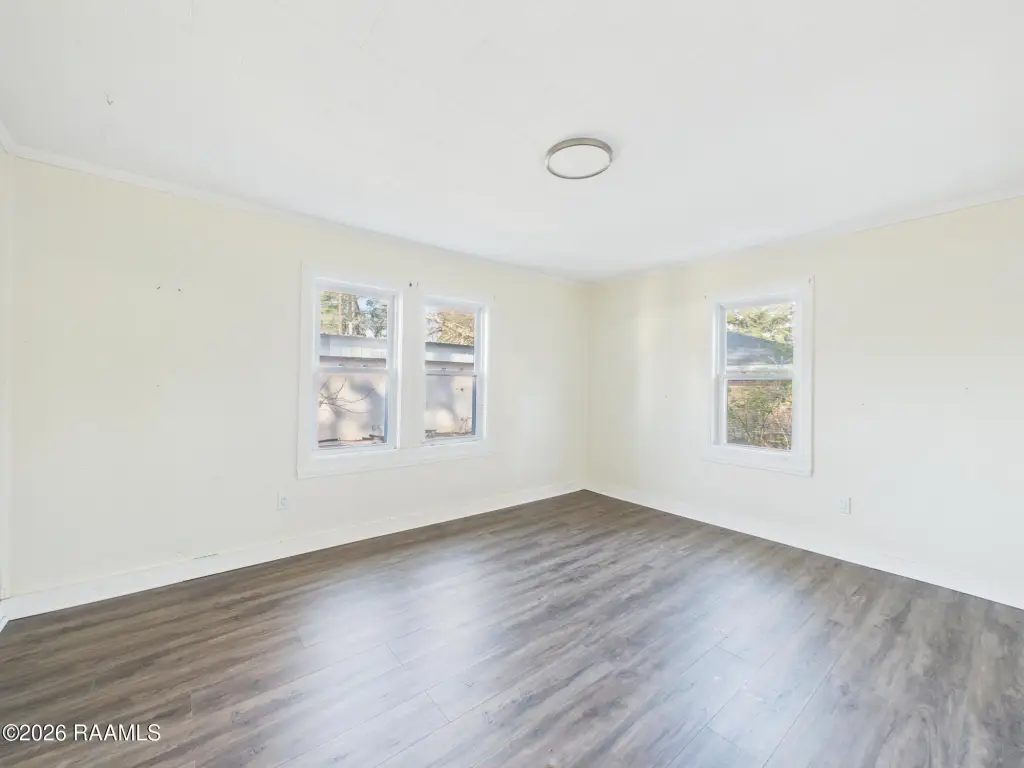
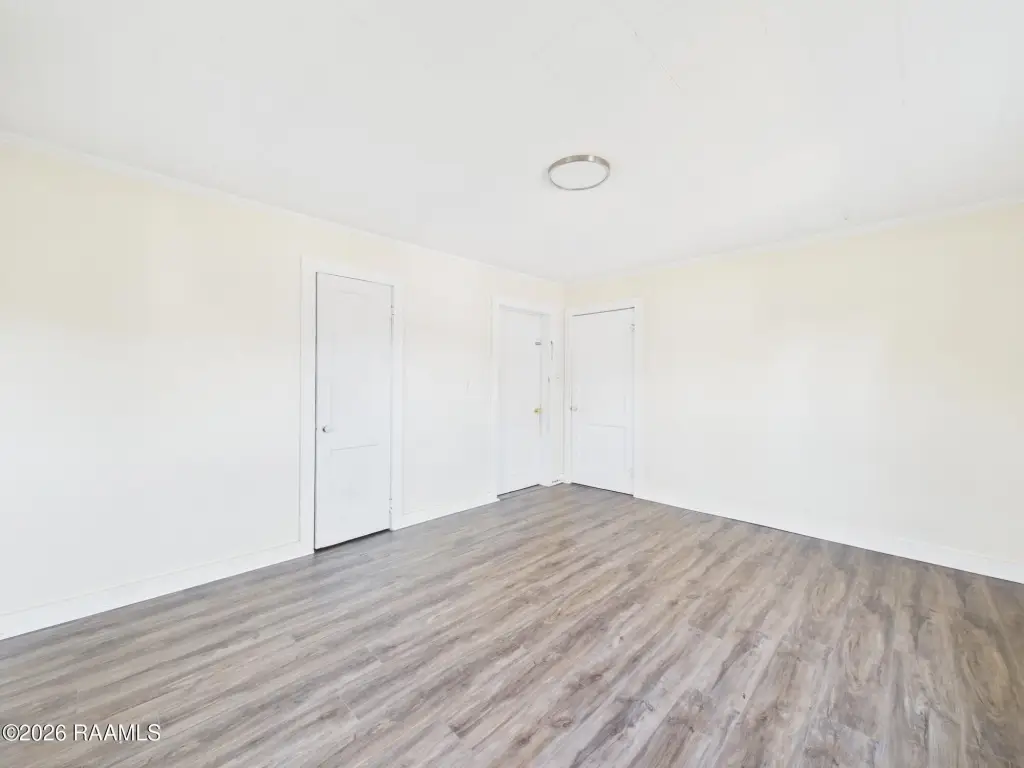
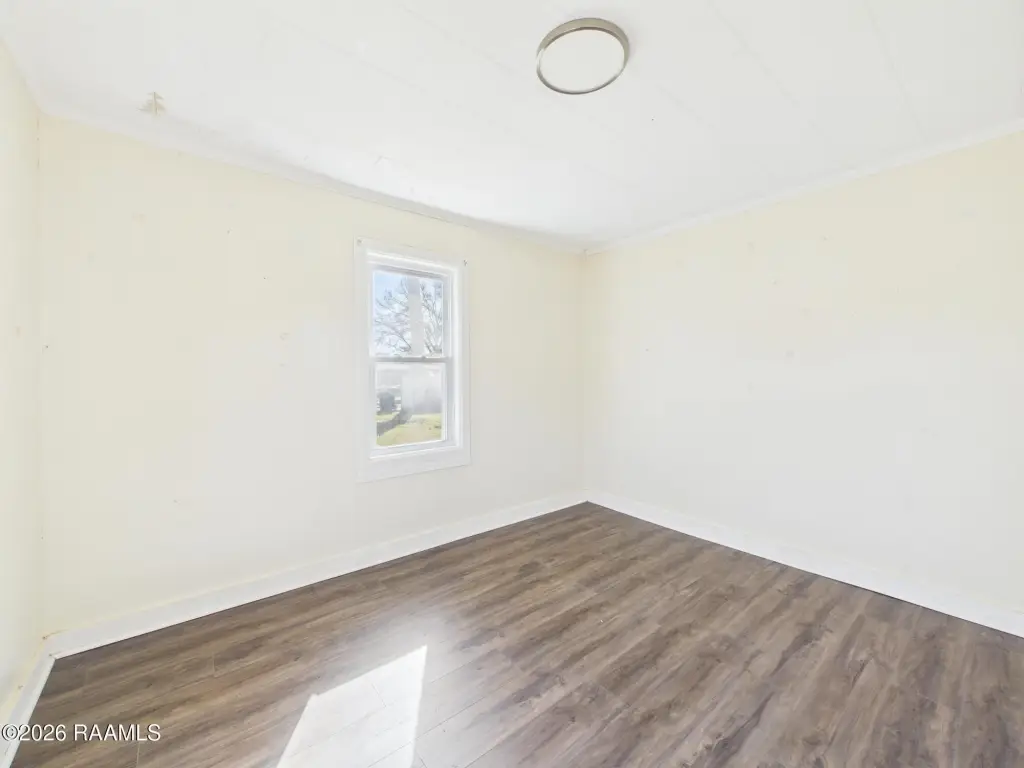
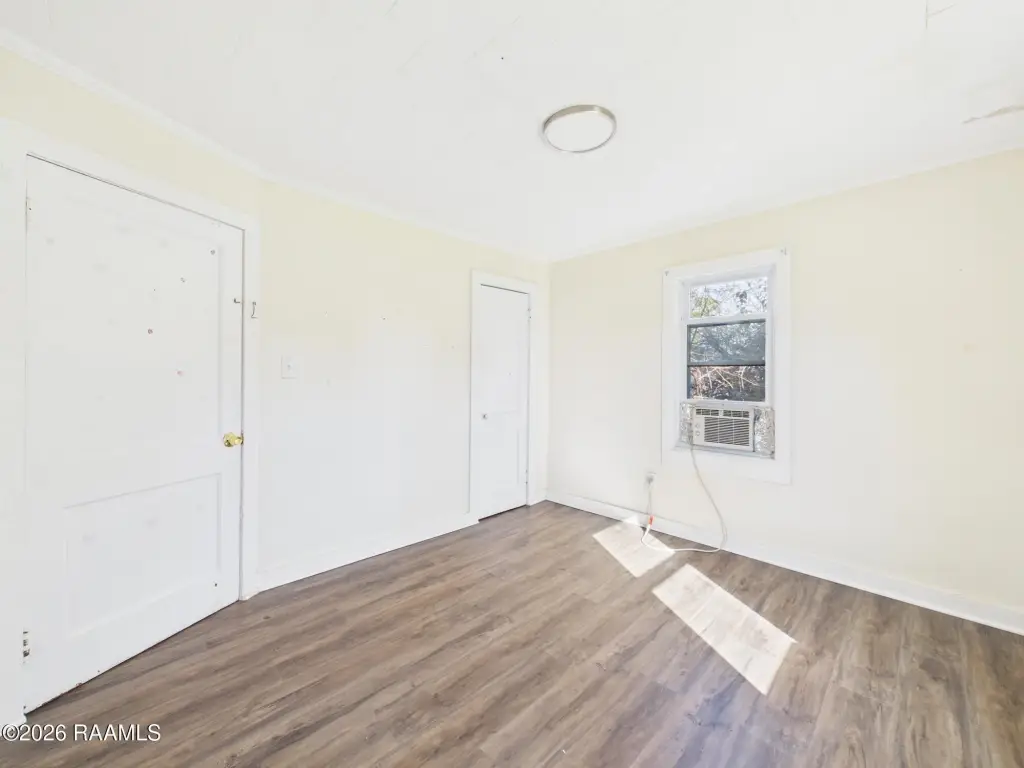
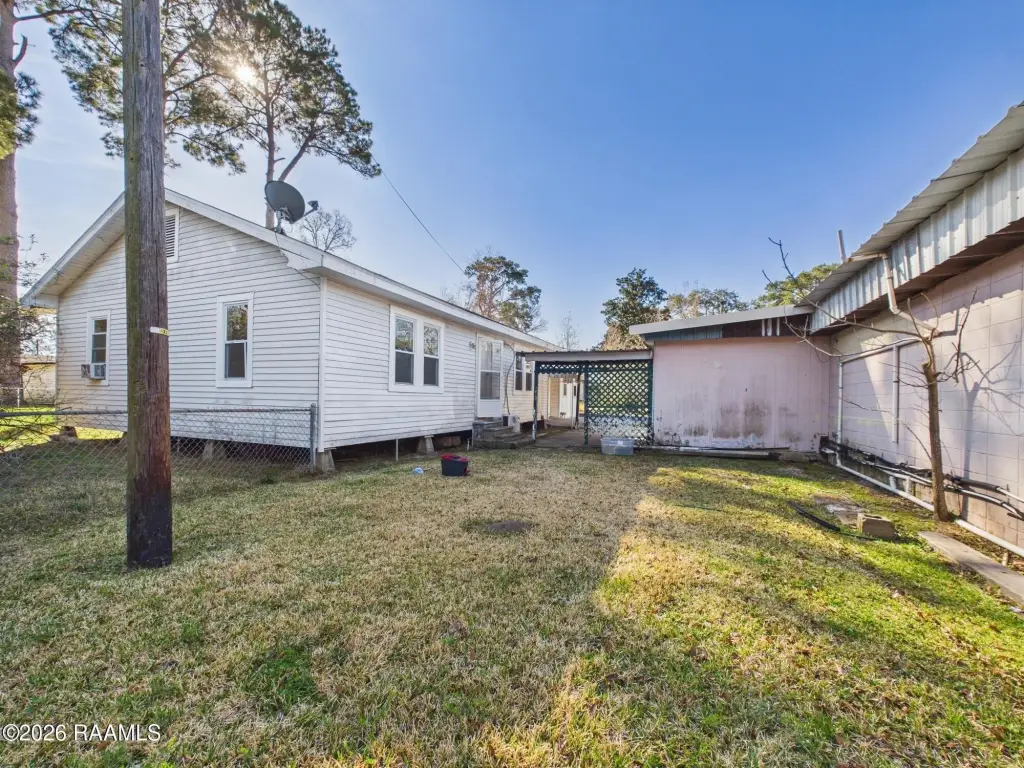
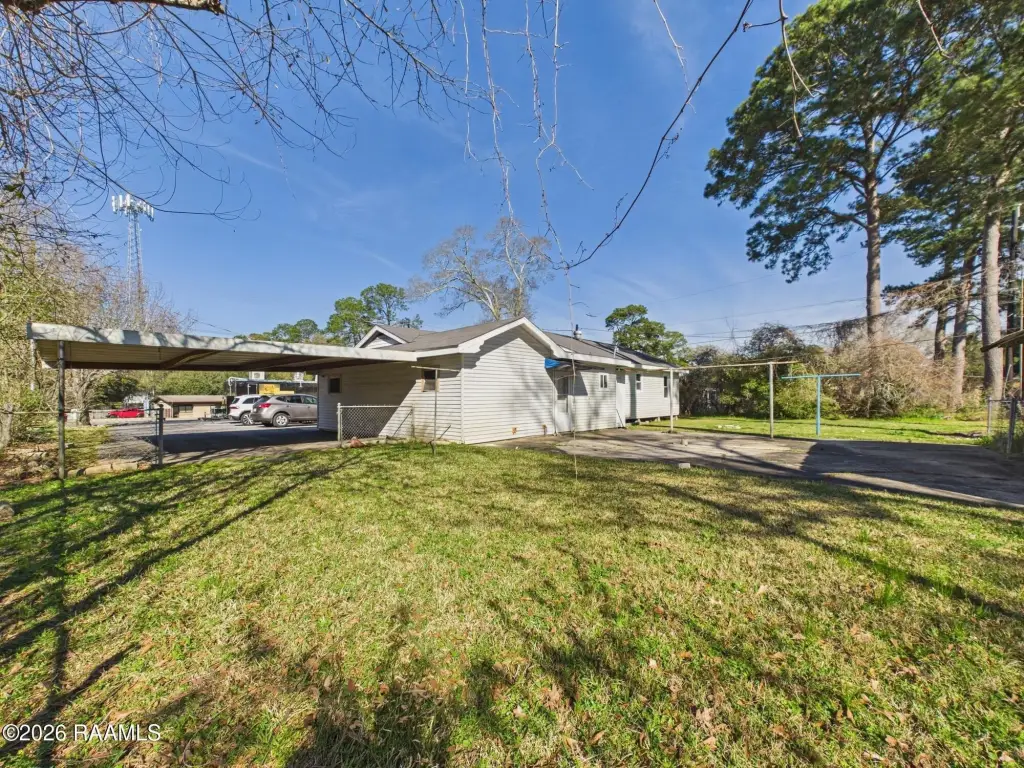
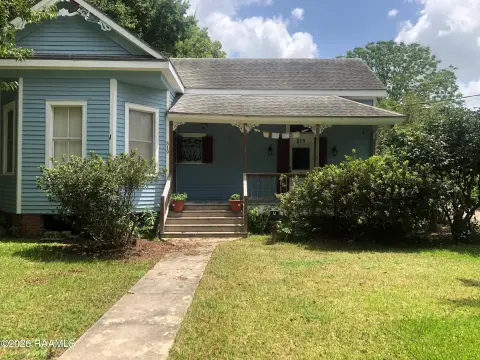
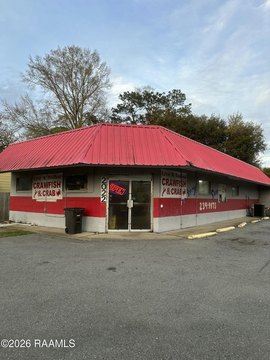
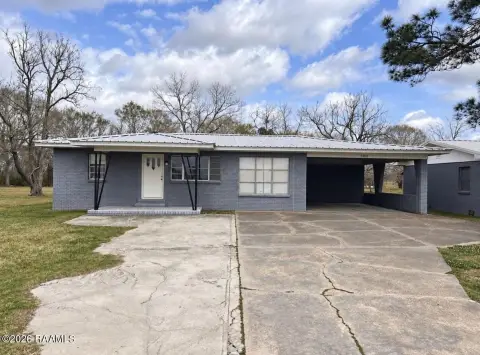
Located in the North Lafayette corridor, this mixed-use property combines a front commercial building with a separate residential home on the same site. The commercial space is 1,250 square feet and is currently operating as a nail salon. Behind the commercial building is a separate 1,400-square-foot home featuring 3 bedrooms and 2 baths, providing on-site living or flexible use alongside the existing business.
The property sits along Moss Street with strong road frontage and is positioned for visibility along a high-visibility corridor. The site is zoned CM-1 mixed-use, supporting both commercial and residential uses.
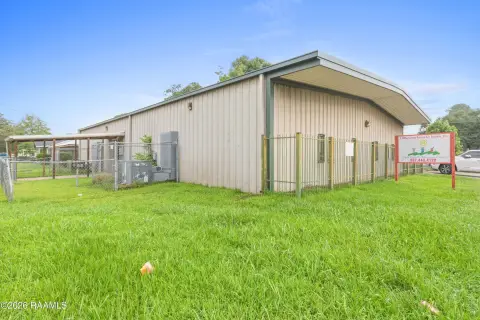
Total building area is listed at 2,889 square feet, and the lot size is 0.47 acres. This configuration offers buyers the option to operate an established business while also owning a separate residence on the same property.
The property sits along Moss Street with strong road frontage and is positioned for visibility along a high-visibility corridor. The site is zoned CM-1 mixed-use, supporting both commercial and residential uses.
Total building area is listed at 2,889 square feet, and the lot size is 0.47 acres. This configuration offers buyers the option to operate an established business while also owning a separate residence on the same property.
Key Highlights
- Rare opportunity: Own an established business, commercial real estate, and a residential home in a high‑visibility location.
- 1,250 sq ft commercial building currently operating as a successful nail salon with strong road frontage.**
- CM‑1 mixed‑use zoning provides flexibility.
Financial Insights
Estimated NOI and Cap Rate
NOI / Yr
$35,037
Cap Rate
7.01%
Suggested Prices Based on Cap Rates
Cap Rate 5%
$700,740
$700.7K
Cap Rate 7%
$500,529
$500.5K
Cap Rate 9%
$389,300
$389.3K
Market Conditions
NOI Build-Up for 2,889 SF
Gross rent
$54.4K $18.84/SF
− Vacancy
−$4.4K −$1.51/SF
EGI
$50.1K $17.33/SF
− OpEx
−$15.0K −$5.20/SF
NOI
$35.0K $12.13/SF
Area
Lafayette, LA
Vacancy
8.04%
Lease Rate
$18.84 /SF/Yr
Expense Ratio
30.00%
Simulate Cap Rate and NOI
Suggested Prices Based on Cap Rates
Cap Rate 5%
$700,740
Cap Rate 7%
$500,529
Cap Rate 9%
$389,300
Alternative Uses
Best Use
Retail
$500.5K
$438.0K – $584.0K
NOI $35,037 @ 7.0% cap · market cap 7.01%
Second Best
Mixed Use
$476.7K
$417.1K – $556.1K
NOI $33,368 @ 7.0% cap · market cap 6.67%
Theoretical Best
Office A
$683.1K
$597.7K – $796.9K
NOI $47,814 @ 7.0% cap · market cap 9.56%
Zoning and permitted uses should be independently verified with authorities.
Property Analytics
Unlock full access to Insights
Subscribe to Realmo Intelligence
Open Analytics
Current Use
Lease Details
Turnkey business
Opportunity
Location Intelligence
Trade Area within ½ mile
223
Businesses Nearby
Explore this area
Business Placement
Demographics for 70507, LA
17,791
Population
8,133
Households
2.2
Avg Household Size
36
Median Age
30%
College-Educated
92%
High-School Grad
21.4 sq mi
ZIP Area
831
Density / Sq Mi
$64,010
Median Household Income
$40,700
Median Earnings
$937
Median Rent
$206,700
Median Home Value
Check the figures for this property
Cap Rate, Value Estimation, Potential NOI and more
View Realmo Analytics
Market
Vacancy Rate% for Retail in South region

Questions? Ask Rey
Realmo’s AI knows this listing — price, zoning, demand, history. Ask anything.




Frequently Asked Questions
What type of property is this?
Mixed-use property - Front commercial space is occupied by a nail salon, with a separate 3-bedroom, 2-bath home behind under CM-1 zoning.
Where is this mixed-use property located?
The property is located at 3410 Moss Street Lafayette, LA.
What is the asking price?
The asking price for this property is $500,000.
What are key features of this property?
This property features: Rare opportunity: Own an established business, commercial real estate, and a residential home in a high‑visibility location.; 1,250 sq ft commercial building currently operating as a successful nail salon with strong road frontage.**; CM‑1 mixed‑use zoning provides flexibility.



