Versatile Office/Warehouse with Income
For Sale
Contact for pricing
3403 107th St, Lubbock, TX 79423
Functional commercial property with unique features in a prime location.
Property Size6,365 SF
Price / SF$164.96
Days on Market198
Property Features for 3403 107th St
General Information
Standard status
Active
Size
6,365 SF
Class
A
Property subtype
Mixed Use, Office, Retail
Building Details
Year Built
2021
Buildings
2
Listing Agency:
McDougal Realtors
Listed By:
Ethan Quisenberry · License #TX
(806) 317-0234
Source:
Crexi
Added: Mar 24
Changed: Sep 18
Last Checked: Oct 7 at 9:30AM
Displayed information is deemed reliable but is not guaranteed and should be independently verified. All listing content including descriptions, pricing, images are the copyrighted material of McDougal Realtors
Investment Insights
Based on property information with market context.
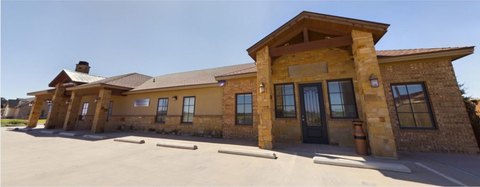
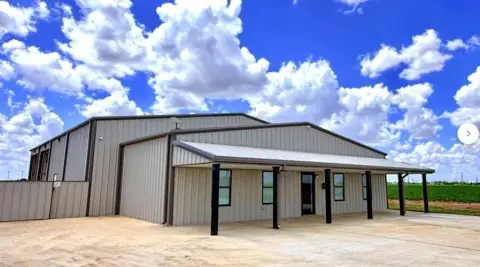
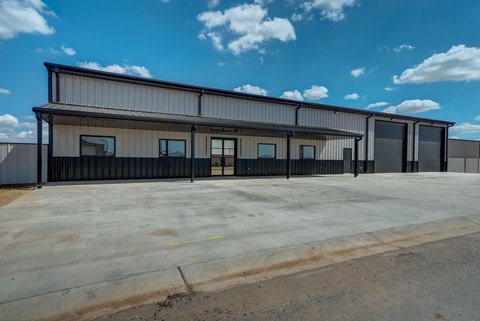
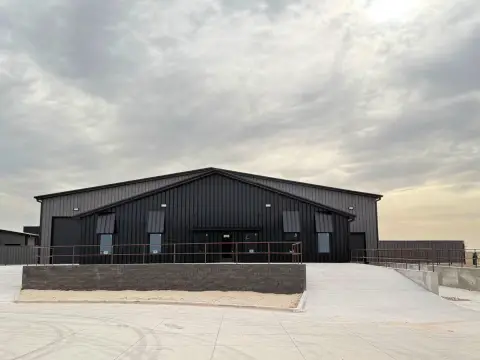
Located at the corner of 107th Street and Indiana Avenue, this 5,000 square foot office/warehouse offers functionality and versatility in South Lubbock. The property is secured with a brick and wood privacy fence and features an electric gate for controlled access. Mature trees line the east side along Indiana, creating privacy and a professional setting. The interior is laid out with four private offices, a full kitchen, one full bathroom with a sauna, and two additional half bathrooms, making it suited for both office and operational use. The warehouse area has been transformed into a professionally graded pickleball court that doubles as a half basketball court. The property includes a separate approximately 1,365 square foot home located just west of the main building. The home is currently income-producing, providing supplemental cash flow. The total property size is 6,365 square feet.
Key Highlights
- Prime location on the hard corner of 107th Street and Indiana Avenue in South Lubbock's growing corridor.
- Includes a separate ±1,365 SF income‑producing home to offset ownership costs.
- Unique warehouse space transformed into a professionally graded pickleball/half basketball court.
Financial Insights
Estimated NOI and Cap Rate
NOI / Yr
$87,078
Cap Rate
8.29%
Suggested Prices Based on Cap Rates
Cap Rate 5%
$1,741,560
$1.7M
Cap Rate 7%
$1,243,971
$1.2M
Cap Rate 9%
$967,533
$967.5K
Market Conditions
NOI Build-Up for 6,365 SF
Gross rent
$110.8K $17.40/SF
− Vacancy
−$8.3K −$1.31/SF
EGI
$102.4K $16.10/SF
− OpEx
−$15.4K −$2.41/SF
NOI
$87.1K $13.68/SF
Area
Lubbock, TX
Vacancy
7.50%
Lease Rate
$17.40 /SF/Yr
Expense Ratio
15.00%
Simulate Cap Rate and NOI
Suggested Prices Based on Cap Rates
Cap Rate 5%
$1,741,560
Cap Rate 7%
$1,243,971
Cap Rate 9%
$967,533
Alternative Uses
Best Use
Warehouse
$1.24M
$1.09M – $1.45M
NOI $87,078 @ 7.0% cap · market cap 8.29%
Second Best
Mixed Use
$1.20M
$1.05M – $1.40M
NOI $83,779 @ 7.0% cap · market cap 7.98%
Theoretical Best
Office A
$1.60M
$1.40M – $1.87M
NOI $112,324 @ 7.0% cap · market cap 10.70%
Zoning and permitted uses should be independently verified with authorities.
Property Analytics
Unlock full access to Insights
Subscribe to Realmo Intelligence
Open Analytics
Current Use
Location Intelligence
Trade Area within ½ mile
238
Businesses Nearby
Explore this area
Business Placement
Demographics for 79423, TX
42,311
Population
18,463
Households
2.3
Avg Household Size
35
Median Age
38%
College-Educated
94%
High-School Grad
64.2 sq mi
ZIP Area
659
Density / Sq Mi
$82,906
Median Household Income
$45,520
Median Earnings
$1,284
Median Rent
$222,500
Median Home Value
Check the figures for this property
Cap Rate, Value Estimation, Potential NOI and more
View Realmo Analytics
Market
Vacancy Rate% for Office in South region

Questions? Ask Rey
Realmo’s AI knows this listing — price, zoning, demand, history. Ask anything.







Frequently Asked Questions
What type of property is this?
Mixed-use property - Functional commercial property with unique features in a prime location.
Where is this mixed-use property located?
The property is located at 3403 107th St Lubbock, TX.
What is the asking price?
The asking price for this property is $1,050,000.
What are key features of this property?
This property features: Prime location on the hard corner of 107th Street and Indiana Avenue in South Lubbock's growing corridor.; Includes a separate ±1,365 SF income‑producing home to offset ownership costs.; Unique warehouse space transformed into a professionally graded pickleball/half basketball court.