Triplex Investment
For Sale
$949,000
34 Raymond, Stamford, CT 06902
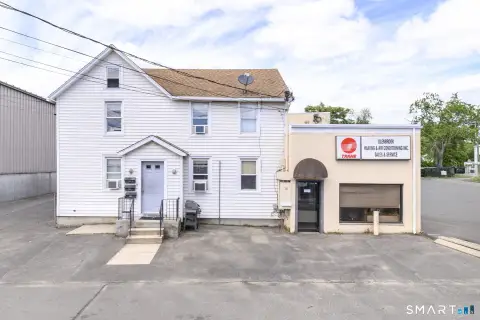
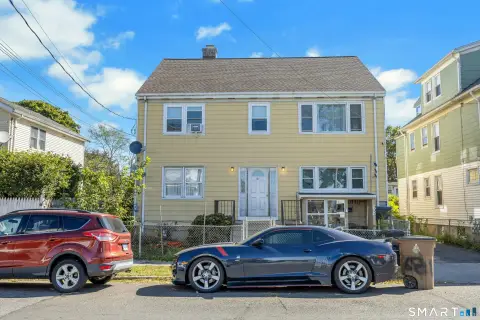
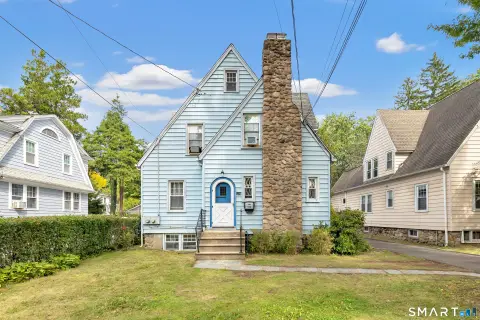
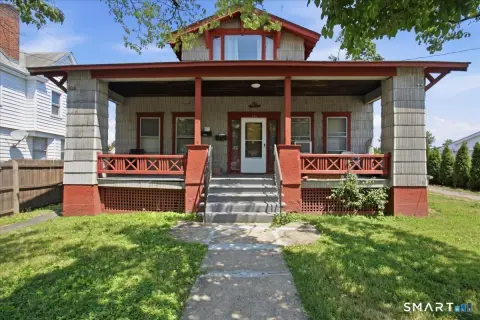
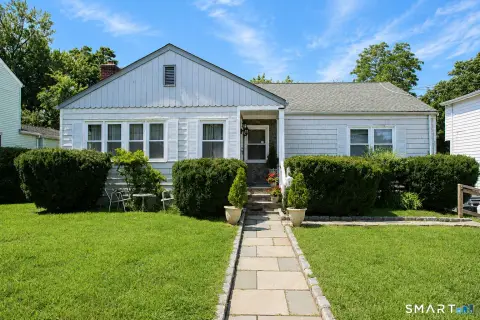
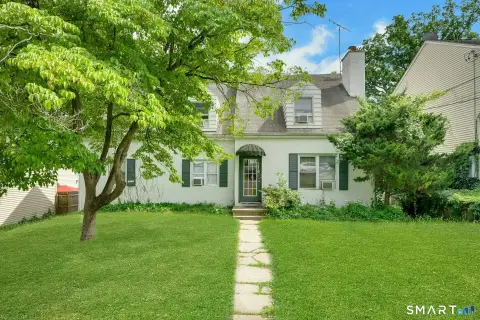
For-sale triplex in Stamford, offering a residential income structure for multi-unit ownership.
Property Size3,044 SF
Price / SF$311.76
Days on Market126
Property Features for 34 Raymond
General Information
Standard status
Active
Size
3,044 SF
Property subtype
2 Family
Building Details
Year Built
1958
Listing Agency:
William Pitt Sotheby's Int'l
(203) 968-1500
Listed By:
Wende Foreman · License #RES.0796508
(203) 981-4550
Source:
Lockandkeyre
Added: Jun 12
Changed: Oct 13
Last Checked: Oct 12 at 7:22PM
Displayed information is deemed reliable but is not guaranteed and should be independently verified. All listing content including descriptions, pricing, images are the copyrighted material of William Pitt Sotheby's Int'l
Investment Insights
Based on property information with market context.
This property is a residential income opportunity presented as a triplex, fitting the needs of buyers seeking a small, multi-unit multifamily asset. As a multi-family property, it provides an ownership structure built around multiple residential units within one investment property.
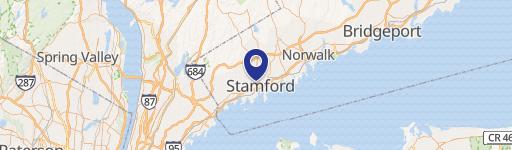
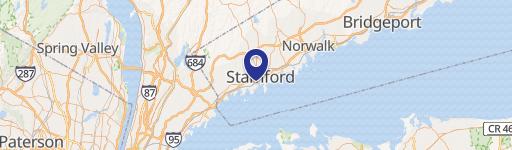
The triplex is located at 34 Raymond Street in Stamford, Connecticut. It is offered for sale, with the listing positioned as a multi-family investment opportunity for prospective buyers.
For an investor or owner-operator evaluating smaller multifamily holdings, a triplex can provide a straightforward platform for managing multiple households under one property umbrella. This offering may be suitable for buyers looking to add a residential income asset in Stamford to their portfolio, or for those exploring their first multi-unit acquisition. Prospective buyers should confirm unit configuration, current occupancy, and income/expense details directly as part of their due diligence.
The triplex is located at 34 Raymond Street in Stamford, Connecticut. It is offered for sale, with the listing positioned as a multi-family investment opportunity for prospective buyers.
For an investor or owner-operator evaluating smaller multifamily holdings, a triplex can provide a straightforward platform for managing multiple households under one property umbrella. This offering may be suitable for buyers looking to add a residential income asset in Stamford to their portfolio, or for those exploring their first multi-unit acquisition. Prospective buyers should confirm unit configuration, current occupancy, and income/expense details directly as part of their due diligence.
Key Highlights
- Triplex for sale in Stamford with residential income structure
- Built in 1958
Financial Insights
Estimated NOI and Cap Rate
NOI / Yr
$58,574
Cap Rate
6.17%
Suggested Prices Based on Cap Rates
Cap Rate 5%
$1,171,480
$1.2M
Cap Rate 7%
$836,771
$836.8K
Cap Rate 9%
$650,822
$650.8K
Market Conditions
NOI Build-Up for 3,044 SF
Gross rent
$89.5K $29.40/SF
− Vacancy
−$5.8K −$1.91/SF
EGI
$83.7K $27.49/SF
− OpEx
−$25.1K −$8.25/SF
NOI
$58.6K $19.24/SF
Area
Stamford, CT
Vacancy
6.50%
Lease Rate
$29.40 /SF/Yr
Expense Ratio
30.00%
Simulate Cap Rate and NOI
Suggested Prices Based on Cap Rates
Cap Rate 5%
$1,171,480
Cap Rate 7%
$836,771
Cap Rate 9%
$650,822
Alternative Uses
Best Use
Multifamily LT 5
$836.8K
$732.2K – $976.2K
NOI $58,574 @ 7.0% cap · market cap 6.17%
Second Best
Apartment 5plus
$748.4K
$654.9K – $873.2K
NOI $52,389 @ 7.0% cap · market cap 5.52%
Theoretical Best
Office A
$1.10M
$963.1K – $1.28M
NOI $77,044 @ 7.0% cap · market cap 8.12%
Zoning and permitted uses should be independently verified with authorities.
How Realmo checks its estimates
Property Analytics
Unlock full access to Insights
Subscribe to Realmo Intelligence
Open Analytics
Current Use
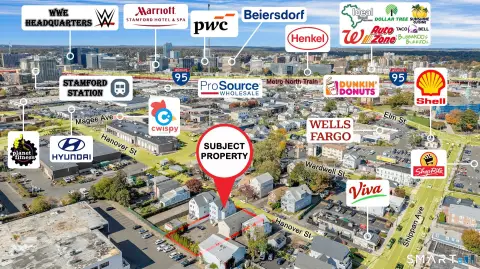
Location Intelligence
Trade Area within ½ mile
1,548
Businesses Nearby
Explore this area
Business Placement
Demographics for 06902, CT
69,192
Population
30,142
Households
2.3
Avg Household Size
36
Median Age
44%
College-Educated
85%
High-School Grad
10.0 sq mi
ZIP Area
6,919
Density / Sq Mi
$92,527
Median Household Income
$48,285
Median Earnings
$2,139
Median Rent
$515,000
Median Home Value
Check the figures for this property
Cap Rate, Value Estimation, Potential NOI and more
View Realmo Analytics
Market
Vacancy Rate% for Multifamily in Northeast region

Questions? Ask Rey
Realmo’s AI knows this listing — price, zoning, demand, history. Ask anything.



Frequently Asked Questions
What type of property is this?
Triplex - For-sale triplex in Stamford, offering a residential income structure for multi-unit ownership.
Where is this triplex located?
The property is located at 34 Raymond Stamford, CT.
What is the asking price?
The asking price for this property is $949,000.
What are key features of this property?
This property features: Triplex for sale in Stamford with residential income structure; Built in 1958


