Two-Story Professional Office
For Sale
$269,900
339 S RIDGEWOOD AVENUE, Daytona Beach, FL 32114
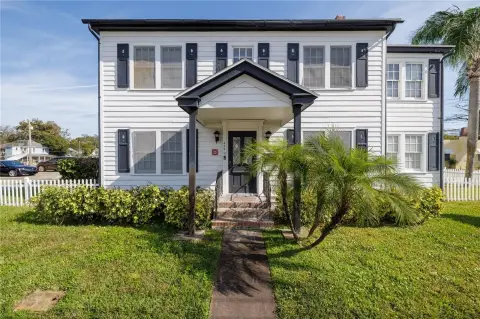
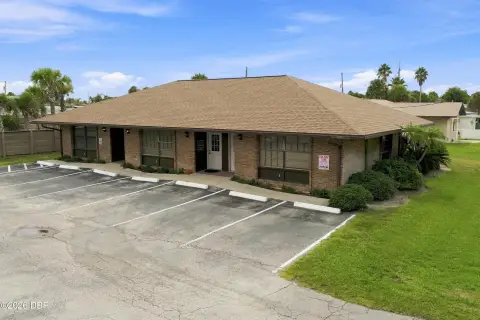
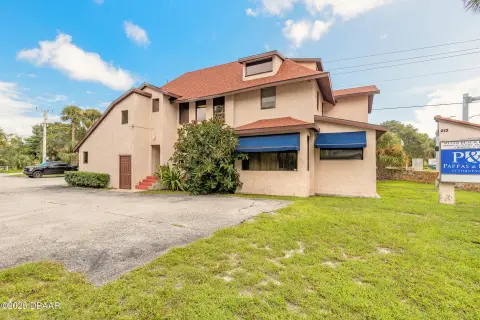
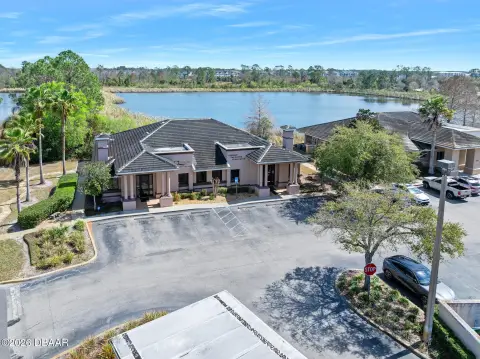
Two-story professional building with four offices, reception area, conference room, and rear parking with two covered spaces.
Property Size1,708 SF
Price / SF$158.02
Days on Market201
Property Features for 339 S RIDGEWOOD AVENUE
General Information
Standard status
Active
Size
1,708 SF
Property subtype
Office
Additional Details
Office Units
4
Amenities
0.24 acres
Shingle
Public Sewer
Additional parcels description:, Parcel Number: 5339-01-11-0021, Public Survey Range: 33, Public Survey Section: 39, Annual Amount: $3,132, Tax Block: 11, Tax Book Number: 2-82, Legal Description: SW 1/4 OF LOT 2 BLK 11 DAYTONA PER OR 4343 PG 4505 PER UNREC DC PER OR 6848 PG 4812, Lot: 2, Year: 2025, Zoning: 02BP
Carpet, Ceramic Tile
Central Air
Listing ID: MFRO6433730, Standard Status: Active, MLS Status: Active, Property Subtype: Office, On market as of 2026-08-14, 63 days on market, Special Conditions: None
Built in 1920, Living area: 1708, Living area units: Square Feet, Building faces West, 2 stories, Construction Materials: Frame
Subdivision: HODGMANS DAYTONA, MLS Area (Major): 32114 - Daytona Beach, County/Parish: Volusia
Public
Crawlspace
Close Of Escrow
Frontage Type: City Street, Road Surface: Asphalt
Security System
Accessible Approach with Ramp
Microwave, Refrigerator
Building Details
Year Built
1920
Stories
2
Listing Agency:
HOLT REAL ESTATE LLC
(386) 295-1267
Listed By:
Jennifer Cornette · License #3595719
(407) 506-2999
Source:
Miharaandassociates
Added: Apr 9
Changed: Oct 26
Last Checked: Oct 24 at 6:31PM
Displayed information is deemed reliable but is not guaranteed and should be independently verified. All listing content including descriptions, pricing, images are the copyrighted material of HOLT REAL ESTATE LLC

Ask AI about this property
Review the available facts, identify missing information and prepare questions for the agent.
Investment Insights
Based on property information with market context.
For sale is a two-story professional office building with four offices totaling 1,708 square feet. The first floor features a reception area, a spacious conference room, a private office, and a kitchen/breakroom. Upstairs includes three private offices. Recent renovations include fresh interior paint and new carpeting.
Located in downtown Daytona Beach, the property is described as a block away from Daytona Beach City Hall and close to courthouses and other professional establishments.
Additional improvements referenced include a newer roof and attic insulation, along with a foundation warranty. Parking is available in the rear, including two covered spaces.
Located in downtown Daytona Beach, the property is described as a block away from Daytona Beach City Hall and close to courthouses and other professional establishments.
Additional improvements referenced include a newer roof and attic insulation, along with a foundation warranty. Parking is available in the rear, including two covered spaces.
Key Highlights
- Downtown Daytona Beach two‑story professional building originally built in 1920
- 1708 SF includes a reception area, conference room, private office, and kitchen/breakroom on the first floor
- Second floor has three private offices for a total of four offices
Property Analytics
Contact the owner directly
Get the owner's phone numbers and email
Open Analytics
Current Use
Lease Details
4
Office units
Location Intelligence
Trade Area within ½ mile
1,667
Businesses Nearby
Explore this area
Business Placement
Demographics for 32114, FL
34,943
Population
17,118
Households
2
Avg Household Size
33
Median Age
19%
College-Educated
89%
High-School Grad
16.0 sq mi
ZIP Area
2,184
Density / Sq Mi
$39,906
Median Household Income
$31,220
Median Earnings
$1,171
Median Rent
$174,900
Median Home Value
Check the figures for this property
Cap Rate, Value Estimation, Potential NOI and more
View Realmo Analytics
Market
Vacancy Rate% for Office in South region



Frequently Asked Questions
What type of property is this?
Office building - Two-story professional building with four offices, reception area, conference room, and rear parking with two covered spaces.
Where is this office building located?
The property is located at 339 S RIDGEWOOD AVENUE Daytona Beach, FL.
What is the asking price?
The asking price for this property is $269,900.
What are key features of this property?
This property features: Downtown Daytona Beach two‑story professional building originally built in 1920; 1708 SF includes a reception area, conference room, private office, and kitchen/breakroom on the first floor; Second floor has three private offices for a total of four offices


