Corner Mixed-Use Commercial
For Sale
$3,500,000
3300 NW North River Dr, Miami, FL 33142
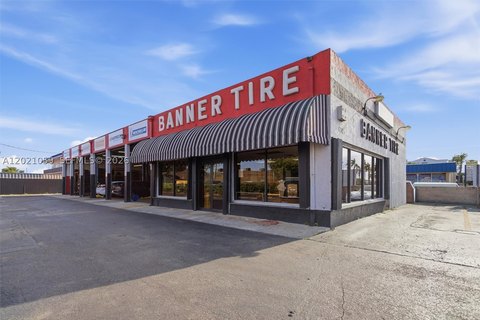
Corner-site building combines a front cafeteria and retail area with rear automotive sales operations.
Property Size5,458 SF
Lot Size0.24 Acres
Price / SF$641.26
Days on Market187
Property Features for 3300 NW North River Dr
General Information
Standard status
Active
Size
5,458 SF
Lot size
0.24 Acres
Property subtype
Commercial
Additional Details
Corner Location
Yes
Building Details
Building Size
5,458 SF
Year Built
1953
Buildings
1
Listing Agency:
FORTUNE CHRISTIE'S INTL R.E.
Listed By:
Michael Ramirez Garcia · License #A12062109
(305) 542-9470
Source:
Elliman
Added: Apr 11
Changed: Aug 29
Last Checked: Oct 12 at 6:49PM
Displayed information is deemed reliable but is not guaranteed and should be independently verified. All listing content including descriptions, pricing, images are the copyrighted material of FORTUNE CHRISTIE'S INTL R.E.
Investment Insights
Based on property information with market context.
This mixed-use commercial property occupies approximately 10,266 SF of land and includes an existing 5,458 SF building constructed in 1953. The current layout places a cafeteria and retail component toward the front, with automotive sales space at the rear. The building is described as supporting dual income and offers separate commercial functions within one property.
Positioned on a corner with dual frontage, the site provides direct exposure and internal circulation. Its Miami setting places it near major transportation routes, airport logistics, and commercial activity along the Miami River. Walk Score is 67, Bike Score is 56, and Transit Score is 44.
Positioned on a corner with dual frontage, the site provides direct exposure and internal circulation. Its Miami setting places it near major transportation routes, airport logistics, and commercial activity along the Miami River. Walk Score is 67, Bike Score is 56, and Transit Score is 44.
Key Highlights
- Approximately 10,266 SF of land
- Existing 5,458 SF building constructed in 1953
- Front cafeteria and retail component
Financial Insights
Estimated NOI and Cap Rate
NOI / Yr
$178,071
Cap Rate
5.09%
Suggested Prices Based on Cap Rates
Cap Rate 5%
$3,561,420
$3.6M
Cap Rate 7%
$2,543,871
$2.5M
Cap Rate 9%
$1,978,567
$2.0M
Market Conditions
NOI Build-Up for 5,458 SF
Gross rent
$283.6K $51.96/SF
− Vacancy
−$29.2K −$5.35/SF
EGI
$254.4K $46.61/SF
− OpEx
−$76.3K −$13.98/SF
NOI
$178.1K $32.63/SF
Area
Miami, FL
Vacancy
10.30%
Lease Rate
$51.96 /SF/Yr
Expense Ratio
30.00%
Simulate Cap Rate and NOI
Suggested Prices Based on Cap Rates
Cap Rate 5%
$3,561,420
Cap Rate 7%
$2,543,871
Cap Rate 9%
$1,978,567
Alternative Uses
Best Use
Retail
$2.54M
$2.23M – $2.97M
NOI $178,071 @ 7.0% cap · market cap 5.09%
Second Best
Mixed Use
$1.84M
$1.61M – $2.15M
NOI $128,945 @ 7.0% cap · market cap 3.68%
Theoretical Best
Specialty Retail
$3.68M
$3.22M – $4.30M
NOI $257,893 @ 7.0% cap · market cap 7.37%
Zoning and permitted uses should be independently verified with authorities.
How Realmo checks its estimates
Property Analytics
Current Use
Location Intelligence
Trade Area within ½ mile
1,567
Businesses Nearby
Explore this area
Business Placement
Demographics for 33142, FL
55,425
Population
22,275
Households
2.5
Avg Household Size
39
Median Age
13%
College-Educated
69%
High-School Grad
10.9 sq mi
ZIP Area
5,085
Density / Sq Mi
$37,900
Median Household Income
$29,109
Median Earnings
$1,289
Median Rent
$298,000
Median Home Value
Market
Vacancy Rate% for Industrial in Miami, FL

Questions? Ask Rey
Realmo’s AI knows this listing — price, zoning, demand, history. Ask anything.





Frequently Asked Questions
What type of property is this?
Mixed-use property - Corner-site building combines a front cafeteria and retail area with rear automotive sales operations.
Where is this mixed-use property located?
The property is located at 3300 NW North River Dr Miami, FL.
What is the asking price?
The asking price for this property is $3,500,000.
What are key features of this property?
This property features: Approximately 10,266 SF of land; Existing 5,458 SF building constructed in 1953; Front cafeteria and retail component


