Castro District Mixed-Use
For Sale
$1,595,000
Pending
327 Noe Street, San Francisco, CA 94114
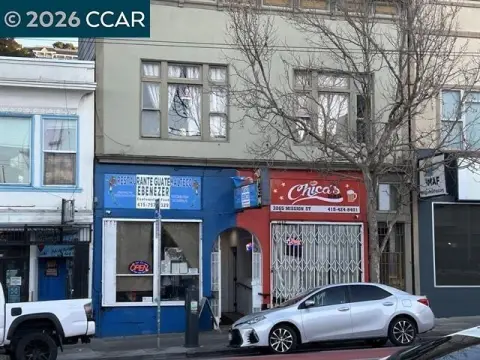
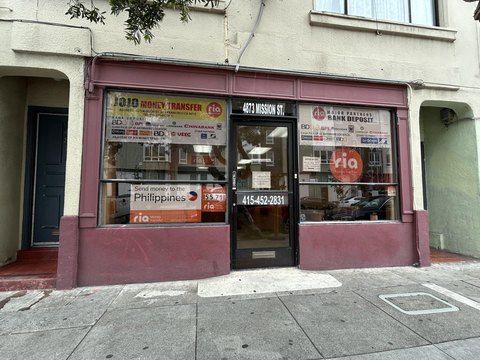
Two buildings in the Castro District with commercial and residential spaces.
Property Size3,000 SF
Lot Size0.06 Acres
Days on Market215
Property Features for 327 Noe Street
General Information
Standard status
Pending
Size
3,000 SF
Lot size
0.06 Acres
Property subtype
Mixed Use
Building Details
Building Size
3,000 SF
Year Built
1900
Listing Agency:
Jeremy Falk Blatteis, Broker
Listed By:
Jeremy Blatteis · License #01460566
(415) 981-2844
Source:
Bonniespindler
Added: Mar 16
Changed: Oct 11
Last Checked: Oct 15 at 6:01AM
Displayed information is deemed reliable but is not guaranteed and should be independently verified. All listing content including descriptions, pricing, images are the copyrighted material of Jeremy Falk Blatteis, Broker

Ask AI about this property
Review the available facts, identify missing information and prepare questions for the agent.
Investment Insights
Based on property information with market context.
This investment opportunity is located in the Castro District of San Francisco. Constructed in 1900, the property includes two buildings totaling 3,000 square feet on a 2,500 square foot lot. The property features an exterior facade and a courtyard. The building has a ground floor commercial space spread out over two structures. The property also includes a vacant second-floor residential unit with two bedrooms, one bathroom, and a bonus room that has been used as a third bedroom. The commercial space has 600 amp, 3-phase power. Located one block from Market Street, the property benefits from foot traffic and proximity to public transportation, shopping, dining, and entertainment. Short-term leases make this an attractive owner-user opportunity. The property offers income potential and a location in a culturally rich and historic neighborhood.
Key Highlights
- Prime location in the heart of San Francisco's iconic Castro District, benefiting from heavy foot traffic and access to amenities.
- Excellent income potential as a turnkey investment property.
- Ground floor commercial space spread over two structures, plus a vacant 2‑bedroom (plus bonus room) residential unit.
Financial Insights
Estimated NOI and Cap Rate
NOI / Yr
$66,938
Cap Rate
4.20%
Suggested Prices Based on Cap Rates
Cap Rate 5%
$1,338,760
$1.3M
Cap Rate 7%
$956,257
$956.3K
Cap Rate 9%
$743,756
$743.8K
Market Conditions
NOI Build-Up for 3,000 SF
Gross rent
$126.0K $42.00/SF
− Vacancy
−$18.9K −$6.30/SF
EGI
$107.1K $35.70/SF
− OpEx
−$40.2K −$13.39/SF
NOI
$66.9K $22.31/SF
Area
San Francisco, CA
Vacancy
15.00%
Lease Rate
$42.00 /SF/Yr
Expense Ratio
37.50%
Simulate Cap Rate and NOI
Suggested Prices Based on Cap Rates
Cap Rate 5%
$1,338,760
Cap Rate 7%
$956,257
Cap Rate 9%
$743,756
Alternative Uses
Best Use
Mixed Use
$956.3K
$836.7K – $1.12M
NOI $66,938 @ 7.0% cap · market cap 4.20%
Second Best
—
—
no second resolved use
Theoretical Best
Specialty Retail
$14.65M
$12.82M – $17.10M
NOI $1,025,764 @ 7.0% cap · market cap 64.31%
Zoning and permitted uses should be independently verified with authorities.
How Realmo checks its estimates
Property Analytics
Unlock full access to Insights
Subscribe to Realmo Intelligence
Open Analytics
Current Use
Location Intelligence
Trade Area within ½ mile
4,592
Businesses Nearby
Explore this area
Business Placement
Demographics for 94114, CA
33,683
Population
18,686
Households
1.8
Avg Household Size
40
Median Age
79%
College-Educated
98%
High-School Grad
1.4 sq mi
ZIP Area
24,059
Density / Sq Mi
$196,528
Median Household Income
$117,677
Median Earnings
$2,898
Median Rent
$1,771,700
Median Home Value
Check the figures for this property
Cap Rate, Value Estimation, Potential NOI and more
View Realmo Analytics



Frequently Asked Questions
What type of property is this?
Mixed-use property - Two buildings in the Castro District with commercial and residential spaces.
Where is this mixed-use property located?
The property is located at 327 Noe Street San Francisco, CA.
What is the asking price?
The asking price for this property is $1,595,000.
What are key features of this property?
This property features: Prime location in the heart of San Francisco's iconic Castro District, benefiting from heavy foot traffic and access to amenities.; Excellent income potential as a turnkey investment property.; Ground floor commercial space spread over two structures, plus a vacant 2‑bedroom (plus bonus room) residential unit.


