Historic Triplex
For Sale
$2,756,000
Pending
323 15TH Street, Brooklyn, NY 11215
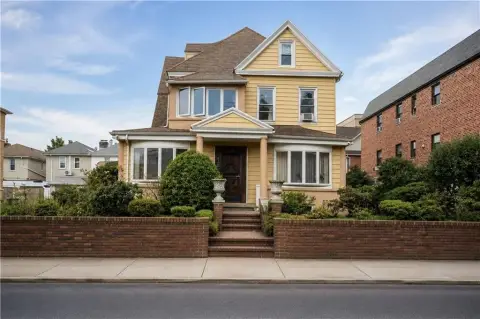
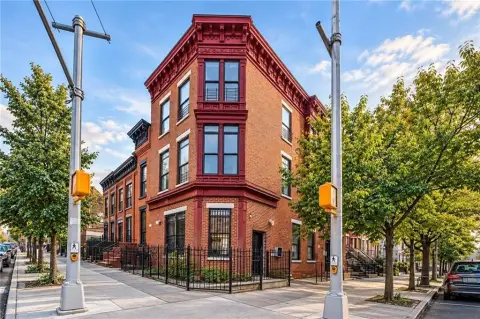
Three-family residence with high ceilings and oversized north- and south-facing windows in a garden-level sunken basement.
Property Size2,421 SF
Days on Market165
Property Features for 323 15TH Street
General Information
Standard status
Pending
Size
2,421 SF
Property subtype
Multi Family
Taxes and HOA fees
Annual Taxes
$5,796
Building Details
Building Size
2,421 SF
Year Built
1899
Buildings
1
Stories
3
Construction
brick
Tenancy
Multi
Listing Agency:
Corcoran Group
Listed By:
Joseph Pellegrino
(973) 204-3606
Source:
Howardhannanyc
Added: Apr 27
Changed: Sep 25
Last Checked: Oct 7 at 6:46PM
Displayed information is deemed reliable but is not guaranteed and should be independently verified. All listing content including descriptions, pricing, images are the copyrighted material of Corcoran Group
Investment Insights
Based on property information with market context.
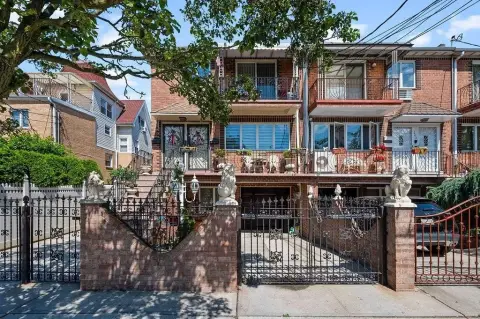
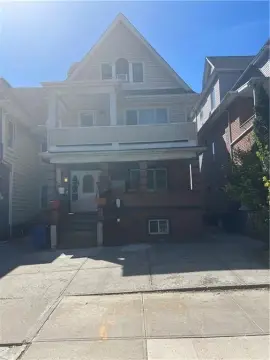
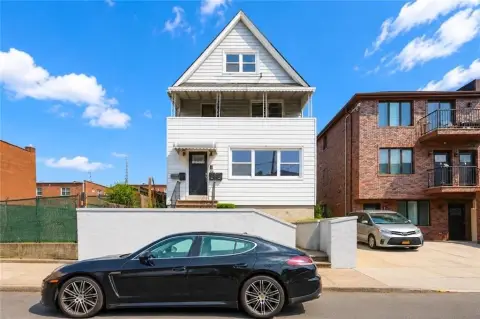
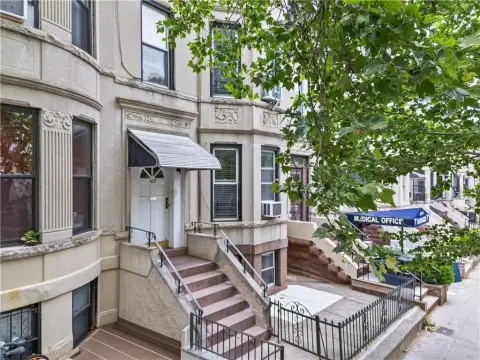
Built in 1899, this classic brick townhouse is currently configured as a three-family residence. Each full-floor apartment is well-kept and features high ceilings with oversized north- and south-facing windows that bring in natural light. The upper floors also offer open views across neighboring townhomes and treetops.
The garden level includes a flexible sunken basement with windows at both the front and rear. The approximately 2,421 square feet across three stories (excluding the basement) provides additional flexibility, with potential to expand by roughly 1,000 additional square feet.
Conveniently located near Park Slope neighborhood amenities and within close proximity to the F/G and N/R subway lines for commuting to Manhattan. Showings are by appointment only.
The garden level includes a flexible sunken basement with windows at both the front and rear. The approximately 2,421 square feet across three stories (excluding the basement) provides additional flexibility, with potential to expand by roughly 1,000 additional square feet.
Conveniently located near Park Slope neighborhood amenities and within close proximity to the F/G and N/R subway lines for commuting to Manhattan. Showings are by appointment only.
Key Highlights
- Built in 1899 classic brick townhouse configured as a three‑family residence
- High ceilings and oversized north- and south‑facing windows across the full‑floor apartments
- Approx 2,421 SF across three stories (excluding the basement)
Financial Insights
Estimated NOI and Cap Rate
NOI / Yr
$84,788
Cap Rate
3.08%
Suggested Prices Based on Cap Rates
Cap Rate 5%
$1,695,760
$1.7M
Cap Rate 7%
$1,211,257
$1.2M
Cap Rate 9%
$942,089
$942.1K
Market Conditions
NOI Build-Up for 2,421 SF
Gross rent
$123.5K $51.00/SF
− Vacancy
−$2.3K −$0.97/SF
EGI
$121.1K $50.03/SF
− OpEx
−$36.3K −$15.01/SF
NOI
$84.8K $35.02/SF
Area
Brooklyn, NY
Vacancy
1.90%
Lease Rate
$51.00 /SF/Yr
Expense Ratio
30.00%
Simulate Cap Rate and NOI
Suggested Prices Based on Cap Rates
Cap Rate 5%
$1,695,760
Cap Rate 7%
$1,211,257
Cap Rate 9%
$942,089
Alternative Uses
Best Use
Multifamily LT 5
$1.21M
$1.06M – $1.41M
NOI $84,788 @ 7.0% cap · market cap 3.08%
Second Best
Apartment 5plus
$1.06M
$923.9K – $1.23M
NOI $73,911 @ 7.0% cap · market cap 2.68%
Theoretical Best
Specialty Retail
$2.00M
$1.75M – $2.34M
NOI $140,321 @ 7.0% cap · market cap 5.09%
Zoning and permitted uses should be independently verified with authorities.
Property Analytics
Unlock full access to Insights
Subscribe to Realmo Intelligence
Open Analytics
Current Use
Lease Details
Multi-tenant
Tenancy
Location Intelligence
Trade Area within ½ mile
6,628
Businesses Nearby
Explore this area
Business Placement
Demographics for 11215, NY
67,493
Population
32,197
Households
2.1
Avg Household Size
37
Median Age
80%
College-Educated
96%
High-School Grad
2.2 sq mi
ZIP Area
30,679
Density / Sq Mi
$180,773
Median Household Income
$99,151
Median Earnings
$2,803
Median Rent
$1,674,700
Median Home Value
Check the figures for this property
Cap Rate, Value Estimation, Potential NOI and more
View Realmo Analytics
Market
Vacancy Rate% for Multifamily in Northeast region

Questions? Ask Rey
Realmo’s AI knows this listing — price, zoning, demand, history. Ask anything.


Frequently Asked Questions
What type of property is this?
Triplex - Three-family residence with high ceilings and oversized north- and south-facing windows in a garden-level sunken basement.
Where is this triplex located?
The property is located at 323 15TH Street Brooklyn, NY.
What is the asking price?
The asking price for this property is $2,756,000.
What are key features of this property?
This property features: Built in 1899 classic brick townhouse configured as a three‑family residence; High ceilings and oversized north- and south‑facing windows across the full‑floor apartments; Approx 2,421 SF across three stories (excluding the basement)


