Bi-Level Brownstone Income
For Sale
$699,000
Pending
32 Williams St, Boston, MA 02446
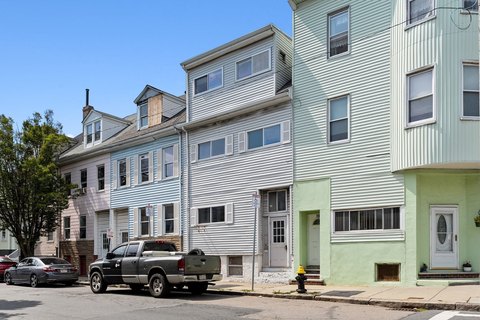
Historic condominium residence with two bedrooms, three baths, updated kitchen finishes, fireplaces, and flexible lower-level space.
Property Size1,800 SF
Days on Market90
Property Features for 32 Williams St
General Information
Standard status
Pending
Size
1,800 SF
Property subtype
Apartment
Units
Unit Mix
1 x 2BR/3BA
Multifamily Units
1
Amenities
fireplace
chefs kitchen
1 Fireplace
Baseboard
2.0 Stories
$7,200 Taxes
Public
Built in 1890
Building Details
Year Built
1890
Construction
brownstone
Listing Agency:
LAER Realty Partners
(844) 687-5237
Listed By:
Vision Realty Group
(617) 800-9111
Source:
Donahuere
Added: Jul 9
Changed: Oct 4
Last Checked: Oct 5 at 3:05PM
Displayed information is deemed reliable but is not guaranteed and should be independently verified. All listing content including descriptions, pricing, images are the copyrighted material of LAER Realty Partners
Investment Insights
Based on property information with market context.
This bi-level brownstone condominium combines historic character with updated interior finishes across nearly 1,800 square feet. The residence includes two bedrooms and three bathrooms, with hardwood floors, oversized windows, high ceilings, and two marble fireplaces contributing to the main-level design. The kitchen is equipped with granite countertops, stainless steel appliances, extensive cabinetry, and a center island.
A finished lower level adds adaptable living area that can accommodate a guest suite or home office. Built in 1890, the property is located in Roxbury at 32 Williams St, Boston, MA 02446.
A finished lower level adds adaptable living area that can accommodate a guest suite or home office. Built in 1890, the property is located in Roxbury at 32 Williams St, Boston, MA 02446.
Key Highlights
- Nearly 1,800 square feet of finished living space
- Bi‑level brownstone condominium built in 1890
- Two bedrooms and three bathrooms
Financial Insights
Estimated NOI and Cap Rate
NOI / Yr
$42,286
Cap Rate
6.05%
Suggested Prices Based on Cap Rates
Cap Rate 5%
$845,720
$845.7K
Cap Rate 7%
$604,086
$604.1K
Cap Rate 9%
$469,844
$469.8K
Market Conditions
NOI Build-Up for 1,800 SF
Gross rent
$79.9K $44.40/SF
− Vacancy
−$3.0K −$1.69/SF
EGI
$76.9K $42.71/SF
− OpEx
−$34.6K −$19.22/SF
NOI
$42.3K $23.49/SF
Area
Boston, MA
Vacancy
3.80%
Lease Rate
$44.40 /SF/Yr
Expense Ratio
45.00%
Simulate Cap Rate and NOI
Suggested Prices Based on Cap Rates
Cap Rate 5%
$845,720
Cap Rate 7%
$604,086
Cap Rate 9%
$469,844
Alternative Uses
Best Use
Apartment 5plus
$604.1K
$528.6K – $704.8K
NOI $42,286 @ 7.0% cap · market cap 6.05%
Second Best
—
—
no second resolved use
Theoretical Best
Office A
$1.35M
$1.18M – $1.57M
NOI $94,349 @ 7.0% cap · market cap 13.50%
Zoning and permitted uses should be independently verified with authorities.
Property Analytics
Unlock full access to Insights
Subscribe to Realmo Intelligence
Open Analytics
Current Use
Lease Details
1
Residential units
Location Intelligence
Trade Area within ½ mile
3,837
Businesses Nearby
Explore this area
Business Placement
Demographics for 02446, MA
31,957
Population
15,298
Households
2.1
Avg Household Size
34
Median Age
85%
College-Educated
97%
High-School Grad
1.3 sq mi
ZIP Area
24,582
Density / Sq Mi
$127,519
Median Household Income
$73,950
Median Earnings
$2,757
Median Rent
$1,172,800
Median Home Value
Check the figures for this property
Cap Rate, Value Estimation, Potential NOI and more
View Realmo Analytics

Questions? Ask Rey
Realmo’s AI knows this listing — price, zoning, demand, history. Ask anything.




Frequently Asked Questions
What type of property is this?
Residential income property - Historic condominium residence with two bedrooms, three baths, updated kitchen finishes, fireplaces, and flexible lower-level space.
Where is this residential income property located?
The property is located at 32 Williams St Boston, MA.
What is the asking price?
The asking price for this property is $699,000.
What are key features of this property?
This property features: Nearly 1,800 square feet of finished living space; Bi‑level brownstone condominium built in 1890; Two bedrooms and three bathrooms