Mixed-Use Property with Income
For Sale
$1,100,000
32 Main Rd, Tiverton, RI 02878
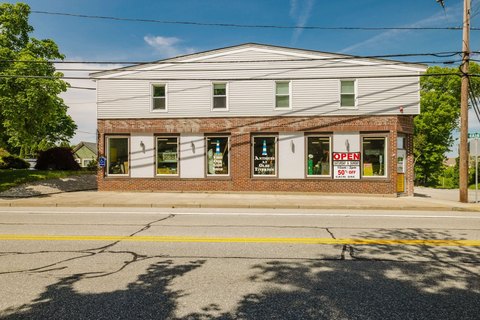
Three buildings with 13 rentable units, offering income potential.
Property Size11,841 SF
Price / SF$92.90
Days on Market203
Property Features for 32 Main Rd
General Information
Standard status
Active
Size
11,841 SF
Building Details
Year Built
1900
Listing Agency:
Castle Keep Realty Corp.
Listed By:
Cesar Duarte Patricio · License #RES.0043505
(508) 677-1600
Source:
Alpernandmesenbourg
Added: Mar 26
Changed: Oct 4
Last Checked: Oct 12 at 11:31PM
Displayed information is deemed reliable but is not guaranteed and should be independently verified. All listing content including descriptions, pricing, images are the copyrighted material of Castle Keep Realty Corp.
Investment Insights
Based on property information with market context.
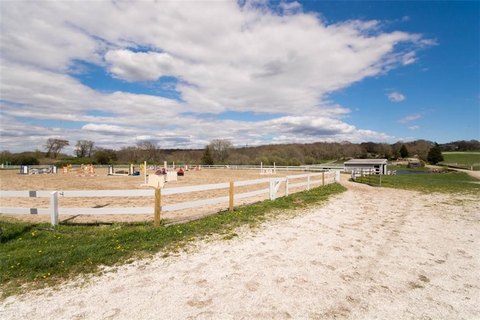
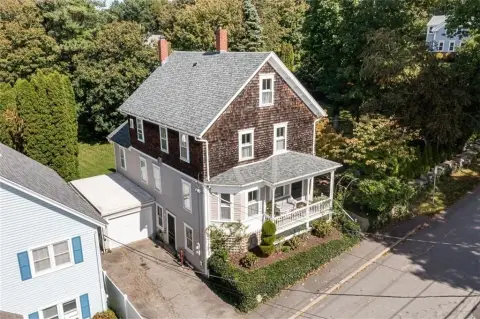
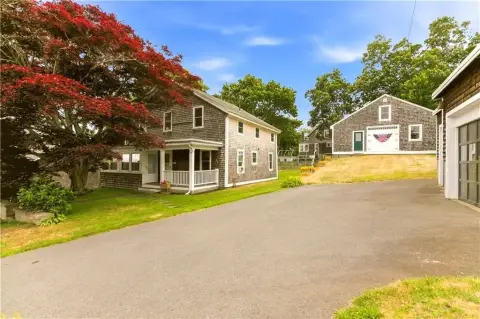
This property presents a unique opportunity to own a single lot improved with three income-generating buildings. The first building, located at 28-32 Main Rd, is a mixed-use structure featuring four residential units totaling 4,270 square feet and two retail storefront units totaling 1,522 square feet. The second building, at 36 Main Rd, contains one large storefront unit of 2,748 square feet, which could potentially be divided into two separate units. This unit includes a storage room and a bathroom at the rear. Behind the storefront section of this building are two garage units offering 2,457 square feet. The third building, situated at 27 Rock St, comprises three garage units and an office loft area above. Each floor of the 27 Rock St building provides 1,118 square feet. In total, the property includes 13 rentable units, currently grossing $98,280 annually with rents that are below market value. The property size is 11,841 square feet.
Key Highlights
- Three income‑generating buildings on one lot.
- Thirteen rentable units provide diverse income streams.
- Gross annual income of $98,280 with below‑market rents offers revenue growth potential.
Financial Insights
Estimated NOI and Cap Rate
NOI / Yr
$55,093
Cap Rate
5.01%
Suggested Prices Based on Cap Rates
Cap Rate 5%
$1,101,860
$1.1M
Cap Rate 7%
$787,043
$787.0K
Cap Rate 9%
$612,144
$612.1K
Market Conditions
NOI Build-Up for 11,841 SF
Gross rent
$82.4K $6.96/SF
− Vacancy
−$3.7K −$0.31/SF
EGI
$78.7K $6.65/SF
− OpEx
−$23.6K −$1.99/SF
NOI
$55.1K $4.65/SF
Area
Newport County, RI
Vacancy
4.50%
Lease Rate
$6.96 /SF/Yr
Expense Ratio
30.00%
Simulate Cap Rate and NOI
Suggested Prices Based on Cap Rates
Cap Rate 5%
$1,101,860
Cap Rate 7%
$787,043
Cap Rate 9%
$612,144
Alternative Uses
Best Use
Apartment 5plus
$2.51M
$2.20M – $2.93M
NOI $175,886 @ 7.0% cap · market cap 15.99%
Second Best
Retail
$1.91M
$1.67M – $2.23M
NOI $133,606 @ 7.0% cap · market cap 12.15%
Theoretical Best
Multifamily LT 5
$2.83M
$2.47M – $3.30M
NOI $197,771 @ 7.0% cap · market cap 17.98%
Zoning and permitted uses should be independently verified with authorities.
How Realmo checks its estimates
Property Analytics
Unlock full access to Insights
Subscribe to Realmo Intelligence
Open Analytics
Current Use
Location Intelligence
Trade Area within ½ mile
259
Businesses Nearby
Explore this area
Business Placement
Demographics for 02878, RI
16,359
Population
7,747
Households
2.1
Avg Household Size
50
Median Age
40%
College-Educated
93%
High-School Grad
29.1 sq mi
ZIP Area
562
Density / Sq Mi
$99,542
Median Household Income
$49,228
Median Earnings
$1,228
Median Rent
$367,400
Median Home Value
Check the figures for this property
Cap Rate, Value Estimation, Potential NOI and more
View Realmo Analytics
Market
Vacancy Rate% for Industrial in Northeast region

Questions? Ask Rey
Realmo’s AI knows this listing — price, zoning, demand, history. Ask anything.



Frequently Asked Questions
What type of property is this?
Mixed-use property - Three buildings with 13 rentable units, offering income potential.
Where is this mixed-use property located?
The property is located at 32 Main Rd Tiverton, RI.
What is the asking price?
The asking price for this property is $1,100,000.
What are key features of this property?
This property features: Three income‑generating buildings on one lot.; Thirteen rentable units provide diverse income streams.; Gross annual income of $98,280 with below‑market rents offers revenue growth potential.


