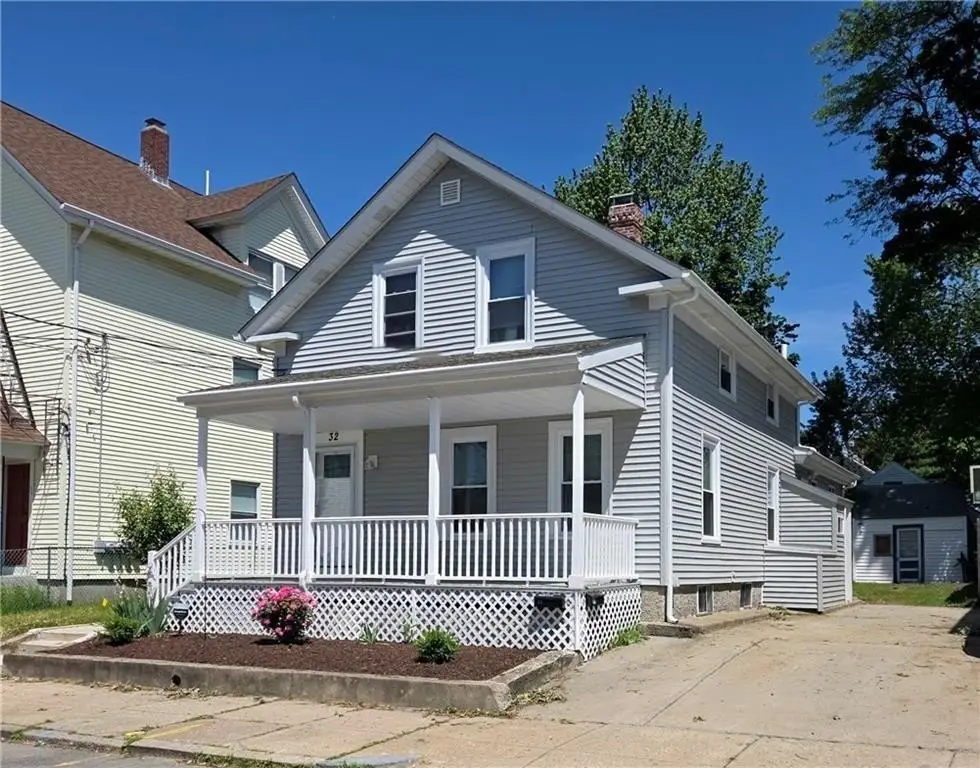
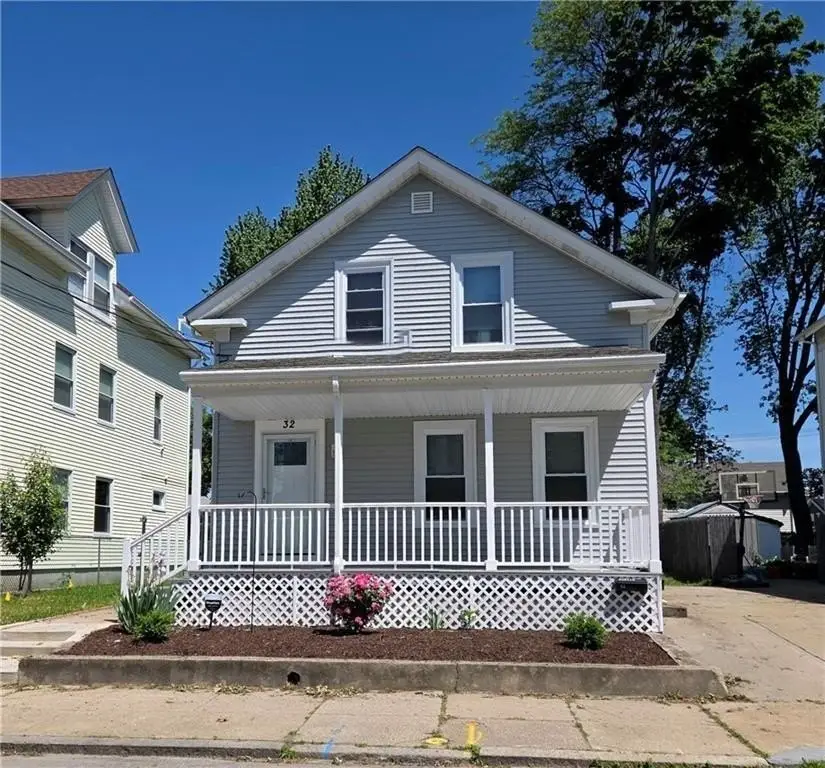
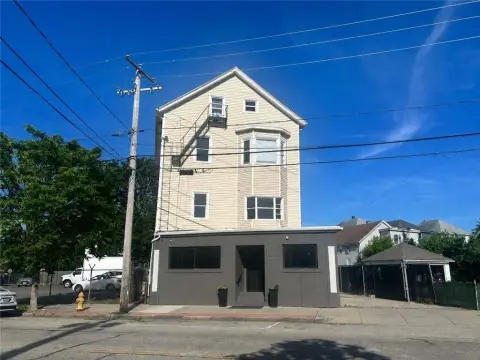
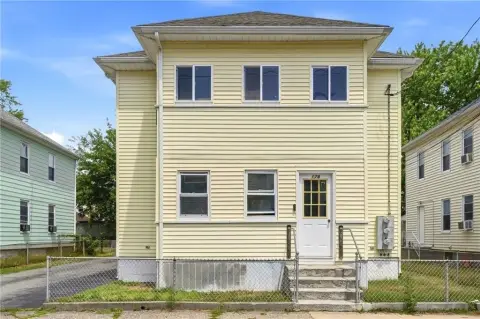
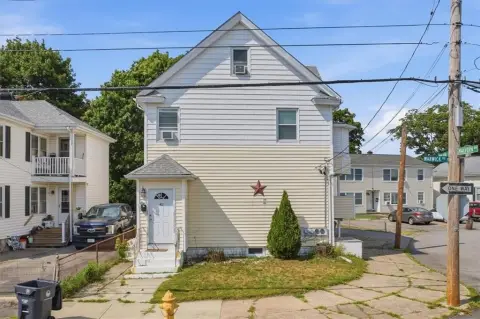
Renovated Two-Family
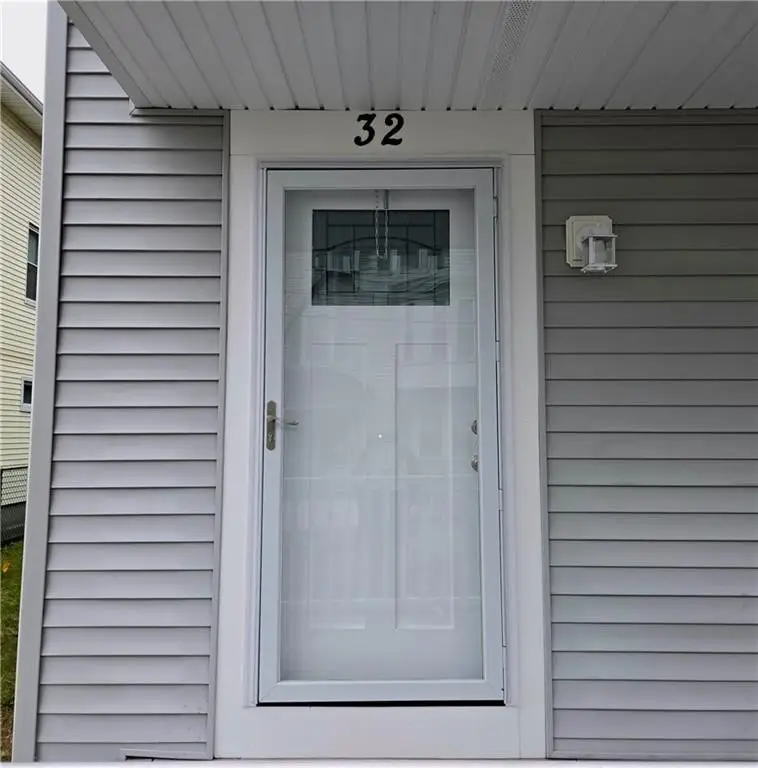
32 Gooding Street Pawtucket, RI 02860
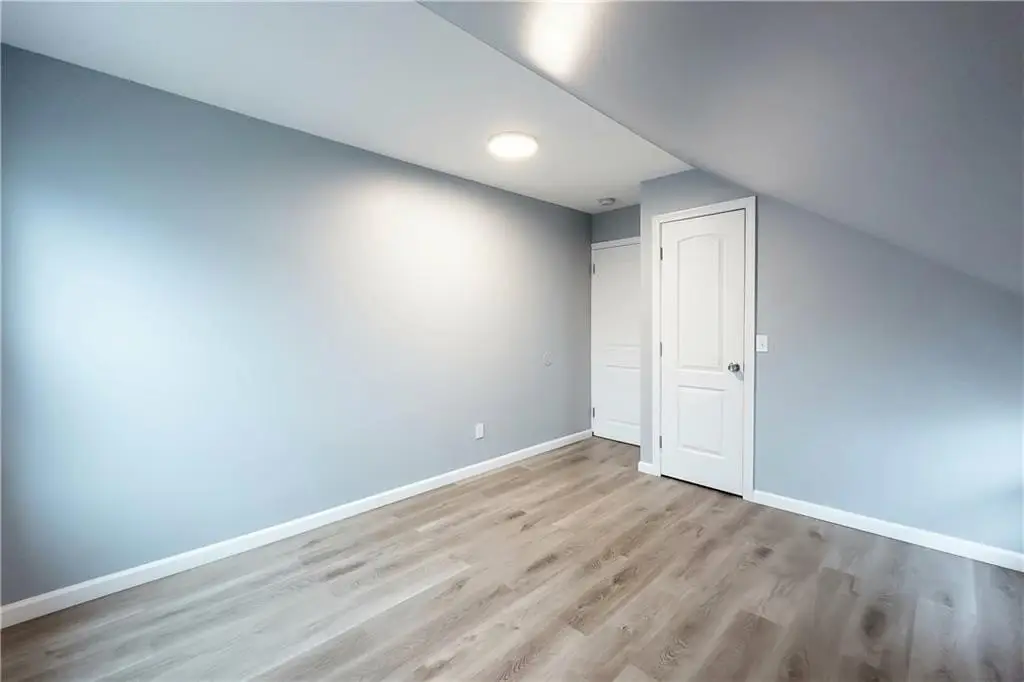
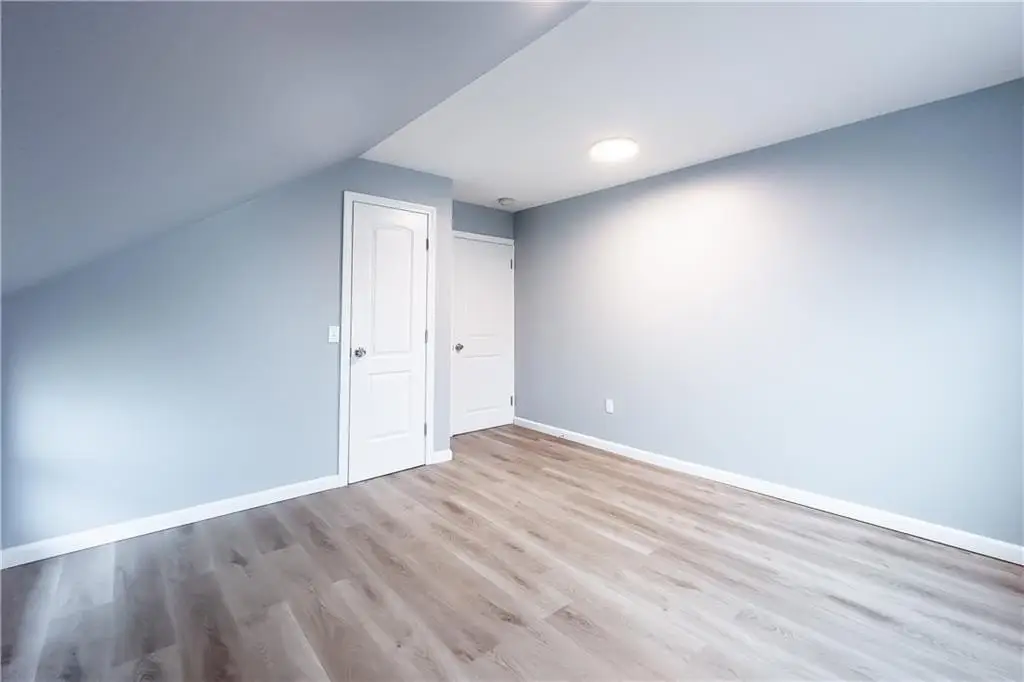
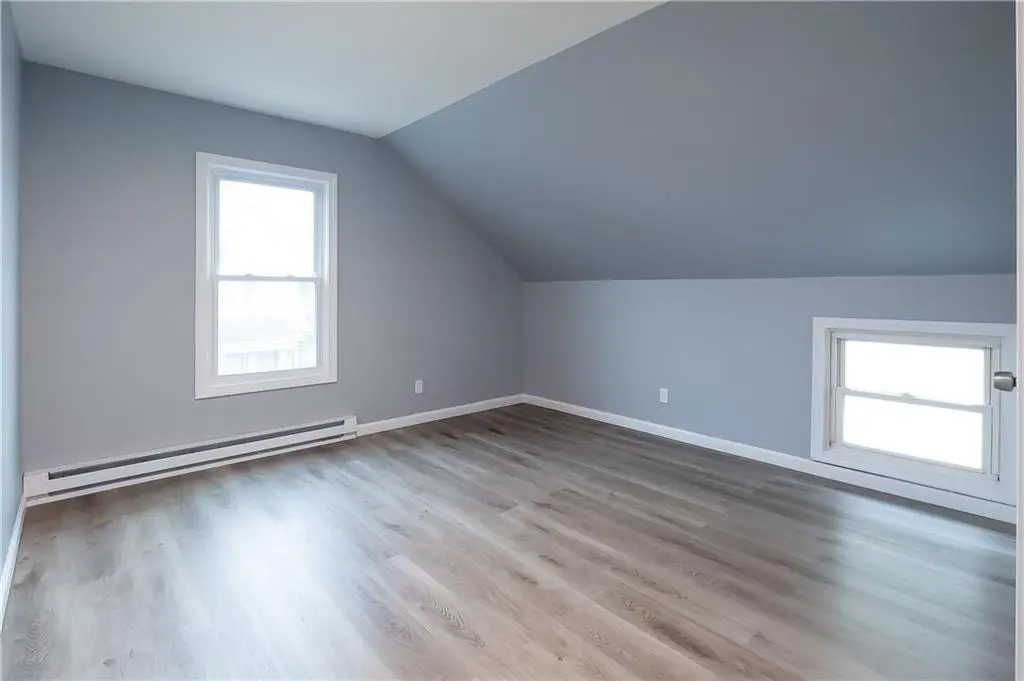
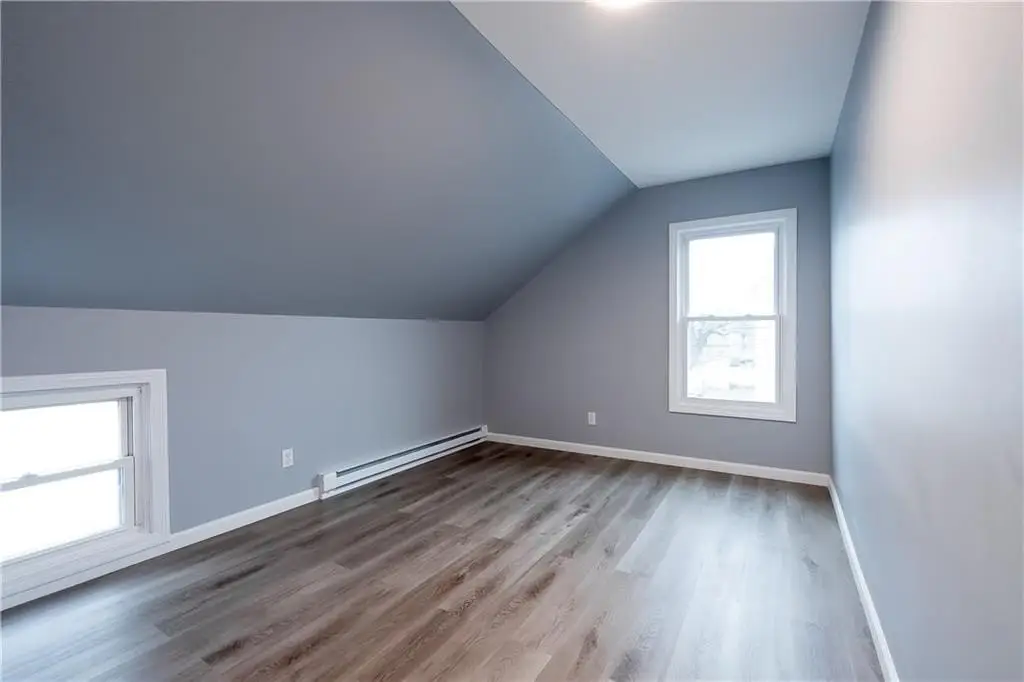
For Sale
$499,977
Pending
MULTI_FAMILY - Pawtucket, RI
Property Size1,806 SF
Lot Size0.11 Acres
Days on Market54
Property Features for 32 Gooding Street
General Information
Property type
Residential Multi Family
Property subtype
Other
Zoning
RM
Bedrooms
5
Bathrooms
2
Rooms
Bathroom 2, Bedroom 1, Bedroom 2, Bedroom 4, Basement, Bedroom 5, Bedroom 3, Bathroom 1
Parking
3
Parking features
None
Window features
Insulated Windows
Patio and Porch features
Porch
Interior features
Wall (Dry Wall), Stairs, Insulation (Ceiling), Insulation (Floors), Insulation (Walls)
Exterior features
Porch
Basement
Partial, Unfinished, Storage Space
Appliances
Gas Water Heater, Dishwasher, Microwave, Oven/Range, Refrigerator
Standard status
Pending
Size
1,806 SF
Lot size
0.11 Acres
Taxes and HOA fees
Tax Year
2025
Tax Annual Amount
4804
Utilities
Heating system
Baseboard, Natural Gas, Electric (Heating)
Building Details
Year built
1870
Floors in Building
2
Number of units
2
Flooring type
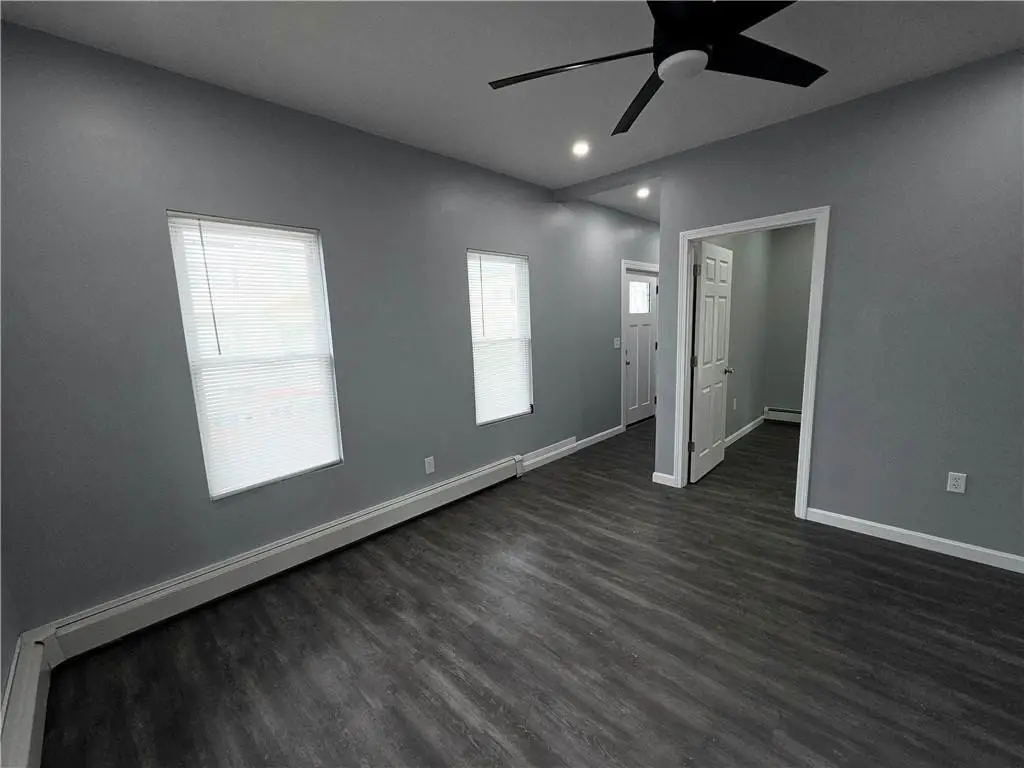
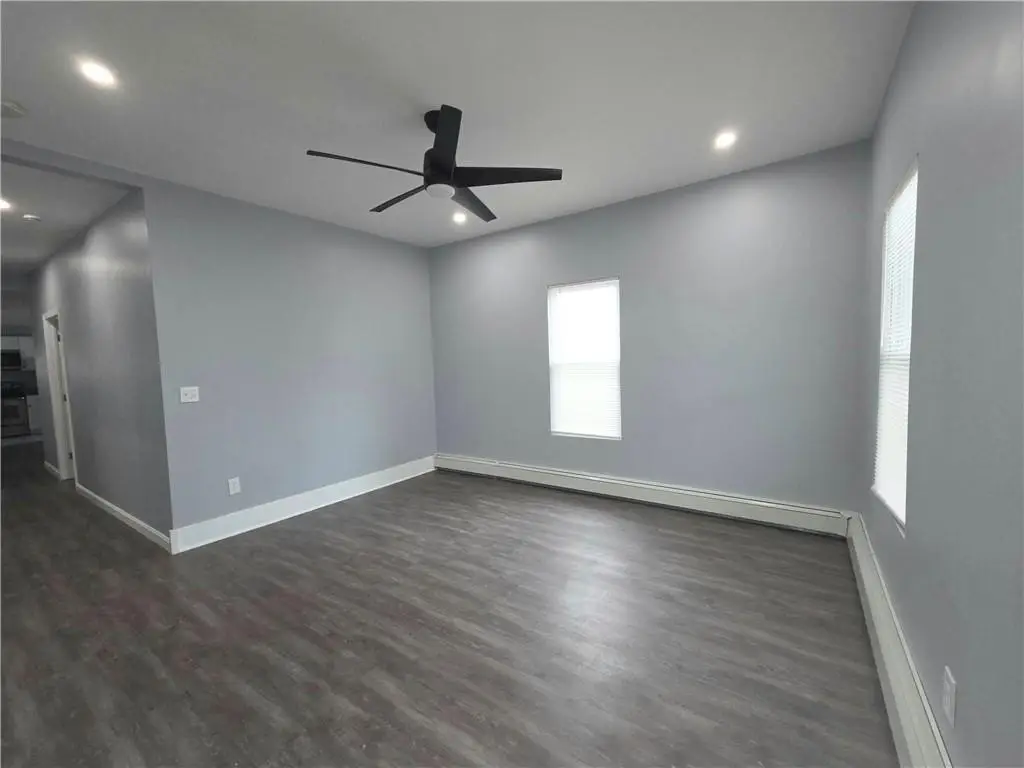
Vinyl
Building materials
Dry Wall, Vinyl Siding
Listing Agency:
Re/Max Real Estate Center
(401) 823-7600
Listed By:
David Tatangelo · License #S29833
(401) 465-0263
Added: Jun 4
Changed: Jul 23
Last Checked: Jul 27 at 1:06PM
MLS# 1414547
Copyright © 2026 State Wide MLS of Rhode Island, Inc. All rights reserved. All information provided by the listing agent/broker is deemed reliable but is not guaranteed and should be independently verified.
Investment Insights
Based on property information with market context.
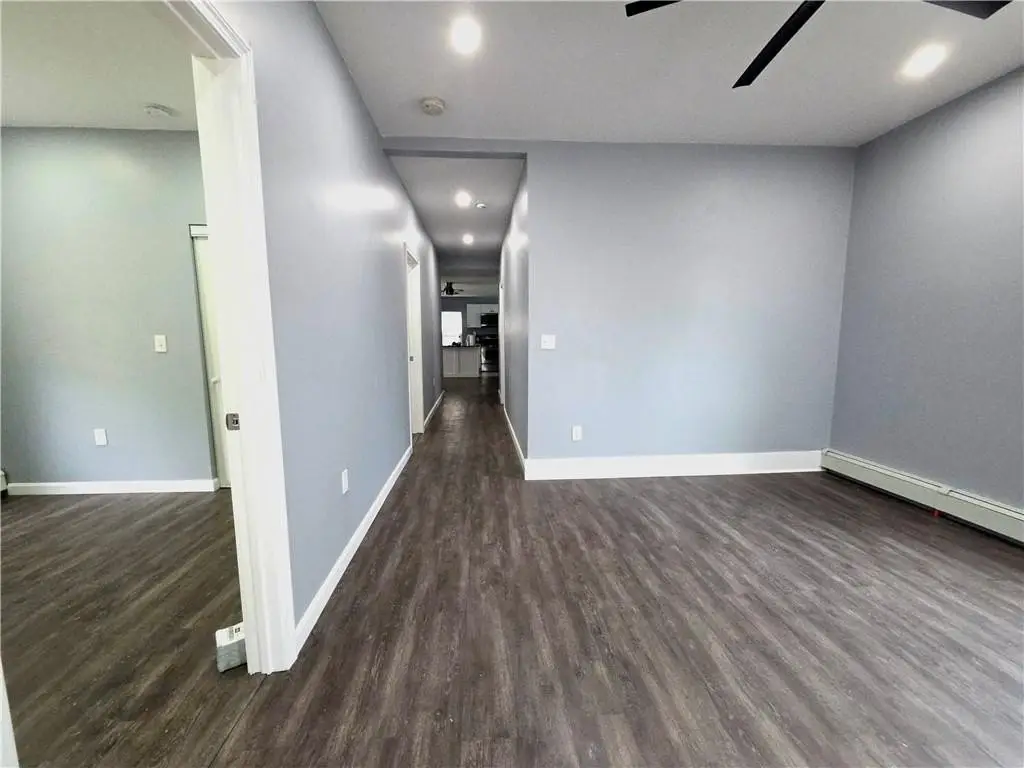
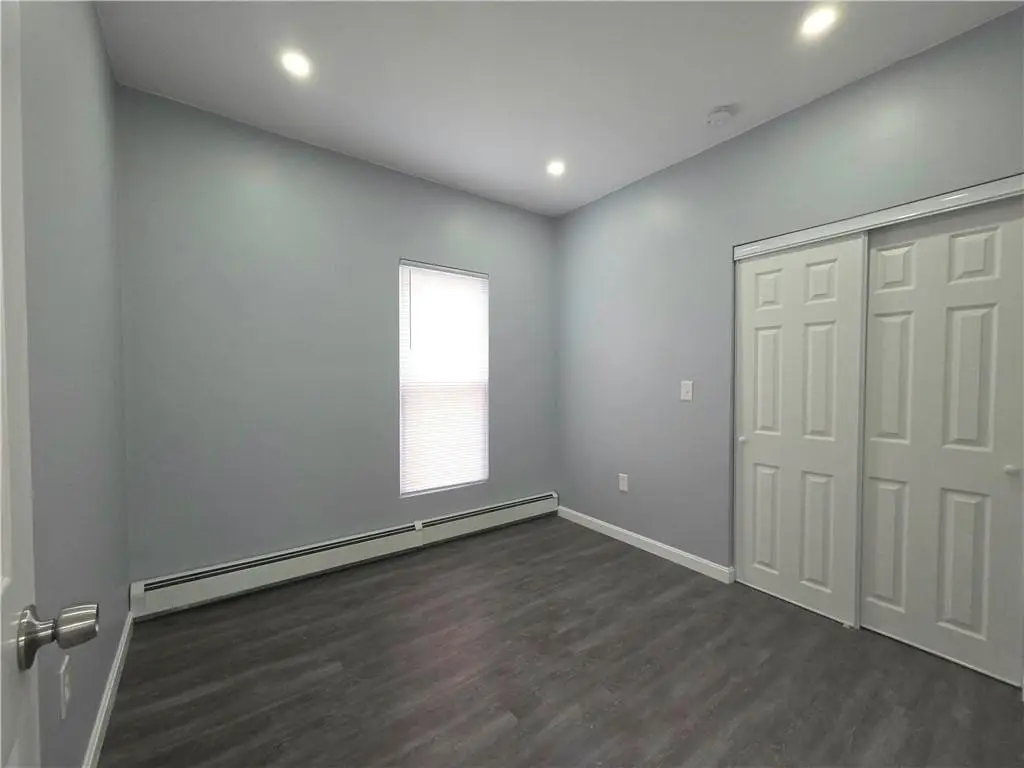
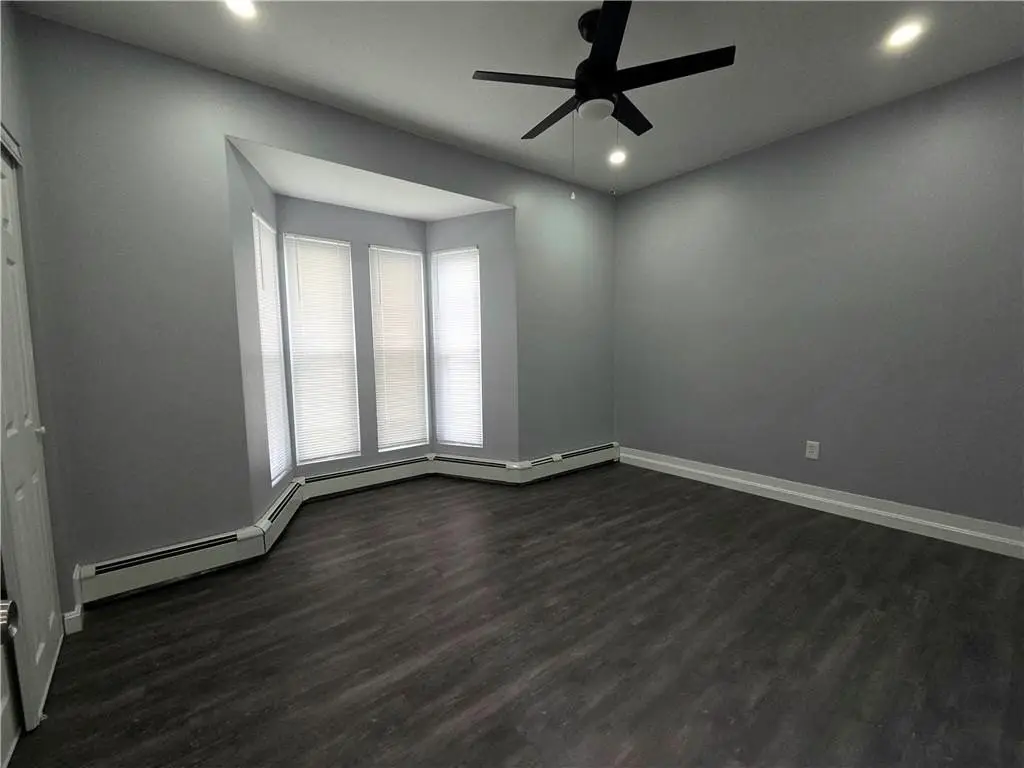
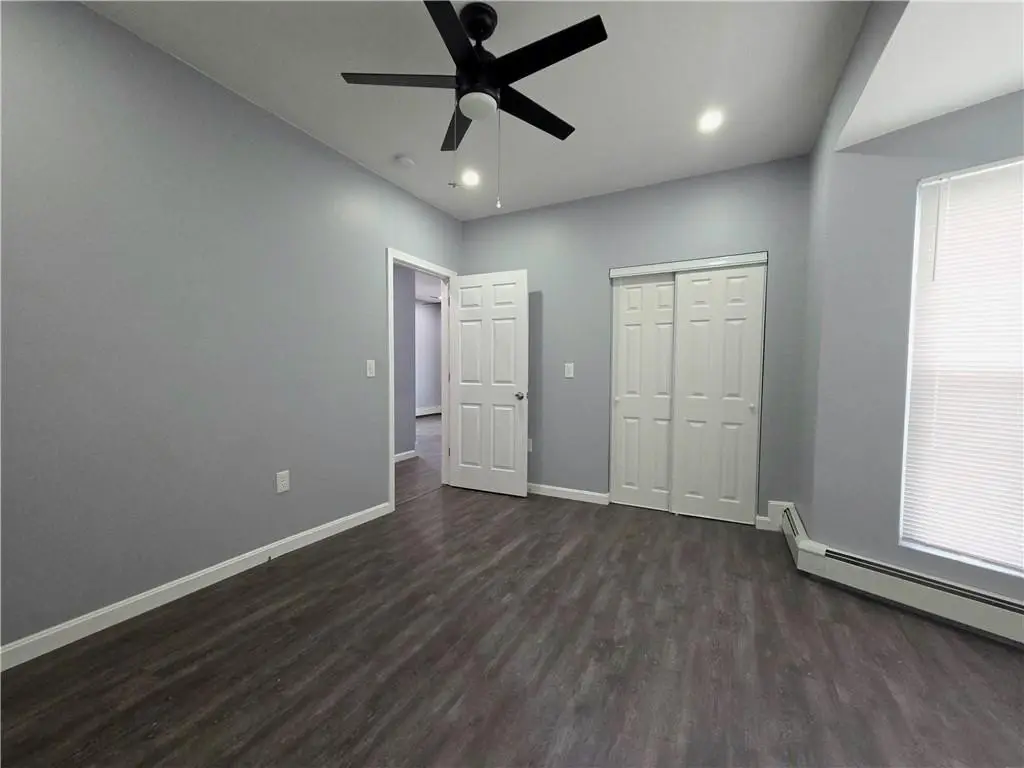
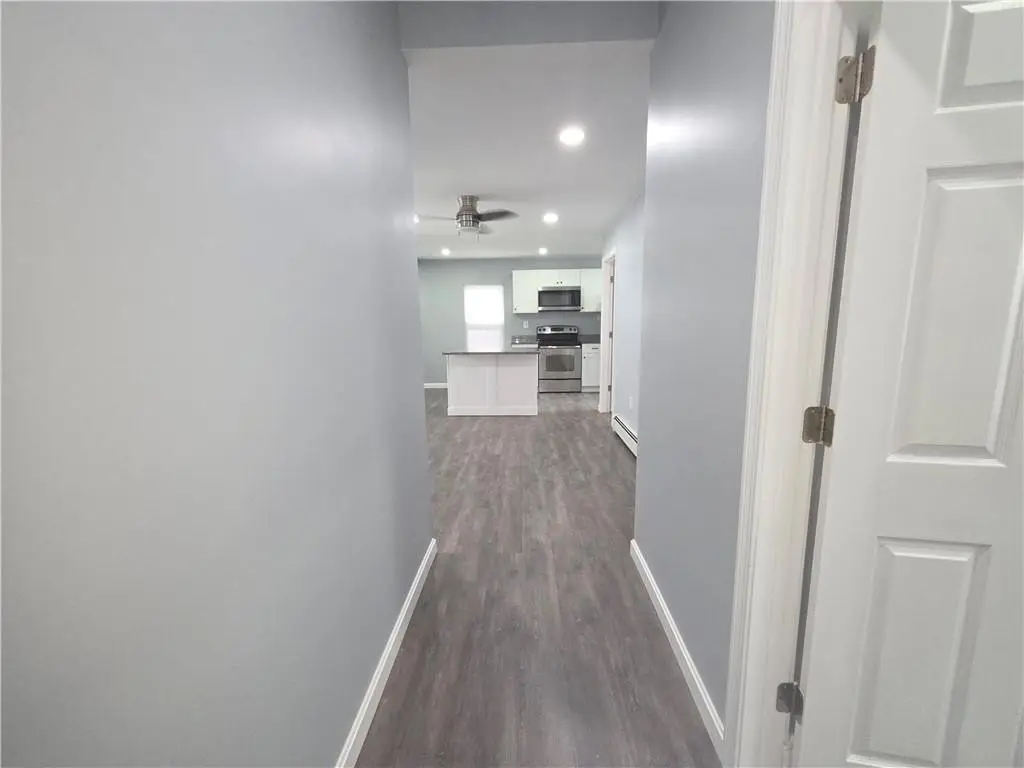
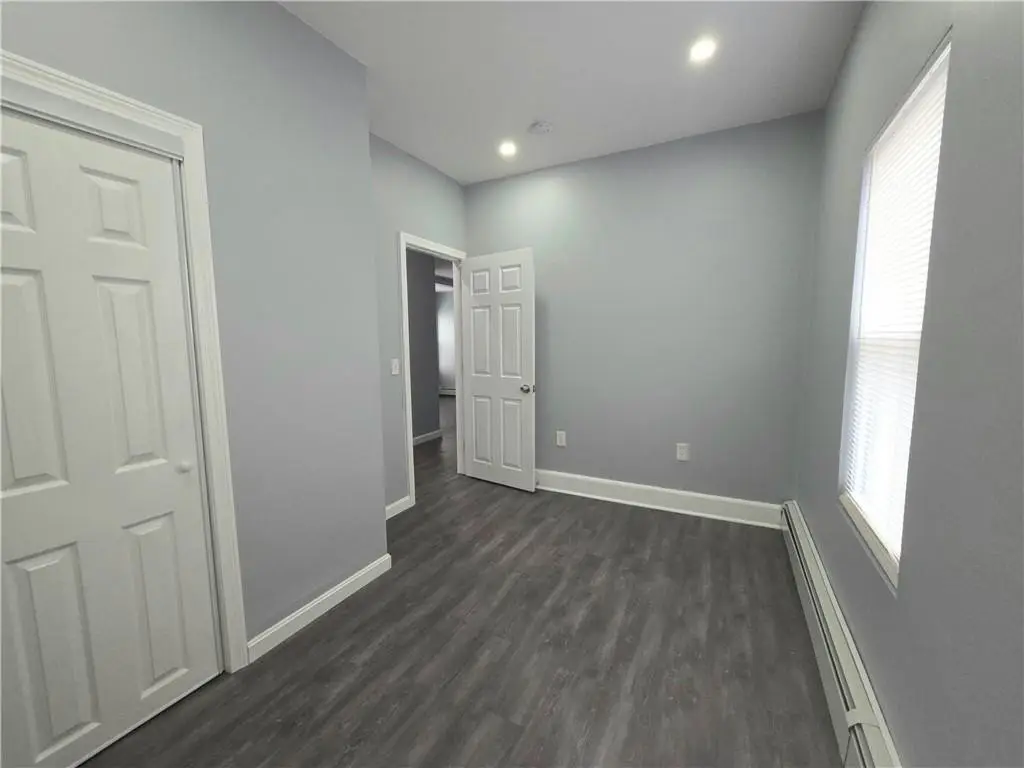
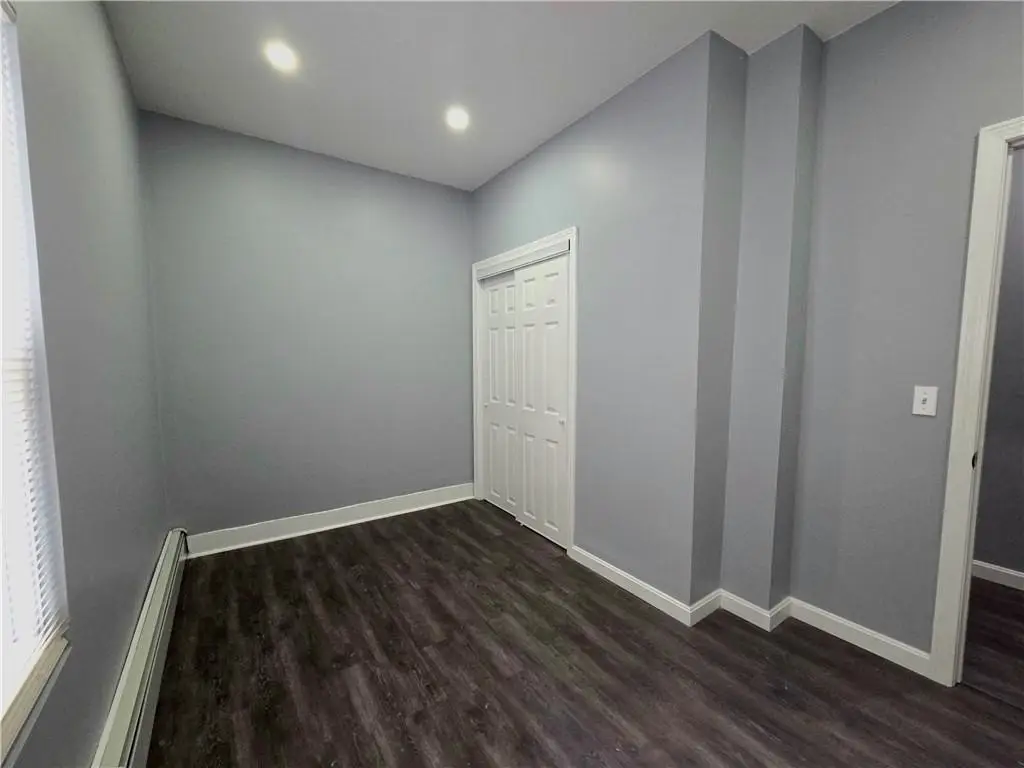
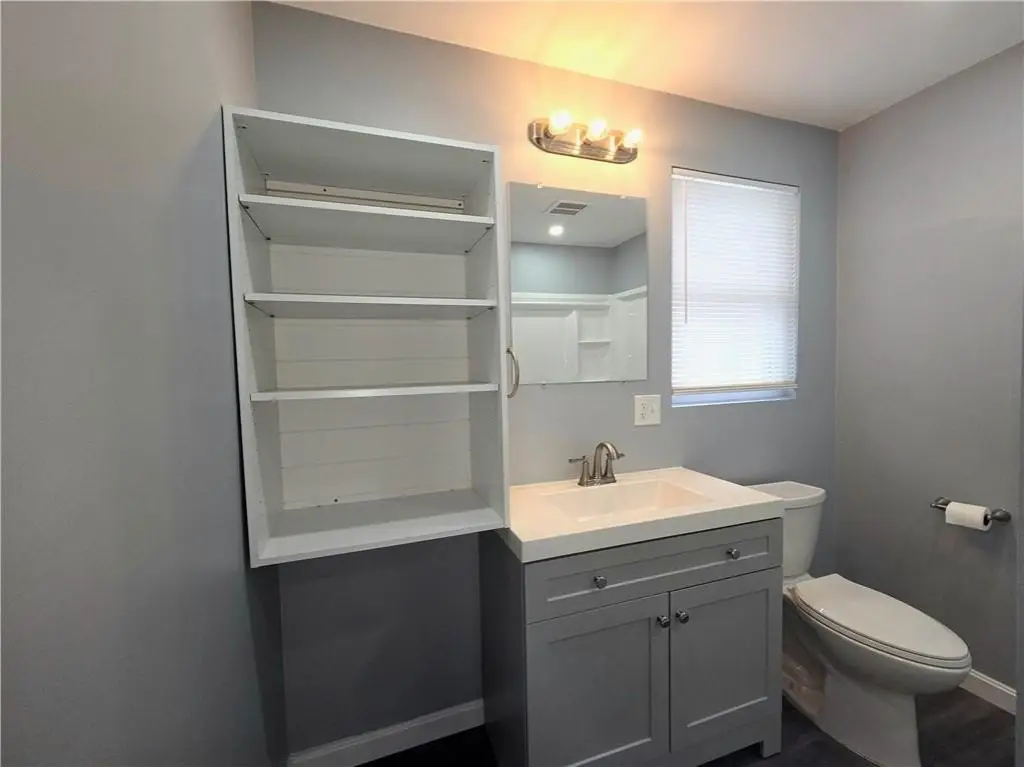
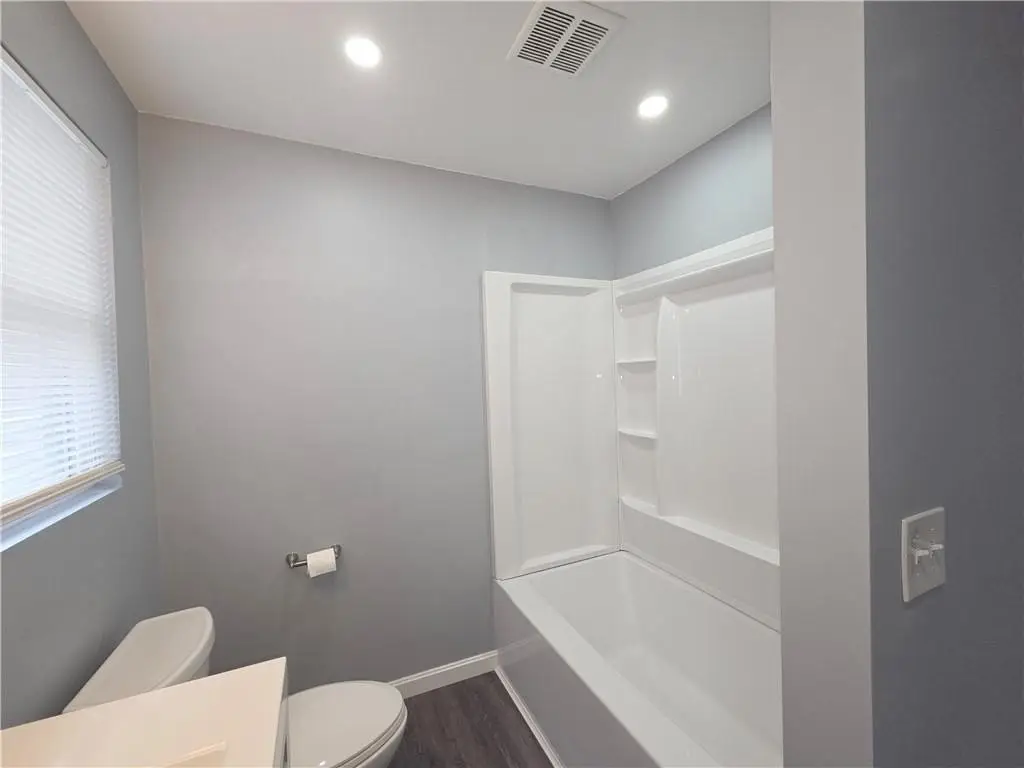
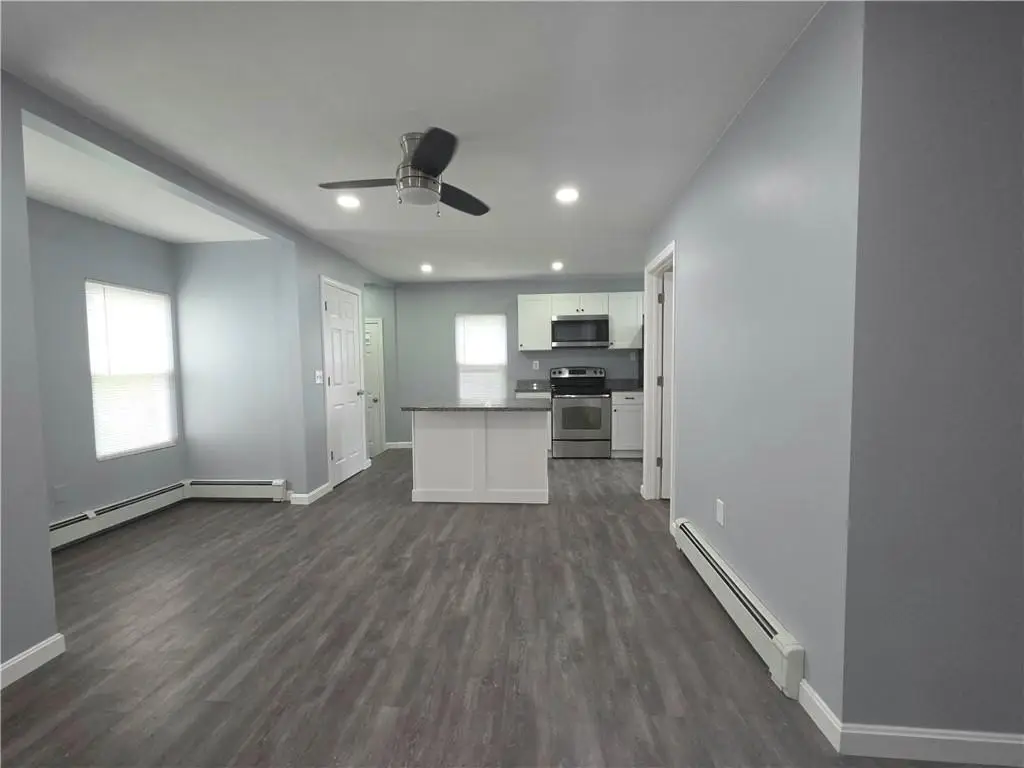
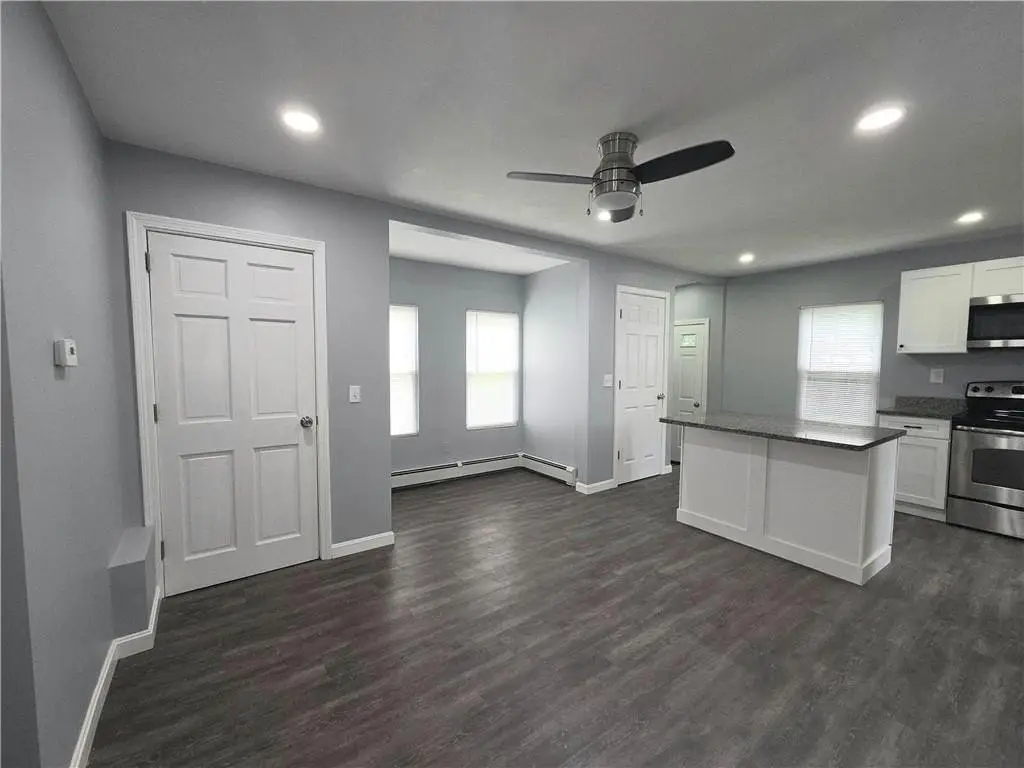
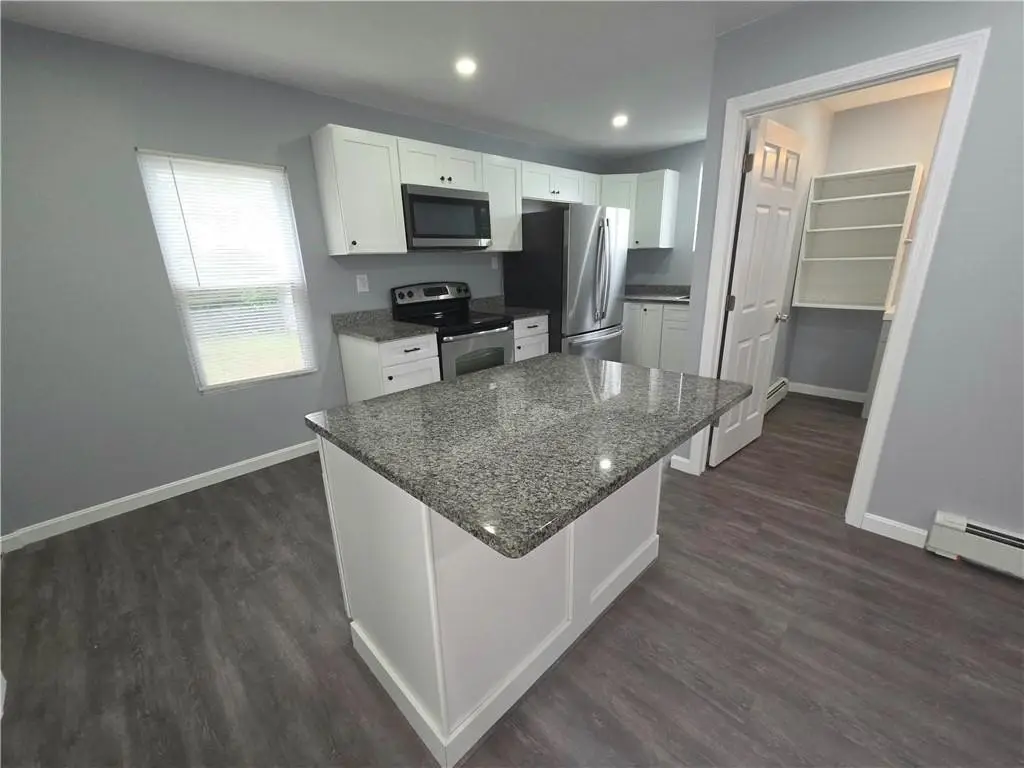
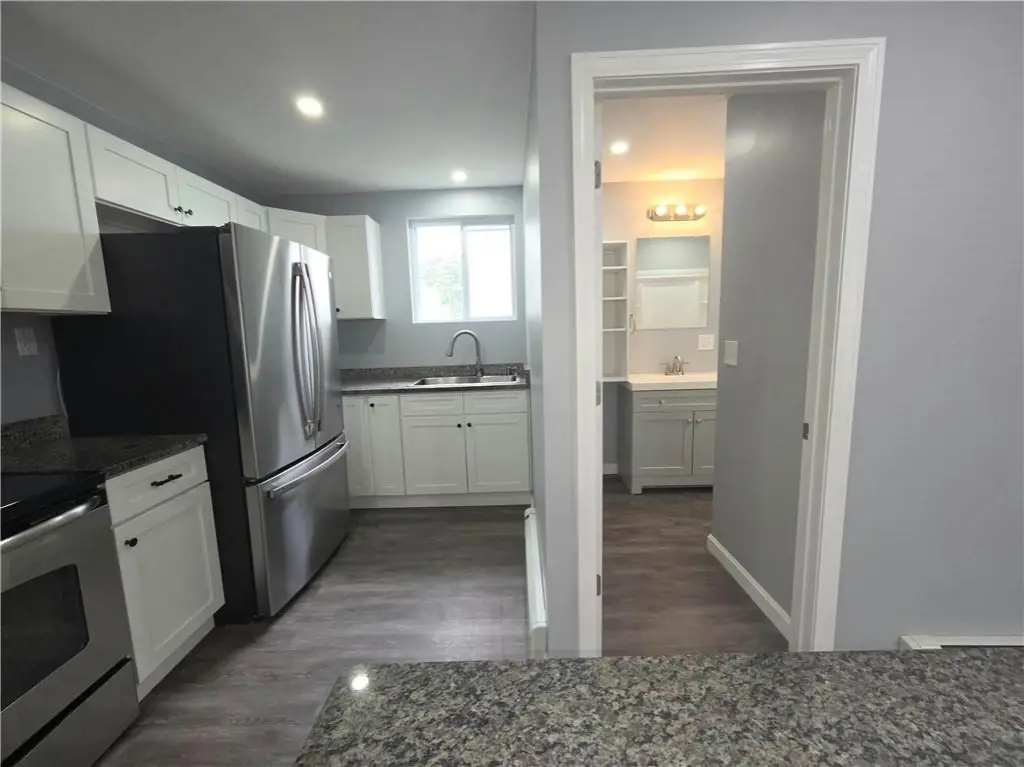
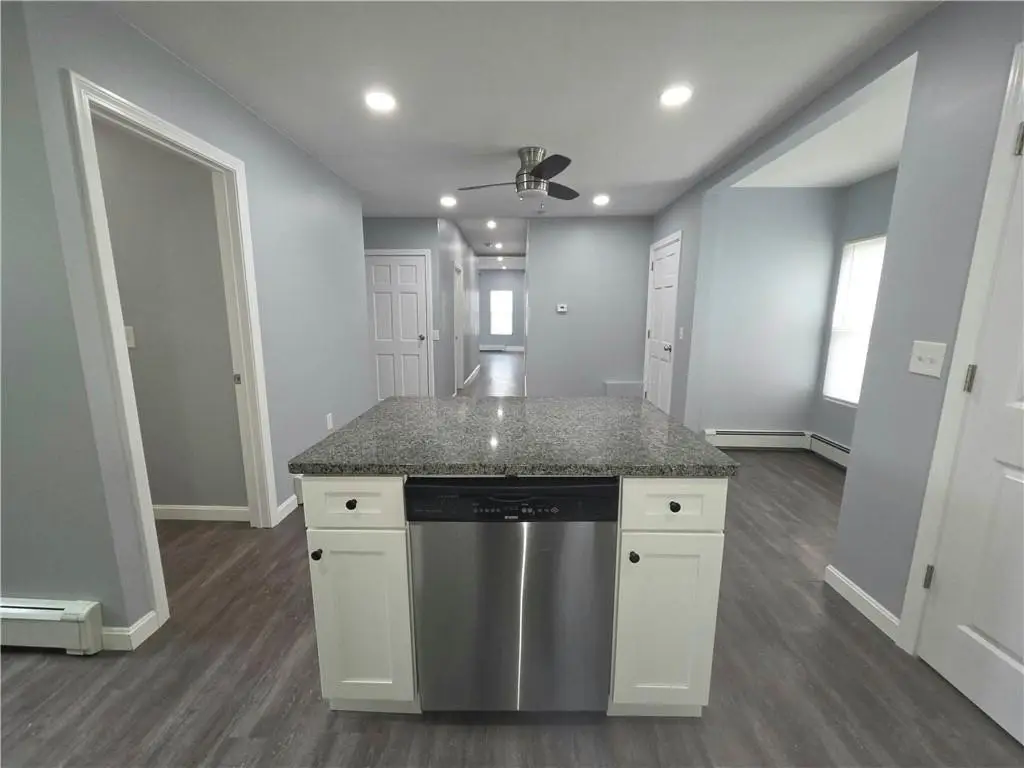
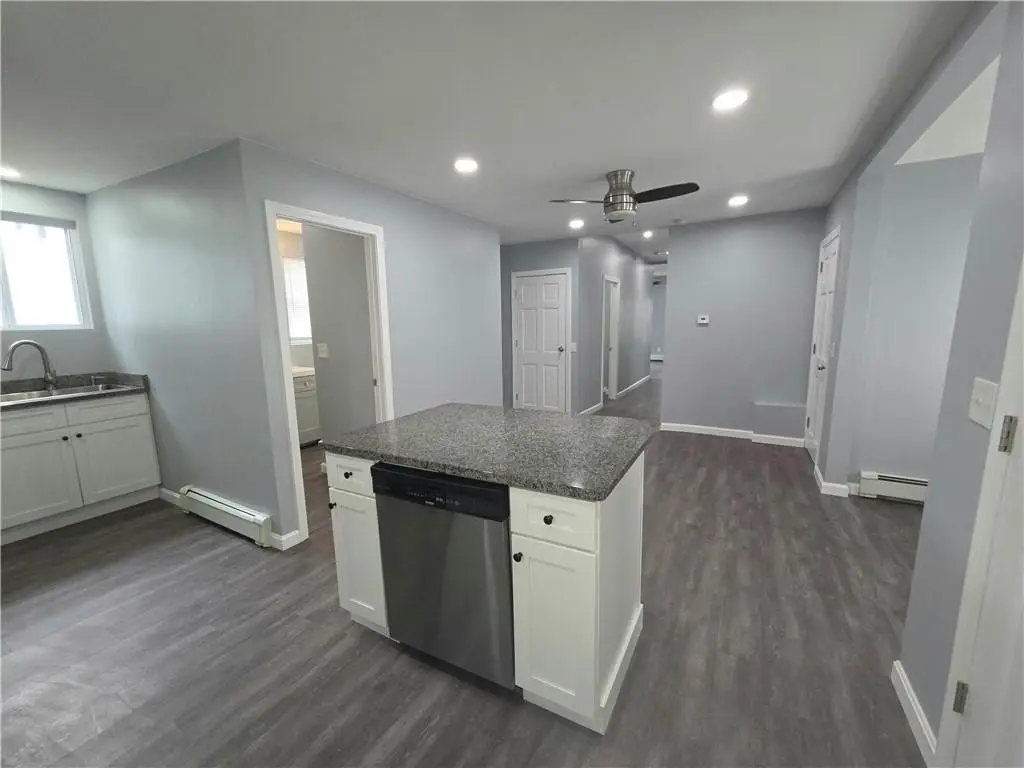
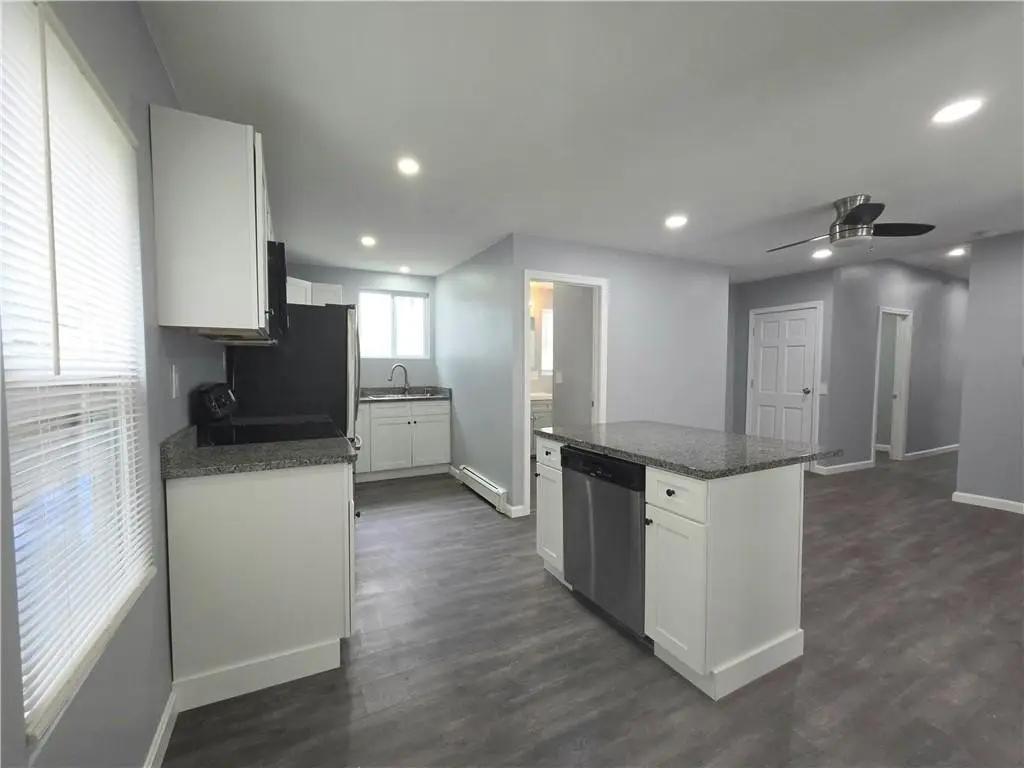
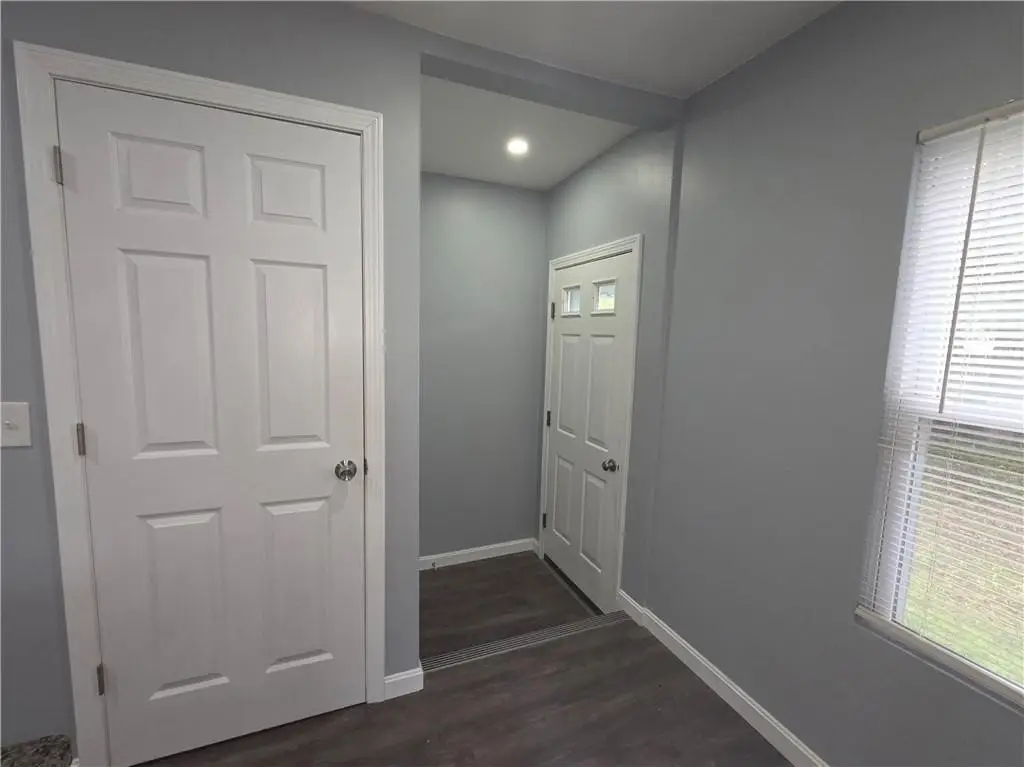
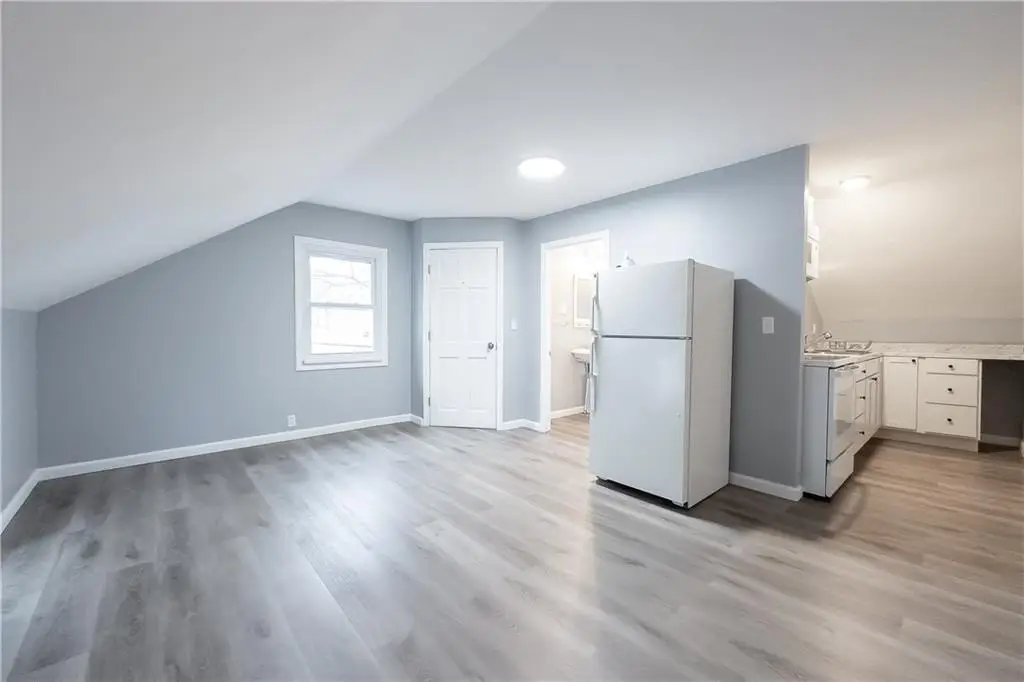
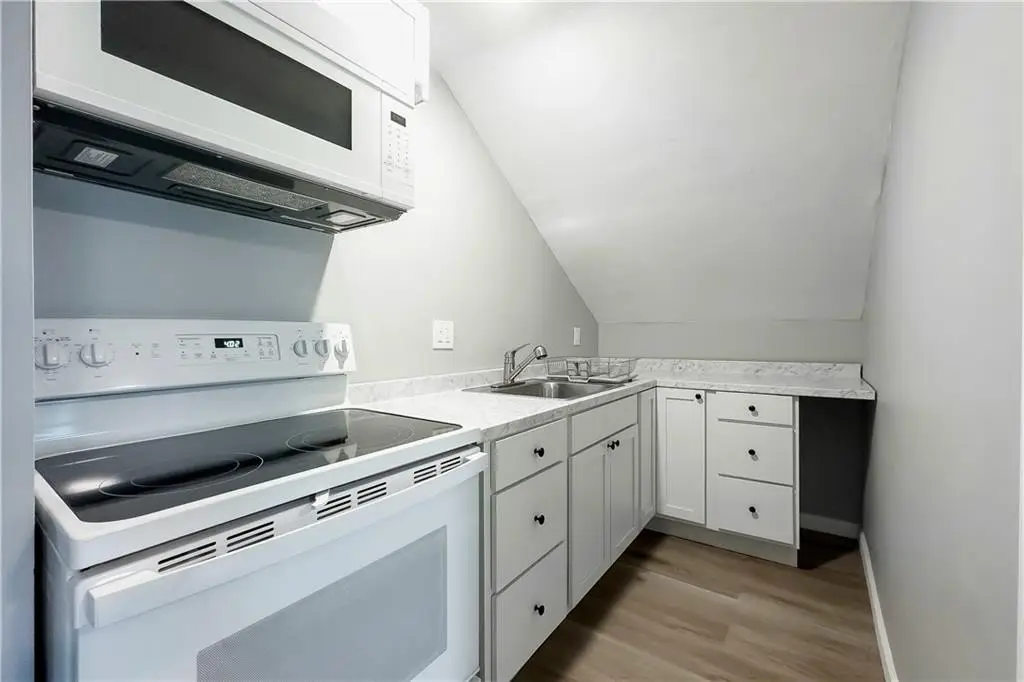
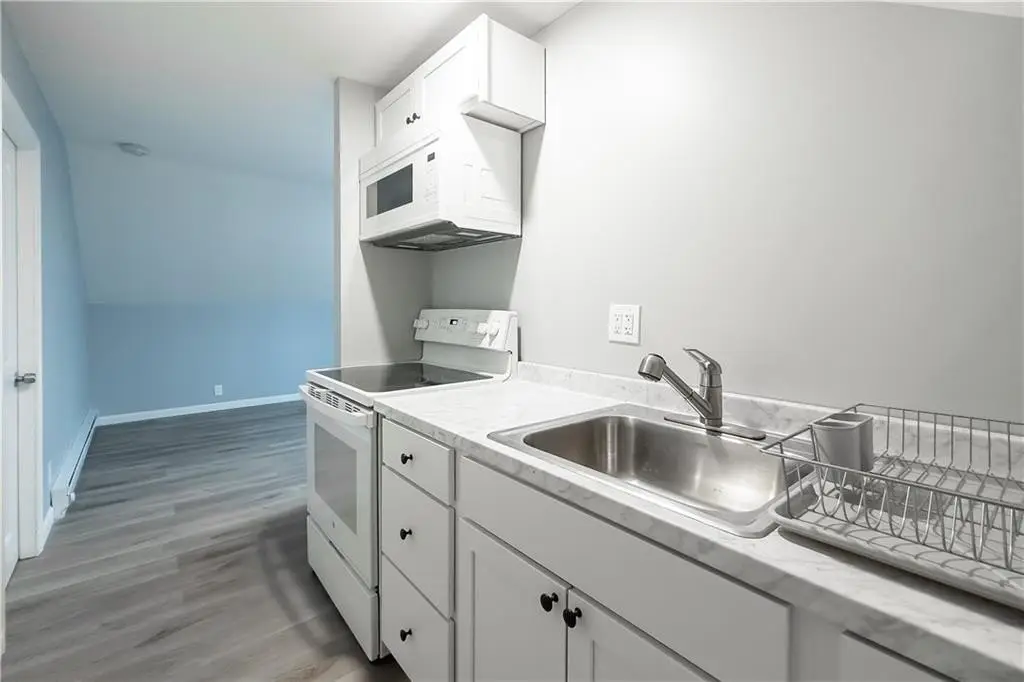
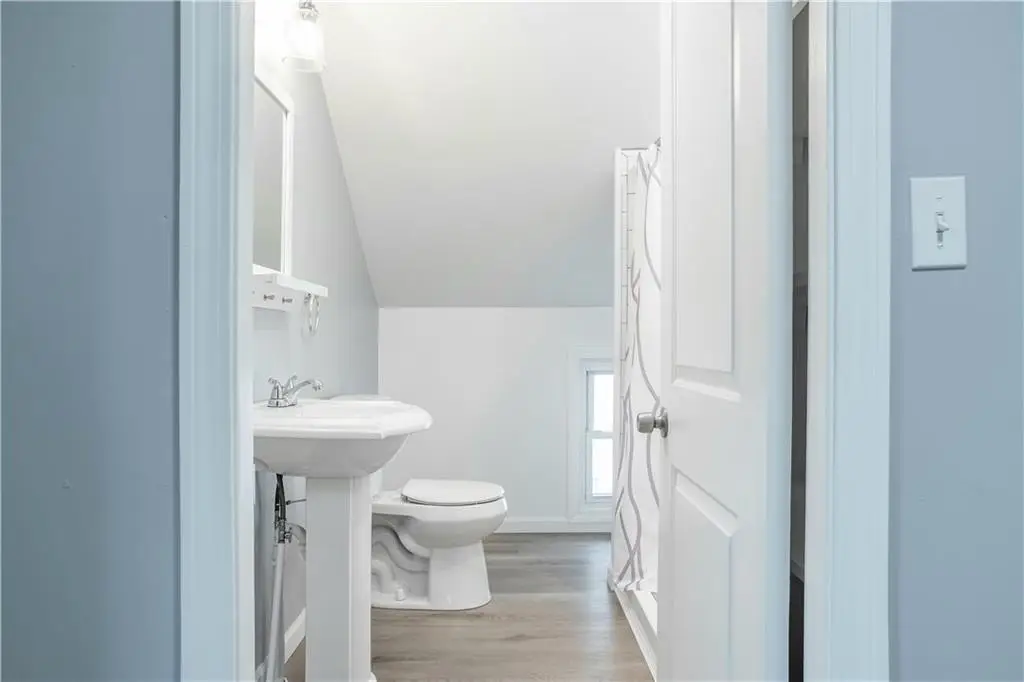
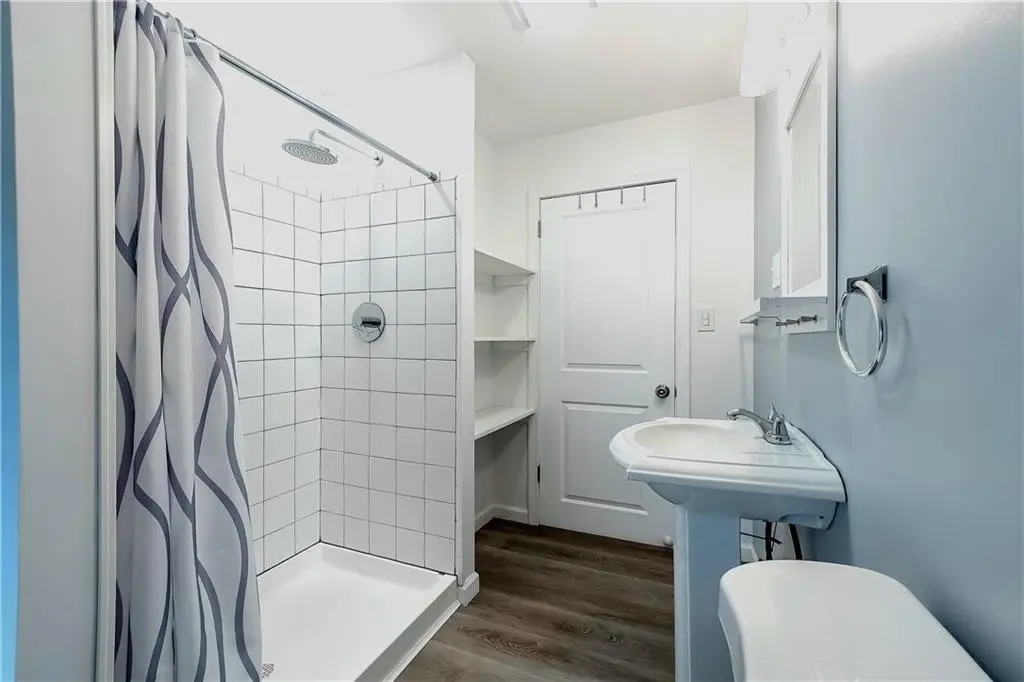
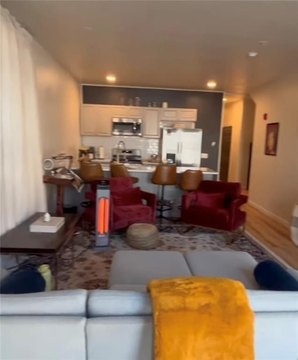
This fully renovated two-family duplex is move-in ready, with both units updated throughout. Improvements include updated kitchens with stainless steel appliances and granite countertops, renovated bathrooms, and fresh vinyl flooring with modern fixtures. The property is configured as separate living spaces for each unit, providing an owner-occupant or rental setup in a low-maintenance condition.
Located in Pawtucket, Rhode Island, the property offers convenient access to I-95 and is near shopping, dining, schools, and other local amenities. The site is zoned RM, supporting multifamily use.
The renovated layout makes this duplex practical for buyers seeking a turnkey property they can occupy immediately while maintaining a second unit for rental use. It also suits investors looking for a two-family asset with substantial interior updates, including kitchens, bathrooms, and finishes already refreshed across both units.
Located in Pawtucket, Rhode Island, the property offers convenient access to I-95 and is near shopping, dining, schools, and other local amenities. The site is zoned RM, supporting multifamily use.
The renovated layout makes this duplex practical for buyers seeking a turnkey property they can occupy immediately while maintaining a second unit for rental use. It also suits investors looking for a two-family asset with substantial interior updates, including kitchens, bathrooms, and finishes already refreshed across both units.
Key Highlights
- Fully renovated two‑family property with both units completely renovated
- Updated kitchens with stainless‑steel appliances and granite countertops
- Updated bathrooms plus fresh vinyl flooring and modern fixtures throughout
Financial Insights For Multifamily LT 5
Simulate Cap Rate and NOI
NOI Build-Up
- Vacancy
- income lost from leasable area expected to sit empty during the year — subtracted from gross rent.
- EGI (Effective Gross Income)
- gross rent minus vacancy losses — the realistic income before paying operating costs.
- OpEx (Operating Expenses)
- recurring costs to operate the property (property tax, insurance, utilities, maintenance, management) — excludes financing and capital improvements.
- NOI (Net Operating Income)
- income a property generates after operating costs but before financing and taxes.
| Component | $ | $/SF |
|---|---|---|
| Gross rent | $45.9k | $25.44 |
| − Vacancy | −$3.0k | −$1.65 |
| EGI | $43.0k | $23.79 |
| − OpEx | −$12.9k | −$7.14 |
| NOI | $30.1k | $16.65 |
1,806 SF · lease $25.44/SF/yr · vacancy 6.50% · expense 30.00%
Alternative Uses
Best Use
Multifamily LT 5
$429.6K
$375.9K – $501.2K
NOI $30,071 @ 7.0% cap · market cap 6.01%
Second Best
Apartment 5plus
$340.9K
$298.3K – $397.8K
NOI $23,865 @ 7.0% cap · market cap 4.77%
Theoretical Best
—
—
same as Best Use
Zoning and permitted uses should be independently verified with authorities.
Property Analytics
Property Profile
Location Intelligence
Current Use





Frequently Asked Questions
What type of property is this?
Duplex - Fully renovated two-family with updated kitchens, bathrooms, and separate living spaces in RM zoning.
Where is this duplex located?
The property is located at 32 Gooding Street Pawtucket, RI.
What is the asking price?
The asking price for this property is $499,977.
What are key features of this property?
This property features: Fully renovated two‑family property with both units completely renovated; Updated kitchens with stainless‑steel appliances and granite countertops; Updated bathrooms plus fresh vinyl flooring and modern fixtures throughout


