Two-Unit Brick Townhouse with
For Sale
$1,250,000
Pending
314A CHAUNCEY Street, Brooklyn, NY 11233
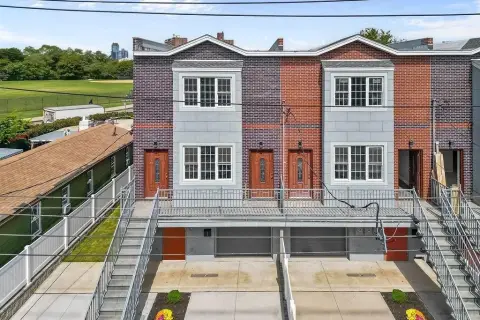
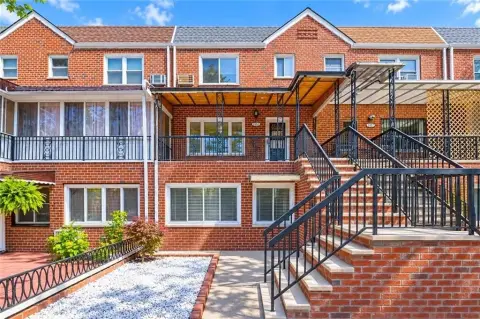
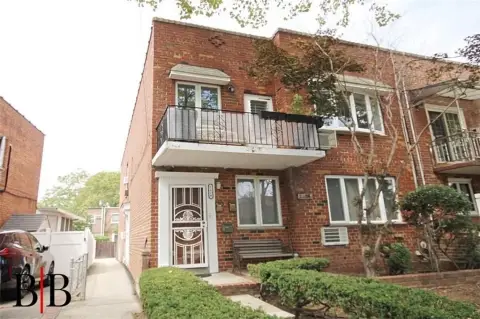
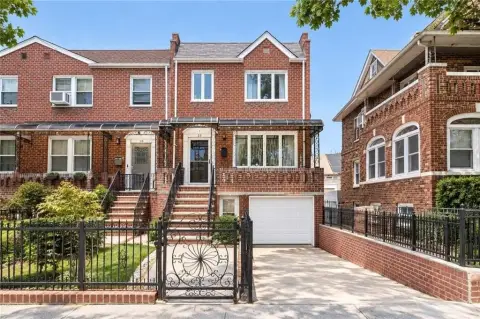
Tenant-occupied two-unit brick townhouse with month-to-month leases and a private rear backyard, plus a finished cellar revenue stream.
Property Size2,742 SF
Days on Market121
Property Features for 314A CHAUNCEY Street
General Information
Standard status
Pending
Size
2,742 SF
Property subtype
Multi Family
Financials
Cap Rate
5.5%
Business Included
Yes
Additional Details
Multifamily Units
2
Taxes and HOA fees
Annual Taxes
$9,600
Building Details
Building Size
2,742 SF
Year Built
2002
Tenancy
Multi
Listing Agency:
Corcoran Group
Listed By:
Amy Martinez Miller
(917) 502-0433
Source:
Miradorrealestate
Added: Jun 12
Changed: Oct 7
Last Checked: Oct 9 at 11:56PM
Displayed information is deemed reliable but is not guaranteed and should be independently verified. All listing content including descriptions, pricing, images are the copyrighted material of Corcoran Group
Investment Insights
Based on property information with market context.
314A Chauncey St is a well-maintained two-unit brick townhouse with a private rear backyard and a cellar level that currently generates supplemental income. The property is tenant-occupied, and both residential units operate on month-to-month leases, offering flexibility for continued rental use or delivery empty. Apartment #1 is a spacious floor-through 2-bedroom, 1.5-bath home with oversized living areas, hardwood floors, central HVAC, stainless steel appliances, and in-unit washer and dryer. Apartment #2 is also a bright floor-through 2-bedroom, 1.5-bath layout, featuring an additional skylit home office that can support remote work or a creative space, along with the same modern convenience features.
Located in Bedford-Stuyvesant’s Stuyvesant Heights area on a tree-lined block, the home is described as moments from the Ralph Avenue A/C subway station. The surrounding area includes local dining and community amenities noted in the remarks, along with bike, walk, and transit scores of 74 (Very Bikeable), 88 (Very Walkable), and 98 (Rider’s Paradise).
For investors, the property’s month-to-month tenancy and currently operating cellar income are designed to support an immediate income approach, with a stated 5.5% cap rate. For an end user, the layout allows owner-occupancy in one unit while collecting rent from the other, with the flexibility of month-to-month lease terms.
Located in Bedford-Stuyvesant’s Stuyvesant Heights area on a tree-lined block, the home is described as moments from the Ralph Avenue A/C subway station. The surrounding area includes local dining and community amenities noted in the remarks, along with bike, walk, and transit scores of 74 (Very Bikeable), 88 (Very Walkable), and 98 (Rider’s Paradise).
For investors, the property’s month-to-month tenancy and currently operating cellar income are designed to support an immediate income approach, with a stated 5.5% cap rate. For an end user, the layout allows owner-occupancy in one unit while collecting rent from the other, with the flexibility of month-to-month lease terms.
Key Highlights
- 2002‑built two‑unit brick townhouse in Bedford‑Stuyvesant’s Stuyvesant Heights section
- Tenant‑occupied with both units on month‑to‑month leases for flexible future use
- Apartment #1: 2 bed, 1.5 bath floor‑through with hardwood floors, central HVAC, stainless appliances, and in‑unit W/D
Financial Insights
Estimated NOI and Cap Rate
NOI / Yr
$96,030
Cap Rate
7.68%
Suggested Prices Based on Cap Rates
Cap Rate 5%
$1,920,600
$1.9M
Cap Rate 7%
$1,371,857
$1.4M
Cap Rate 9%
$1,067,000
$1.1M
Market Conditions
NOI Build-Up for 2,742 SF
Gross rent
$139.8K $51.00/SF
− Vacancy
−$2.7K −$0.97/SF
EGI
$137.2K $50.03/SF
− OpEx
−$41.2K −$15.01/SF
NOI
$96.0K $35.02/SF
Area
Brooklyn, NY
Vacancy
1.90%
Lease Rate
$51.00 /SF/Yr
Expense Ratio
30.00%
Simulate Cap Rate and NOI
Suggested Prices Based on Cap Rates
Cap Rate 5%
$1,920,600
Cap Rate 7%
$1,371,857
Cap Rate 9%
$1,067,000
Alternative Uses
Best Use
Multifamily LT 5
$1.37M
$1.20M – $1.60M
NOI $96,030 @ 7.0% cap · market cap 7.68%
Second Best
Apartment 5plus
$1.20M
$1.05M – $1.40M
NOI $83,710 @ 7.0% cap · market cap 6.70%
Theoretical Best
Specialty Retail
$2.27M
$1.99M – $2.65M
NOI $158,926 @ 7.0% cap · market cap 12.71%
Zoning and permitted uses should be independently verified with authorities.
Property Analytics
Unlock full access to Insights
Subscribe to Realmo Intelligence
Open Analytics
Current Use
Lease Details
2
Residential units
Multi-tenant
Tenancy
Turnkey business
Opportunity
Location Intelligence
Trade Area within ½ mile
3,337
Businesses Nearby
Explore this area
Business Placement
Demographics for 11233, NY
75,399
Population
34,412
Households
2.2
Avg Household Size
35
Median Age
33%
College-Educated
86%
High-School Grad
1.3 sq mi
ZIP Area
57,999
Density / Sq Mi
$62,034
Median Household Income
$47,149
Median Earnings
$1,613
Median Rent
$1,013,000
Median Home Value
Check the figures for this property
Cap Rate, Value Estimation, Potential NOI and more
View Realmo Analytics
Market
Vacancy Rate% for Multifamily in Northeast region

Questions? Ask Rey
Realmo’s AI knows this listing — price, zoning, demand, history. Ask anything.
Frequently Asked Questions
What type of property is this?
Duplex - Tenant-occupied two-unit brick townhouse with month-to-month leases and a private rear backyard, plus a finished cellar revenue stream.
Where is this duplex located?
The property is located at 314A CHAUNCEY Street Brooklyn, NY.
What is the asking price?
The asking price for this property is $1,250,000.
What are key features of this property?
This property features: 2002‑built two‑unit brick townhouse in Bedford‑Stuyvesant’s Stuyvesant Heights section; Tenant‑occupied with both units on month‑to‑month leases for flexible future use; Apartment #1: 2 bed, 1.5 bath floor‑through with hardwood floors, central HVAC, stainless appliances, and in‑unit W/D


