Renovated Mixed-Use
For Sale
Contact for pricing
3131-57 Adams Avenue, San Diego, CA 92116
Two adjacent properties combine apartments, retail suites, and updated residential interiors.
Property Size7,520 SF
Lot Size0.35 Acres
Price / SF$651.60
Days on Market49
Property Features for 3131-57 Adams Avenue
General Information
Standard status
Active
Size
7,520 SF
Net Rentable
7,520 SF
Total Parking Spaces
11
Lot size
0.35 Acres
Property subtype
Mixed Use, Multifamily, Retail
Zoning
CUPD-CU-3-3
Occupancy
100%
Lease Type
Modified Gross
Investment Type
Stabilized
Net Operating Income
$273,395
Site & Location
Highway Access
Yes
Road Access
Yes
Units
Unit Mix
2 x 1BR/1BA cottage, 2 x studio, 9 x 1BR/1BA
Multifamily Units
13
Amenities
on-site laundry
mini-split A/C systems
tankless water heaters
in-unit washer/dryers
low-maintenance landscaping
secure gated entry
courtyard
Building Details
Year Built
1939
Year Renovated
2025
Buildings
6
Stories
1
Units
17
Tenancy
Multi
Listing Agency:
Marcus & Millichap - Downtown San Diego
Listed By:
Ben Sierpina · License #CA 02062416
(858) 775-9825
Source:
Crexi
Added: Sep 1
Changed: Oct 4
Last Checked: Oct 16 at 9:29AM
Displayed information is deemed reliable but is not guaranteed and should be independently verified. All listing content including descriptions, pricing, images are the copyrighted material of Marcus & Millichap - Downtown San Diego

Ask AI about this property
Review the available facts, identify missing information and prepare questions for the agent.
Investment Insights
Based on property information with market context.
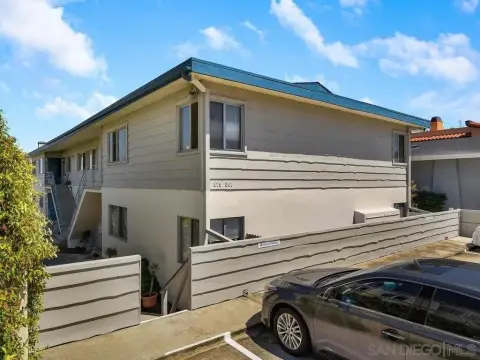
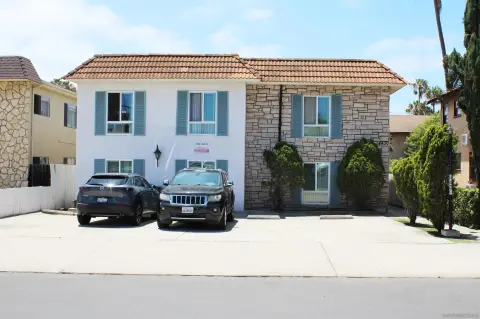
This mixed-use portfolio comprises two adjacent Adams Avenue properties with 17 total units and approximately 7,520 rentable square feet on 15,246 square feet of land. The residential component includes 13 units: two detached one-bedroom, one-bath cottages, two studios, and nine one-bedroom, one-bath apartments. Four retail spaces occupy the companion property, with current occupants including a massage studio, pet grooming salon, and bookstore operating across two combined spaces.
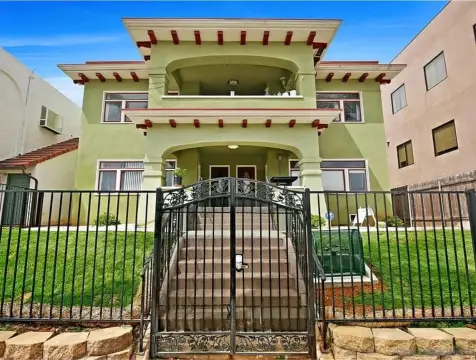
Residential improvements completed in 2025 include quartz countertops, refreshed cabinetry, new appliances, remodeled bathrooms, and a combination of refinished hardwood and vinyl plank flooring. All residential units have mini-split air-conditioning systems and tankless water heaters, while seven apartments include full-size stackable washer/dryers. The apartment property also features a modernized courtyard, gated entry, new security doors, and a new roof.
The site includes seven off-street parking spaces and four single-car garages. Zoning is CUPD-CU-3-3, and both properties fall within Complete Communities Tier 3, which allows up to 6.5 FAR. The portfolio is located on Adams Avenue in San Diego, with a Walk Score of 92 and access to Interstates 805, 8, and 5.
Residential improvements completed in 2025 include quartz countertops, refreshed cabinetry, new appliances, remodeled bathrooms, and a combination of refinished hardwood and vinyl plank flooring. All residential units have mini-split air-conditioning systems and tankless water heaters, while seven apartments include full-size stackable washer/dryers. The apartment property also features a modernized courtyard, gated entry, new security doors, and a new roof.
The site includes seven off-street parking spaces and four single-car garages. Zoning is CUPD-CU-3-3, and both properties fall within Complete Communities Tier 3, which allows up to 6.5 FAR. The portfolio is located on Adams Avenue in San Diego, with a Walk Score of 92 and access to Interstates 805, 8, and 5.
Key Highlights
- 17‑unit mixed‑use portfolio with approximately 7,520 rentable square feet
- 13 residential units plus four retail spaces across two adjacent Adams Avenue properties
- Residential interiors and common areas renovated in 2025
Financial Insights
Estimated NOI and Cap Rate
NOI / Yr
$181,526
Cap Rate
3.70%
Suggested Prices Based on Cap Rates
Cap Rate 5%
$3,630,520
$3.6M
Cap Rate 7%
$2,593,229
$2.6M
Cap Rate 9%
$2,016,956
$2.0M
Market Conditions
NOI Build-Up for 7,520 SF
Gross rent
$270.7K $36.00/SF
− Vacancy
−$11.4K −$1.52/SF
EGI
$259.3K $34.48/SF
− OpEx
−$77.8K −$10.35/SF
NOI
$181.5K $24.14/SF
Area
San Diego, CA
Vacancy
4.21%
Lease Rate
$36.00 /SF/Yr
Expense Ratio
30.00%
Simulate Cap Rate and NOI
Suggested Prices Based on Cap Rates
Cap Rate 5%
$3,630,520
Cap Rate 7%
$2,593,229
Cap Rate 9%
$2,016,956
Alternative Uses
Best Use
Retail
$2.59M
$2.27M – $3.03M
NOI $181,526 @ 7.0% cap · market cap 3.70%
Second Best
Mixed Use
$2.08M
$1.82M – $2.42M
NOI $145,286 @ 7.0% cap · market cap 2.97%
Theoretical Best
Specialty Retail
$2.97M
$2.60M – $3.47M
NOI $207,913 @ 7.0% cap · market cap 4.24%
Zoning and permitted uses should be independently verified with authorities.
How Realmo checks its estimates
Property Analytics
Current Use
Lease Details
13
Residential units
Yes
Highway access
Yes
Paved road access
Location Intelligence
Trade Area within ½ mile
3,117
Businesses Nearby
Explore this area
Business Placement
Demographics for 92116, CA
31,523
Population
17,827
Households
1.8
Avg Household Size
37
Median Age
58%
College-Educated
96%
High-School Grad
3.4 sq mi
ZIP Area
9,271
Density / Sq Mi
$95,775
Median Household Income
$63,420
Median Earnings
$1,903
Median Rent
$898,500
Median Home Value
Market
Vacancy Rate% for Multifamily in West region





Frequently Asked Questions
What type of property is this?
Mixed-use property - Two adjacent properties combine apartments, retail suites, and updated residential interiors.
Where is this mixed-use property located?
The property is located at 3131-57 Adams Avenue San Diego, CA.
What is the asking price?
The asking price for this property is $4,900,000.
What are key features of this property?
This property features: 17‑unit mixed‑use portfolio with approximately 7,520 rentable square feet; 13 residential units plus four retail spaces across two adjacent Adams Avenue properties; Residential interiors and common areas renovated in 2025