Waterfront Residential Income
For Sale
$770,000
3112 Emmons Avenue 3120A2, Brooklyn, NY 11235
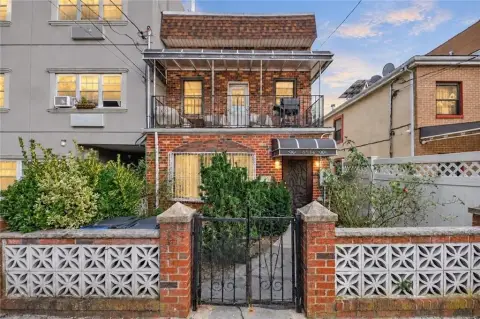
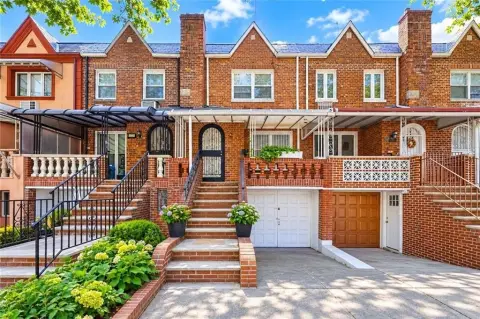
Two-bedroom duplex with a private patio, waterfront setting, and resident parking.
Property Size1,760 SF
Price / SF$437.50
Days on Market185
Property Features for 3112 Emmons Avenue 3120A2
General Information
Standard status
Active
Size
1,760 SF
Property subtype
Apartment
Units
Unit Mix
1 x 2BR/2BA + home office
Multifamily Units
1
Taxes and HOA fees
Annual Taxes
$7,332
Amenities
private outdoor patio
in-unit washer/dryer
swimming pool
fitness center
landscaped common areas
Building Details
Building Size
1,760 SF
Year Built
2007
Listing Agency:
Compass
Listed By:
Jeff M Reyngach
(917) 533-8540
Source:
Howardhannanyc
Added: Apr 8
Changed: Sep 28
Last Checked: Oct 7 at 3:06PM
Displayed information is deemed reliable but is not guaranteed and should be independently verified. All listing content including descriptions, pricing, images are the copyrighted material of Compass
Investment Insights
Based on property information with market context.
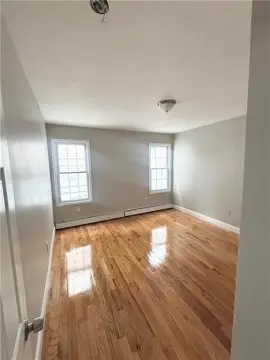
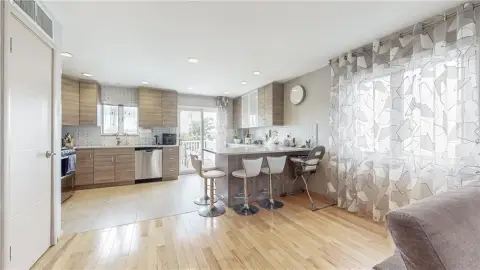
This 1,760 SF duplex includes two bedrooms, a home office, and two bathrooms within a waterfront residential development in Sheepshead Bay. The interior features an open living and dining area, a kitchen with stainless-steel appliances, custom cabinetry, and stone countertops, plus an in-unit washer and dryer. Both bedrooms offer closet space, while the bathrooms include designer fixtures and spa-style finishes. A private patio extends the living area outdoors.
Residents have access to shared waterfront outdoor areas, a swimming pool, fitness center, and landscaped common spaces. On-site resident parking is included. The property is located at 3112 Emmons Avenue in Brooklyn, near waterfront amenities, restaurants, and cafes. The building was constructed in 2007.
Residents have access to shared waterfront outdoor areas, a swimming pool, fitness center, and landscaped common spaces. On-site resident parking is included. The property is located at 3112 Emmons Avenue in Brooklyn, near waterfront amenities, restaurants, and cafes. The building was constructed in 2007.
Key Highlights
- 1,760 SF duplex with 2 bedrooms, a home office, and 2 bathrooms
- Private outdoor patio for dining or additional living space
- Waterfront setting in Sheepshead Bay
Financial Insights
Estimated NOI and Cap Rate
NOI / Yr
$53,731
Cap Rate
6.98%
Suggested Prices Based on Cap Rates
Cap Rate 5%
$1,074,620
$1.1M
Cap Rate 7%
$767,586
$767.6K
Cap Rate 9%
$597,011
$597.0K
Market Conditions
NOI Build-Up for 1,760 SF
Gross rent
$99.7K $56.64/SF
− Vacancy
−$2.0K −$1.13/SF
EGI
$97.7K $55.51/SF
− OpEx
−$44.0K −$24.98/SF
NOI
$53.7K $30.53/SF
Area
Brooklyn, NY
Vacancy
2.00%
Lease Rate
$56.64 /SF/Yr
Expense Ratio
45.00%
Simulate Cap Rate and NOI
Suggested Prices Based on Cap Rates
Cap Rate 5%
$1,074,620
Cap Rate 7%
$767,586
Cap Rate 9%
$597,011
Alternative Uses
Best Use
Apartment 5plus
$767.6K
$671.6K – $895.5K
NOI $53,731 @ 7.0% cap · market cap 6.98%
Second Best
—
—
no second resolved use
Theoretical Best
Specialty Retail
$1.46M
$1.28M – $1.70M
NOI $102,010 @ 7.0% cap · market cap 13.25%
Zoning and permitted uses should be independently verified with authorities.
Property Analytics
Current Use
Lease Details
1
Residential units
Location Intelligence
Trade Area within ½ mile
1,124
Businesses Nearby
Explore this area
Business Placement
Demographics for 11235, NY
88,482
Population
37,188
Households
2.4
Avg Household Size
44
Median Age
50%
College-Educated
90%
High-School Grad
2.5 sq mi
ZIP Area
35,393
Density / Sq Mi
$61,689
Median Household Income
$48,898
Median Earnings
$1,649
Median Rent
$723,900
Median Home Value

Questions? Ask Rey
Realmo’s AI knows this listing — price, zoning, demand, history. Ask anything.

Frequently Asked Questions
What type of property is this?
Residential income property - Two-bedroom duplex with a private patio, waterfront setting, and resident parking.
Where is this residential income property located?
The property is located at 3112 Emmons Avenue 3120A2 Brooklyn, NY.
What is the asking price?
The asking price for this property is $770,000.
What are key features of this property?
This property features: 1,760 SF duplex with 2 bedrooms, a home office, and 2 bathrooms; Private outdoor patio for dining or additional living space; Waterfront setting in Sheepshead Bay


