Street-Front Restaurant and
For Sale
$2,995,391
308 Seabreeze Boulevard, Daytona Beach, FL 32118
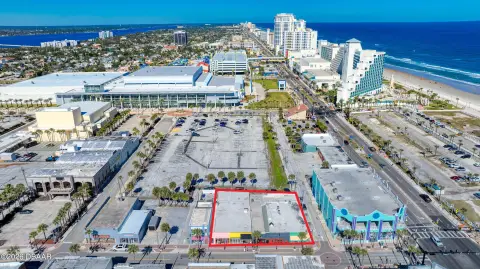
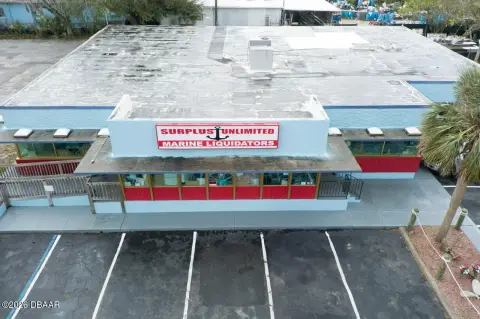
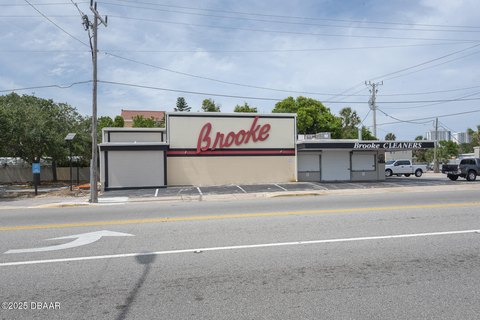
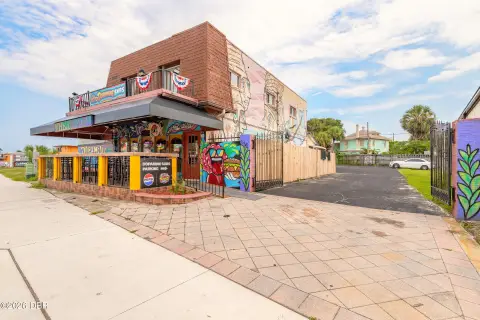
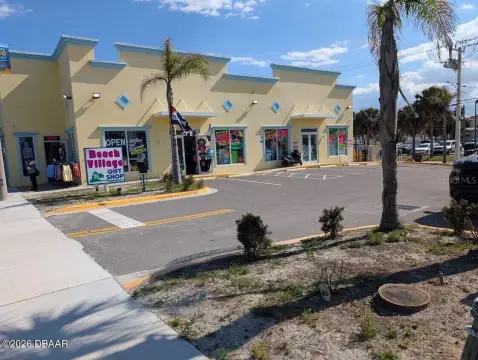
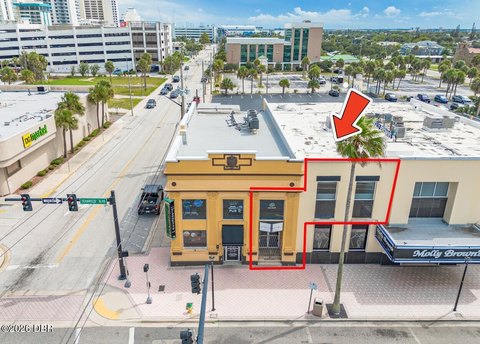
Street-front in-line property with three full kitchens, six wet bars, and an outdoor bar/seating area.
Property Size17,636 SF
Price / SF$169.85
Days on Market99
Property Features for 308 Seabreeze Boulevard
General Information
Standard status
Active
Size
17,636 SF
Property subtype
Retail
Additional Details
Business Included
Yes
Listing Agency:
CBRE | Orlando
Listed By:
Kathy Bonini · License #SL3398579
(407) 404-5097
Source:
Cbre
Added: Jul 17
Changed: Oct 22
Last Checked: Oct 23 at 5:30AM
Displayed information is deemed reliable but is not guaranteed and should be independently verified. All listing content including descriptions, pricing, images are the copyrighted material of CBRE | Orlando

Ask AI about this property
Review the available facts, identify missing information and prepare questions for the agent.
Investment Insights
Based on property information with market context.
This street-front in-line restaurant and bar opportunity includes three full kitchens and six wet bars, along with an outdoor bar and seating area. The property is configured to support on-site food and beverage service.
Located in the Seabreeze Blvd Entertainment District between the intercoastal waterway and the beach, the site offers convenient walkable access to nearby Daytona Beach entertainment, retailers, and activity.
The layout is suited for hospitality operations that require multiple kitchen stations and wet bar service, with outdoor guest seating also incorporated into the overall concept.
Located in the Seabreeze Blvd Entertainment District between the intercoastal waterway and the beach, the site offers convenient walkable access to nearby Daytona Beach entertainment, retailers, and activity.
The layout is suited for hospitality operations that require multiple kitchen stations and wet bar service, with outdoor guest seating also incorporated into the overall concept.
Key Highlights
- Street‑front in‑line property in Daytona Beach’s Seabreeze Blvd Entertainment District
- Over 17,600 SF with a multi‑kitchen setup, including three full kitchens
- Six wet bars plus an outdoor bar/seating area
Financial Insights
Estimated NOI and Cap Rate
NOI / Yr
$267,809
Cap Rate
8.94%
Suggested Prices Based on Cap Rates
Cap Rate 5%
$5,356,180
$5.4M
Cap Rate 7%
$3,825,843
$3.8M
Cap Rate 9%
$2,975,656
$3.0M
Market Conditions
NOI Build-Up for 17,636 SF
Gross rent
$387.3K $21.96/SF
− Vacancy
−$30.2K −$1.71/SF
EGI
$357.1K $20.25/SF
− OpEx
−$89.3K −$5.06/SF
NOI
$267.8K $15.19/SF
Area
Volusia County, FL
Vacancy
7.80%
Lease Rate
$21.96 /SF/Yr
Expense Ratio
25.00%
Simulate Cap Rate and NOI
Suggested Prices Based on Cap Rates
Cap Rate 5%
$5,356,180
Cap Rate 7%
$3,825,843
Cap Rate 9%
$2,975,656
Alternative Uses
Best Use
Specialty Retail
$3.83M
$3.35M – $4.46M
NOI $267,809 @ 7.0% cap · market cap 8.94%
Second Best
Retail
$2.37M
$2.08M – $2.77M
NOI $166,105 @ 7.0% cap · market cap 5.55%
Theoretical Best
Office A
$5.20M
$4.55M – $6.07M
NOI $364,007 @ 7.0% cap · market cap 12.15%
Zoning and permitted uses should be independently verified with authorities.
How Realmo checks its estimates
Property Analytics
Who owns this building?
See the owner, sales and loan history
Open Analytics
Current Use
Lease Details
Turnkey business
Opportunity
Location Intelligence
Trade Area within ½ mile
1,160
Businesses Nearby
85k
Monthly Visits Nearby
Under-served
Demand for This Use
Explore this area
Business Placement
Foot Traffic Nearby
Dining 72%
Shops & Services 19%
Hotels & Casinos 9%
Dick's Last Resort
Dining
20,658 visits/mo
0.4 miles
Burger King
Dining
10,780 visits/mo
0.4 miles
IHOP
Dining
9,642 visits/mo
0.3 miles
7-Eleven
Shops & Services
6,645 visits/mo
0.3 miles
Waffle House
Dining
5,706 visits/mo
0.1 miles
Demographics for 32118, FL
17,906
Population
16,390
Households
1.1
Avg Household Size
58
Median Age
31%
College-Educated
94%
High-School Grad
4.2 sq mi
ZIP Area
4,263
Density / Sq Mi
$60,418
Median Household Income
$36,153
Median Earnings
$1,283
Median Rent
$339,500
Median Home Value
Check the figures for this property
Cap Rate, Value Estimation, Potential NOI and more
View Realmo Analytics
Market
Vacancy Rate% for Retail in South region





Frequently Asked Questions
What type of property is this?
Storefront property - Street-front in-line property with three full kitchens, six wet bars, and an outdoor bar/seating area.
Where is this storefront property located?
The property is located at 308 Seabreeze Boulevard Daytona Beach, FL.
What is the asking price?
The asking price for this property is $2,995,391.
What are key features of this property?
This property features: Street‑front in‑line property in Daytona Beach’s Seabreeze Blvd Entertainment District; Over 17,600 SF with a multi‑kitchen setup, including three full kitchens; Six wet bars plus an outdoor bar/seating area


