Updated Four-Unit
For Sale
Contact for pricing
3030 5TH ST N, St Petersburg, FL 33704
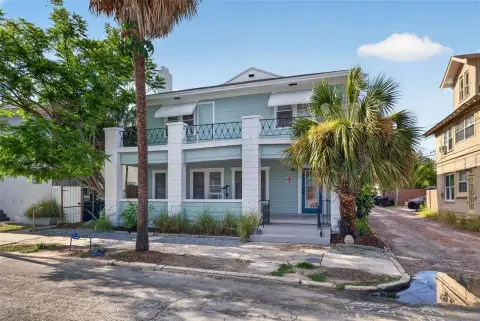
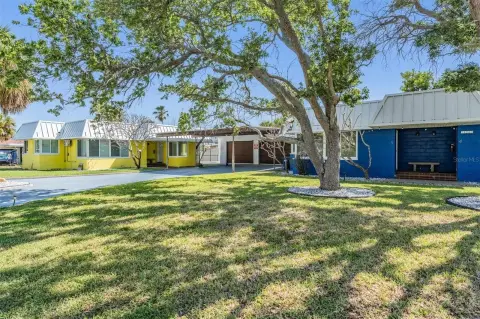
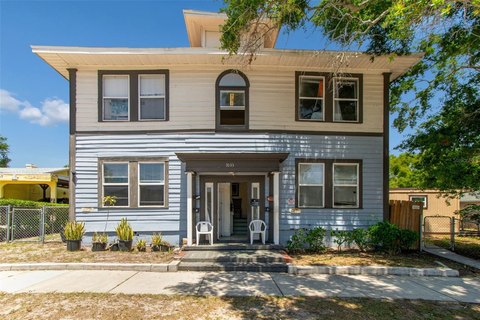
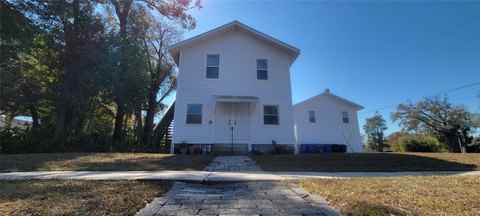
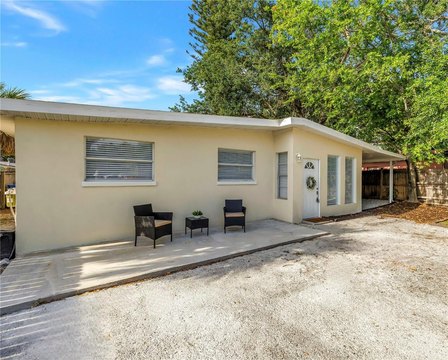
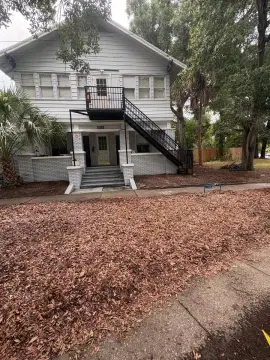
Four-unit multifamily property with updated residences, private outdoor areas, off-street parking, and separate utility metering in St. Petersburg.
Property Size3,857 SF
Days on Market151
Property Features for 3030 5TH ST N
General Information
Standard status
Active
Size
3,857 SF
Property subtype
Triplex
Units
Unit Mix
1 x 2BR/1BA, 1 x 2BR/2.5BA, 1 x studio, 1 x 1BR/1BA
Multifamily Units
4
Taxes and HOA fees
Annual Taxes
$13,396
Amenities
shared laundry
coin-operated laundry
storage shed
fenced yard
patio
irrigation system
Building Details
Building Size
3,857 SF
Year Built
1950
Listing Agency:
COMPASS FLORIDA LLC
Listed By:
Jerilyn Rush · License #3151248
(813) 927-6795
Source:
Thefullerproperties
Added: May 9
Changed: Sep 26
Last Checked: Oct 6 at 12:44AM
Displayed information is deemed reliable but is not guaranteed and should be independently verified. All listing content including descriptions, pricing, images are the copyrighted material of COMPASS FLORIDA LLC
Investment Insights
Based on property information with market context.
Built in 1950, this four-unit quadplex combines varied residential layouts with substantial recent improvements. The unit mix includes a renovated 2-bedroom, 1-bath residence; a two-story 2-bedroom, 2.5-bath townhouse with a bonus room, attached 2-car garage, oversized driveway, storage shed, and fenced yard; a 1-bedroom efficiency; and an upstairs 1-bedroom, 1-bath unit. Features across the property include updated kitchens and baths, stainless steel appliances, quartz countertops, refreshed flooring, new AC equipment, and shared or dedicated laundry arrangements. Several units offer private yards, patios, or dedicated parking.
The property is located at 3030 5TH ST N in St. Petersburg, near The Fresh Market and The Body Electric Yoga Company. Capital improvements include a brand-new roof, new fencing, fresh interior and exterior paint, new sod, and an irrigation system. Utility arrangements vary by unit, with tenant-paid utilities and separate metering in multiple residences.
The property is located at 3030 5TH ST N in St. Petersburg, near The Fresh Market and The Body Electric Yoga Company. Capital improvements include a brand-new roof, new fencing, fresh interior and exterior paint, new sod, and an irrigation system. Utility arrangements vary by unit, with tenant-paid utilities and separate metering in multiple residences.
Key Highlights
- Four‑unit property with a mix of 2‑bedroom, 1‑bedroom, efficiency, and townhouse‑style residences
- Unit 2 includes a 2‑car garage, oversized driveway, storage shed, and large fenced yard
- Unit 1 offers a renovated 2‑bedroom, 1‑bath layout with a fenced side yard and parking pad
Financial Insights
Estimated NOI and Cap Rate
NOI / Yr
$45,021
Cap Rate
3.03%
Suggested Prices Based on Cap Rates
Cap Rate 5%
$900,420
$900.4K
Cap Rate 7%
$643,157
$643.2K
Cap Rate 9%
$500,233
$500.2K
Market Conditions
NOI Build-Up for 3,857 SF
Gross rent
$69.0K $17.88/SF
− Vacancy
−$4.6K −$1.21/SF
EGI
$64.3K $16.67/SF
− OpEx
−$19.3K −$5.00/SF
NOI
$45.0K $11.67/SF
Area
Pinellas County, FL
Vacancy
6.74%
Lease Rate
$17.88 /SF/Yr
Expense Ratio
30.00%
Simulate Cap Rate and NOI
Suggested Prices Based on Cap Rates
Cap Rate 5%
$900,420
Cap Rate 7%
$643,157
Cap Rate 9%
$500,233
Alternative Uses
Best Use
Multifamily LT 5
$643.2K
$562.8K – $750.4K
NOI $45,021 @ 7.0% cap · market cap 3.03%
Second Best
Apartment 5plus
$506.8K
$443.4K – $591.2K
NOI $35,473 @ 7.0% cap · market cap 2.39%
Theoretical Best
Office A
$1.00M
$877.8K – $1.17M
NOI $70,227 @ 7.0% cap · market cap 4.73%
Zoning and permitted uses should be independently verified with authorities.
Property Analytics
Unlock full access to Insights
Subscribe to Realmo Intelligence
Open Analytics
Current Use
Lease Details
4
Residential units
Location Intelligence
Trade Area within ½ mile
1,273
Businesses Nearby
Explore this area
Business Placement
Demographics for 33704, FL
16,031
Population
9,037
Households
1.8
Avg Household Size
46
Median Age
58%
College-Educated
98%
High-School Grad
3.4 sq mi
ZIP Area
4,715
Density / Sq Mi
$102,647
Median Household Income
$63,803
Median Earnings
$1,398
Median Rent
$657,400
Median Home Value
Check the figures for this property
Cap Rate, Value Estimation, Potential NOI and more
View Realmo Analytics
Market
Vacancy Rate% for Multifamily in South region

Questions? Ask Rey
Realmo’s AI knows this listing — price, zoning, demand, history. Ask anything.





Frequently Asked Questions
What type of property is this?
Quadplex - Four-unit multifamily property with updated residences, private outdoor areas, off-street parking, and separate utility metering in St. Petersburg.
Where is this quadplex located?
The property is located at 3030 5TH ST N St Petersburg, FL.
What is the asking price?
The asking price for this property is $1,485,000.
What are key features of this property?
This property features: Four‑unit property with a mix of 2‑bedroom, 1‑bedroom, efficiency, and townhouse‑style residences; Unit 2 includes a 2‑car garage, oversized driveway, storage shed, and large fenced yard; Unit 1 offers a renovated 2‑bedroom, 1‑bath layout with a fenced side yard and parking pad



