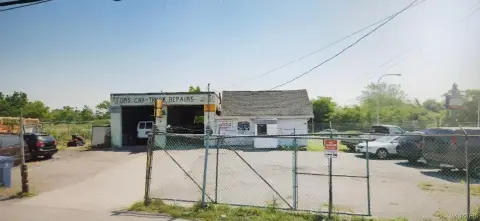
Automotive Repair Shop with
For Sale
$795,000
303 Hopkins Road, Buffalo, NY 14221
Automotive facility with drive-in access, exterior parking, and space for vehicles, trailers, equipment, and materials.
Property Size5,442 SF
Price / SF$146.09
Days on Market88
Property Features for 303 Hopkins Road
General Information
Standard status
Active
Size
5,442 SF
Property subtype
Industrial
Additional Details
Highway Access
Yes
Building Details
Building Size
5,442 SF
Buildings
1
Listing Agency:
Buffalo Office
Listed By:
Robert H. Cowing III
(716) 852-7500
Source:
Pyramidbrokerage
Added: Jul 22
Changed: Oct 8
Last Checked: Oct 16 at 5:52AM
Displayed information is deemed reliable but is not guaranteed and should be independently verified. All listing content including descriptions, pricing, images are the copyrighted material of Buffalo Office

Ask AI about this property
Review the available facts, identify missing information and prepare questions for the agent.
Investment Insights
Based on property information with market context.
This 5,442-square-foot automotive facility is configured for repair and body shop operations, with drive-in access and dedicated areas for vehicle storage, contractor equipment, trailer parking, material staging, and fleet space. Exterior parking supports the property’s operational layout.
The property is located at 303 Hopkins Road in Buffalo, NY, within an industrial zoning area and an established South Buffalo industrial corridor. Automotive and service-related businesses surround the site, with access to major Buffalo highways and regional transportation routes.
The facility can accommodate automotive repair, collision repair, performance shop, tire, and brake center uses, as described for the property.
The property is located at 303 Hopkins Road in Buffalo, NY, within an industrial zoning area and an established South Buffalo industrial corridor. Automotive and service-related businesses surround the site, with access to major Buffalo highways and regional transportation routes.
The facility can accommodate automotive repair, collision repair, performance shop, tire, and brake center uses, as described for the property.
Key Highlights
- 5,442‑square‑foot automotive repair and body shop facility
- Drive‑in access supports vehicle movement into the building
- Dedicated areas for vehicle storage, fleet space, and material staging
Financial Insights
Estimated NOI and Cap Rate
NOI / Yr
$53,009
Cap Rate
6.67%
Suggested Prices Based on Cap Rates
Cap Rate 5%
$1,060,180
$1.1M
Cap Rate 7%
$757,271
$757.3K
Cap Rate 9%
$588,989
$589.0K
Market Conditions
NOI Build-Up for 5,442 SF
Gross rent
$84.9K $15.60/SF
− Vacancy
−$9.2K −$1.68/SF
EGI
$75.7K $13.92/SF
− OpEx
−$22.7K −$4.17/SF
NOI
$53.0K $9.74/SF
Area
Buffalo, NY
Vacancy
10.80%
Lease Rate
$15.60 /SF/Yr
Expense Ratio
30.00%
Simulate Cap Rate and NOI
Suggested Prices Based on Cap Rates
Cap Rate 5%
$1,060,180
Cap Rate 7%
$757,271
Cap Rate 9%
$588,989
Alternative Uses
Best Use
Retail
$757.3K
$662.6K – $883.5K
NOI $53,009 @ 7.0% cap · market cap 6.67%
Second Best
Industrial
$544.5K
$476.5K – $635.3K
NOI $38,118 @ 7.0% cap · market cap 4.79%
Theoretical Best
Office A
$1.31M
$1.15M – $1.53M
NOI $91,608 @ 7.0% cap · market cap 11.52%
Zoning and permitted uses should be independently verified with authorities.
How Realmo checks its estimates
Property Analytics
Current Use
Lease Details
Yes
Highway access
Location Intelligence
Trade Area within ½ mile
208
Businesses Nearby
Under-served
Demand for This Use
Explore this area
Business Placement
Demographics for 14221, NY
55,275
Population
25,281
Households
2.2
Avg Household Size
48
Median Age
57%
College-Educated
96%
High-School Grad
23.4 sq mi
ZIP Area
2,362
Density / Sq Mi
$101,275
Median Household Income
$58,665
Median Earnings
$1,560
Median Rent
$298,500
Median Home Value
Market
Vacancy Rate% for Retail in Buffalo, NY




Frequently Asked Questions
What type of property is this?
Auto shop - Automotive facility with drive-in access, exterior parking, and space for vehicles, trailers, equipment, and materials.
Where is this auto shop located?
The property is located at 303 Hopkins Road Buffalo, NY.
What is the asking price?
The asking price for this property is $795,000.
What are key features of this property?
This property features: 5,442‑square‑foot automotive repair and body shop facility; Drive‑in access supports vehicle movement into the building; Dedicated areas for vehicle storage, fleet space, and material staging